Few weeks ago with a big curiosity I was reading several articles published by Percona about TPCC Benchmark results and MySQL 8.0 "checkpointing" issues..
Unfortunately, in these articles there was no any explanation nor any tentative to understand what is going on, an probably at least try and validate some "first coming in mind" tuning / troubleshooting options.. (And even no any try to show in action so often advertised PMM, and see on what it'll point ?)..
All in all, in the following article I'll try to feel up the "white holes" left in this TPCC testing..
Results Reported by Percona
To avoid you to switch between articles and simplify overall reading, I've copied directly here some of the images from Percona site (keeping the original link reference for every one).
The following graph is representing TPS results obtained by Vadim on TPCC 10x100W workload using SATA SSD drive and MySQL 8.0 configured with 140GB BP size :
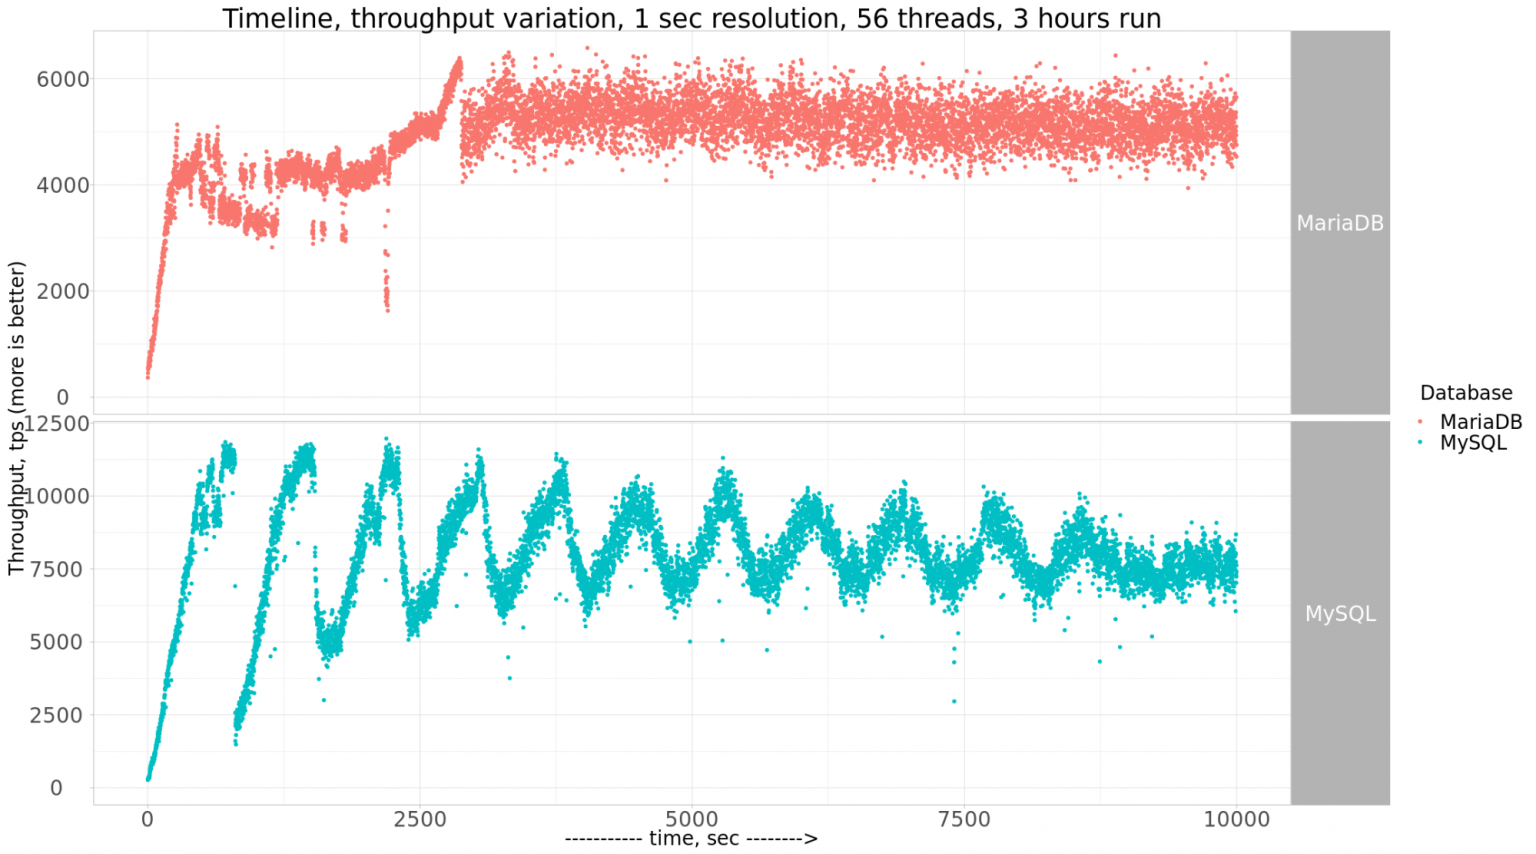
ref : https://www.percona.com/blog/2020/07/29/checkpointing-in-mysql-and-mariadb/
Comments :
- the data set is representing ~100GB in total, and InnoDB Buffer Pool (BP) size was set to 140GB
- so, the whole data set can be cached in BP (what is generally called "in-memory" workload, as there will be no IO reads (at least they are not expected))
- and what is totally strange for me -- is to see such TPS "waves" during this test workload..
- specially with MySQL 8.0 ;-))
Indeed, such kind of problems were pretty common in the past.. -- but this was so far in time now, that I could not imagine to see it one day again. So, my first feeling was "there should be something wrongly configured"..
Why ?
- because on "in-memory" workload nothing really could happen to create you such TPS stalls..
- if you hit any bottleneck contentions => they will just slow TPS down, but not create stalls
- the used TPCC 10x100W scenario is equal to 10x TPCC 100W "independent" workloads running in parallel, so even potential lock contentions are divided by 10 here..
- dirty pages flushing is going in background and not blocking users..
- transaction latency is totally depending on REDO writes + fsync (and it's hard to believe to so long REDO fsync stalls)..
- the only potentially possible issue here could be lagging in flushing of dirty pages (in this case if we're not flushing fast enough to follow REDO writes rate, we'll see growing Checkpoint Age => so, at some point there will be no more free space in REDO, and all transactions will wait for REDO which could get some free space again only once dirty page flushing could reduce Checkpoint Age again..
Some History Background
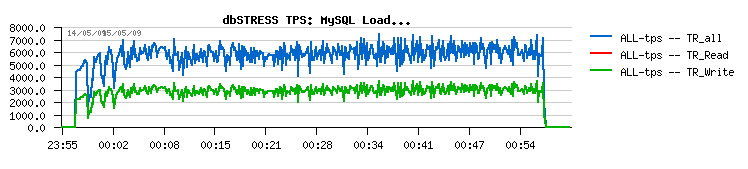
In the times of MySQL 5.5 (and specially before) the story was really bad, and to avoid stalls you could reduce the total size of your REDO log to make at least stalls shorter, but make a sacrifice of some level of performance :
While with bigger REDO you were getting more than 30% higher TPS, but with deep stalls :
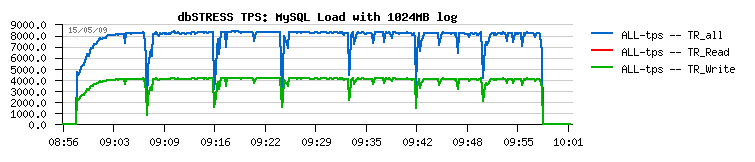
NOTE : you don't need to know the workload presented in the graphs, just look on the "tendency" in overall TPS stability (the blue line over time ;-))
During the same epoch, Yasufumi (who was working at Percona at that time) implemented "Adaptive Checkpoint", which was supposing to fix such kind of issues. But, unfortunately, it was not so, and the same problem was present on Percona XtraDB as well..
The real source of the problem with this stalls was hidden within Master Thread which was at that times also doing Purge work as well. And only once Purge Thread was introduced, we finally got rid of observed stalls and obtained the following :
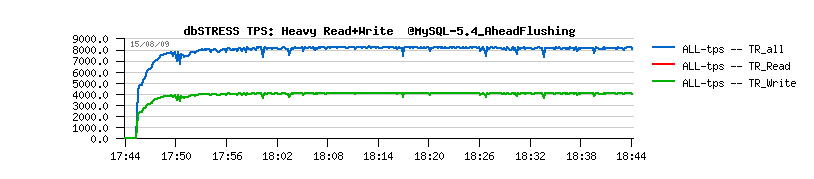
Then, MySQL 5.6 came with a true "Adaptive Flushing" and additional tuning with "io capacity" and "io capacity max". After what we discovered that Master Thread could no more follow alone all flushing activity, and since MySQL 5.7 release we introduced MT Page Cleaners. After what this huge PITA in InnoDB history was gone..
So, you probably can better understand "why" I was surprised to see deep TPS "waves" in TPCC results on MySQL 8.0 reported by Vadim..
For those who have time for longer reads / or need more details, there are few more :
- http://dimitrik.free.fr/db_STRESS_MySQL_InnoDB_dirty_pages_and_log_size_impact_May2009.html
- http://dimitrik.free.fr/db_STRESS_MySQL_540_Purge_Lag_and_Ahead_Flushing_Jun2009.html
- http://dimitrik.free.fr/blog/archives/2009/07/mysql-performance-why-ahead-flushing-for-innodb.html
- http://dimitrik.free.fr/blog/archives/2009/08/mysql-performance-final-fix-for-ahead-flushing-purge-lag.html
- http://dimitrik.free.fr/blog/archives/2010/04/mysql-performance-why-purge-thread-in-innodb.html
- http://dimitrik.free.fr/blog/archives/2012/10/mysql-performance-innodb-buffer-pool-instances-in-56.html
- http://dimitrik.free.fr/blog/archives/2013/01/mysql-performance-innodb-heavy-io-rw-workloads-limits-in-56.html
Reproducing The Test Workload
To understand what is going odd, the first step is to reproduce the reported workload (and preferable within the same or similar conditions).
So, first of all MySQL config settings :
[mysqld]

# general
ssl=0
skip_log_bin=1
skip-character-set-client-handshake
default_authentication_plugin=mysql_native_password

table_open_cache=200000
table_open_cache_instances=64
back_log=3500
max_connections=4000
join_buffer_size=256K
sort_buffer_size=256K

# files
innodb_file_per_table
innodb_log_file_size=10G
innodb_log_files_in_group=2
innodb_open_files=4000

# buffers
innodb_buffer_pool_size=140G
innodb_buffer_pool_instances=8
innodb_page_cleaners=8
innodb_log_buffer_size=64M
default_storage_engine=InnoDB
innodb_flush_log_at_trx_commit=1
innodb_doublewrite=1
innodb_flush_method=O_DIRECT
innodb_file_per_table=1
innodb_io_capacity=2000
innodb_io_capacity_max=4000
innodb_flush_neighbors=0
innodb_monitor_enable='%'
I've reused it exactly the same from Vadim, except with few changes :
- I prefer to have PFS enabled (MySQL 8.0 default)
- and all InnoDB METRICS enabled as well (not enabled by default)
After what I've tried to replay the same TPCC 10x100W test workload on my 24cores-HT server (2S) I'm usually using for various testing. This server doesn't have SATA SSD, but and old NVMe drive which I expected to be enough old to be "comparable" to what Vadim was using. And the first probe test showed what I was afraid :
- Checkpoint Age reached its max
- no space in REDO
- InnoDB is doing a constant sync flushing (aka "furious flushing")
- while time spent in flushing by Cleaner Threads was too low..
- so, it was clear that IO capacity was just not configured high enough
- and increasing it to higher value got a rid of "waves"
However, the "waves" I've observed with this old NVMe were still much smaller than what is reported by Vadim.. -- e.g. even with "non-optimal" IO capacity settings these "waves" were quickly gone after few iterations. So, my old NVMe was looking too good here..
So, I've started to look for something yet more older, and finally found as server with really old SATA SSD -- and my old memories came back to remind me how shitty this SSD is ;-))
- the main issue I'd see in a total instability of IO latency on this drive..
- fortunately this is not the case for all SATA SSD (and I'll not say anything here about the vendor ;-))
- for ex. on another server its SATA SSD is doing better than mentioned before "old NVMe"
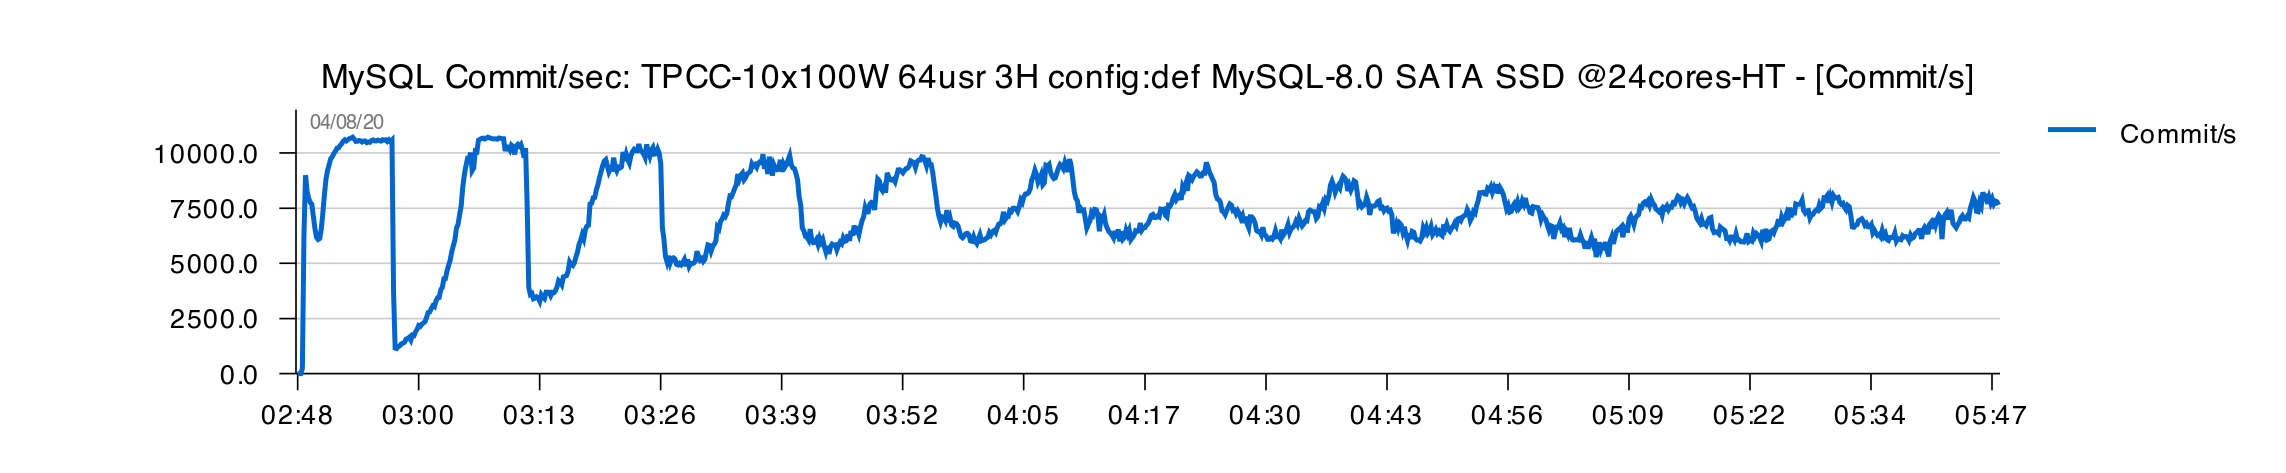
All in all, with this "horrible" SATA SSD I could finally reproduce the case observed by Vadim :
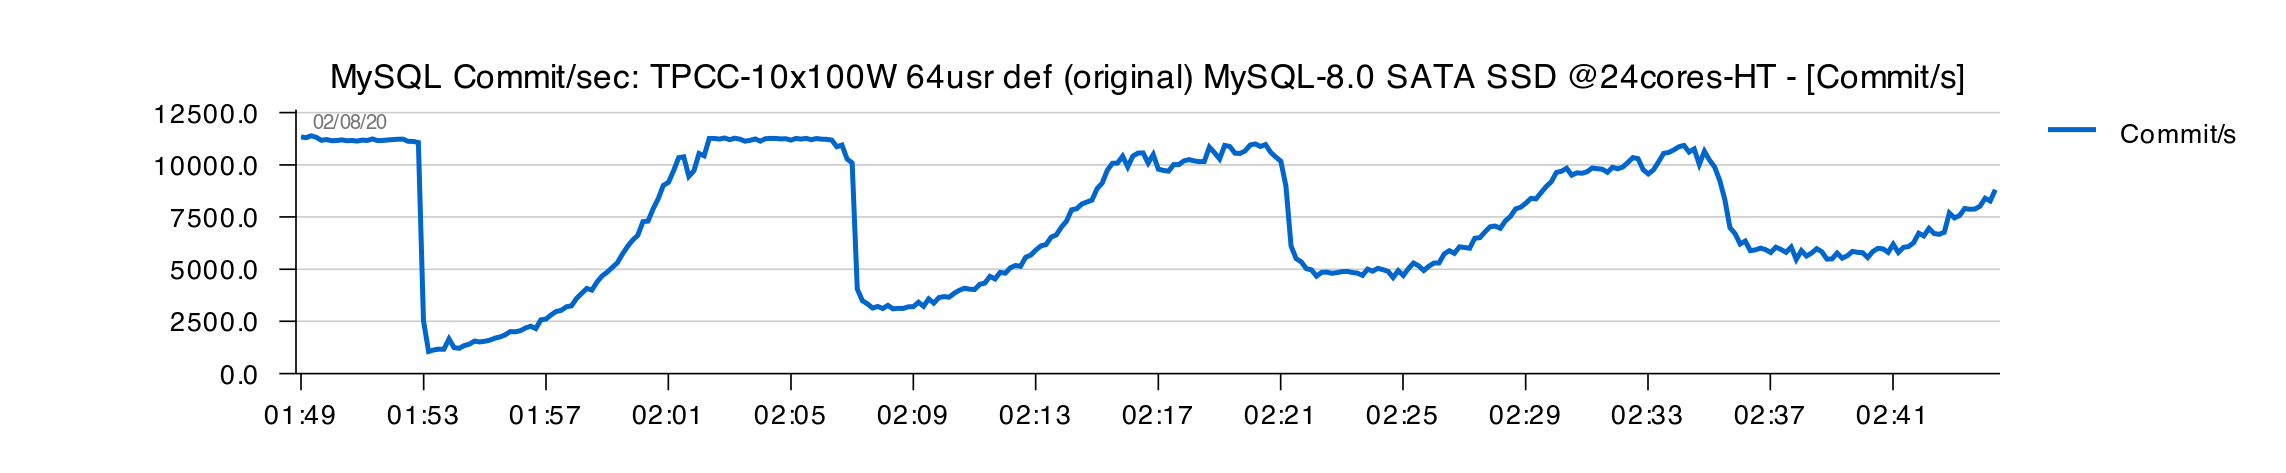
- my initial tests are executed for 1H only to save time
- I've used 64 concurrent users on every test
- and, indeed, nice TPS "waves" here..
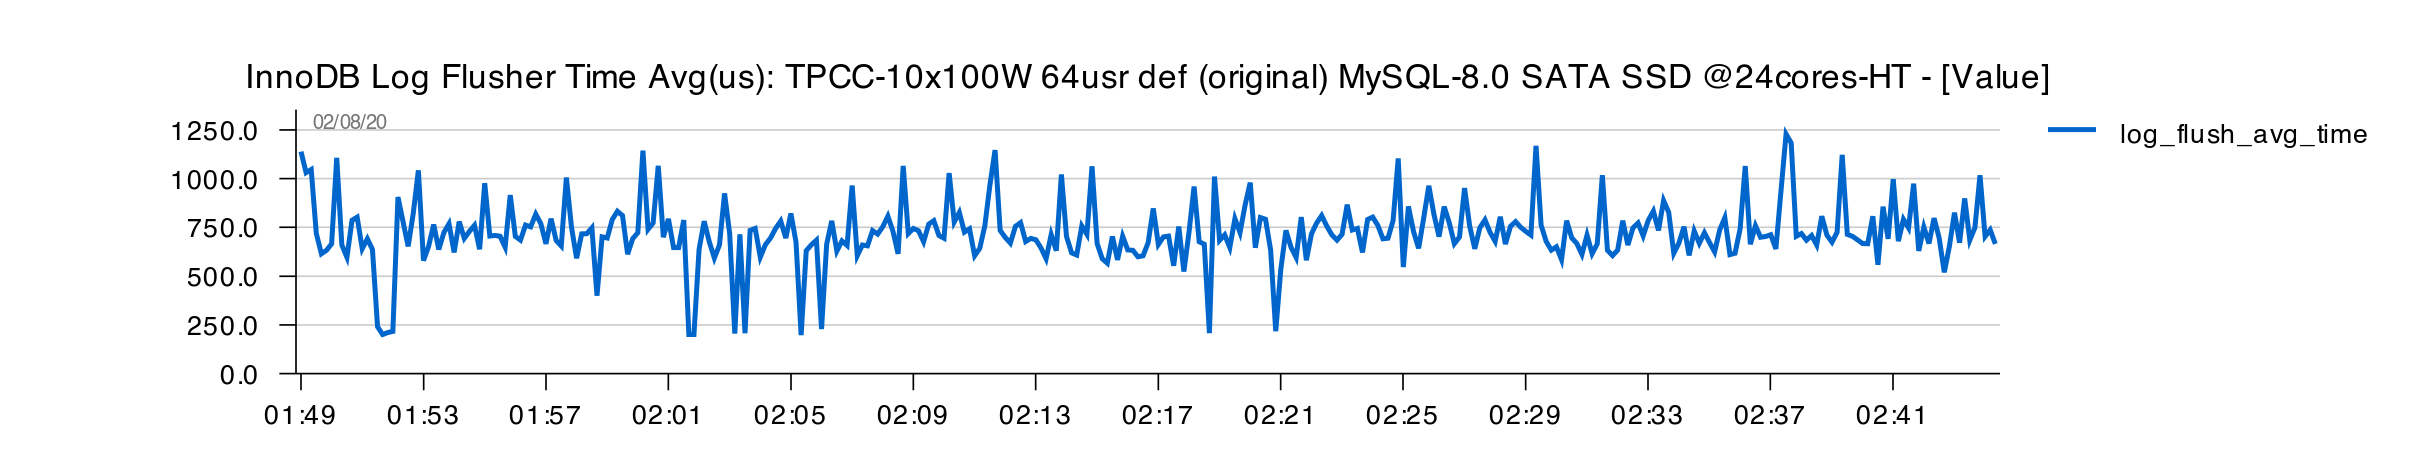
However, flushing time still remains under 1sec execution time :

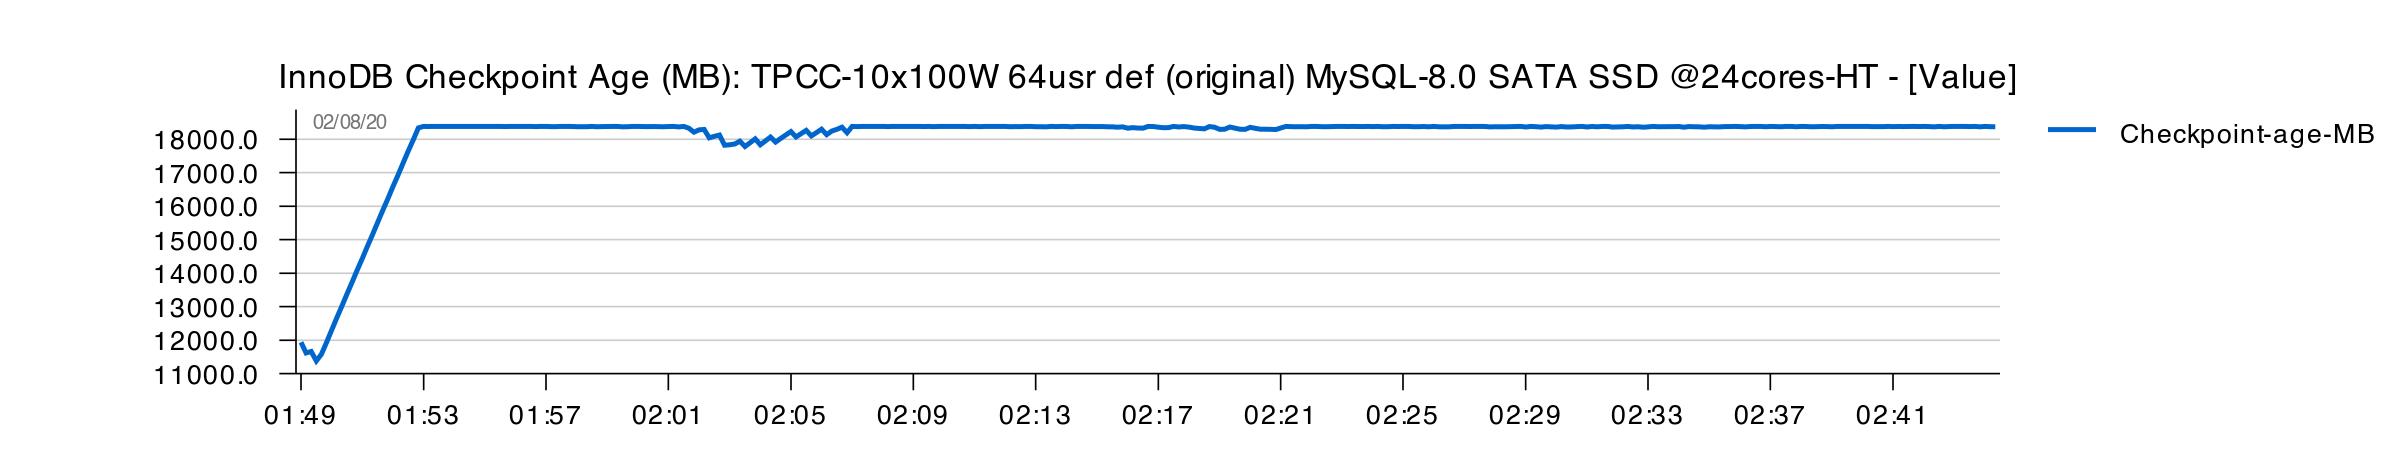
Checkpoint Age already reached its max level and stays on it :
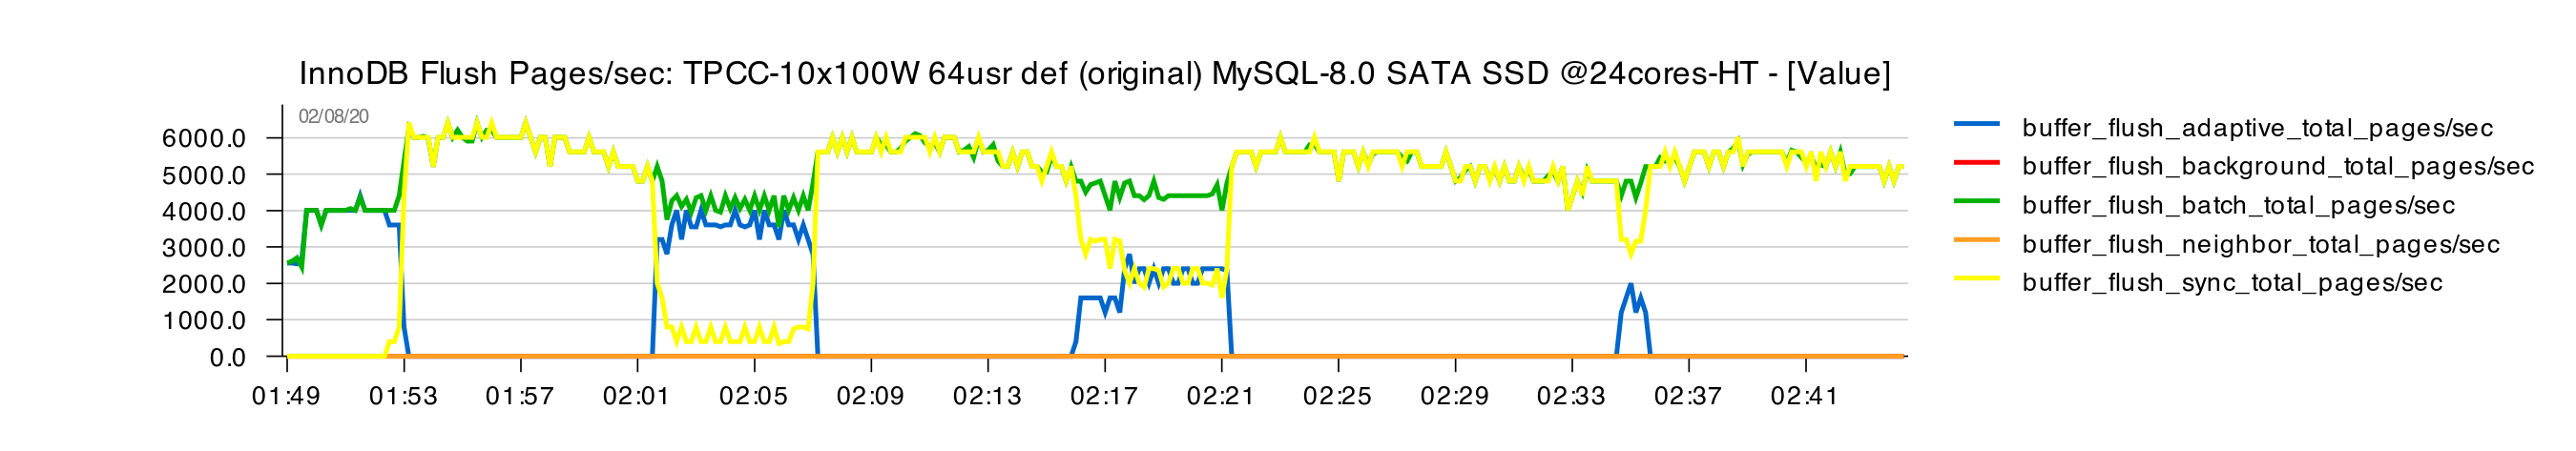
And every time when there is no more space in REDO, we're hitting sync (furious) flushing :
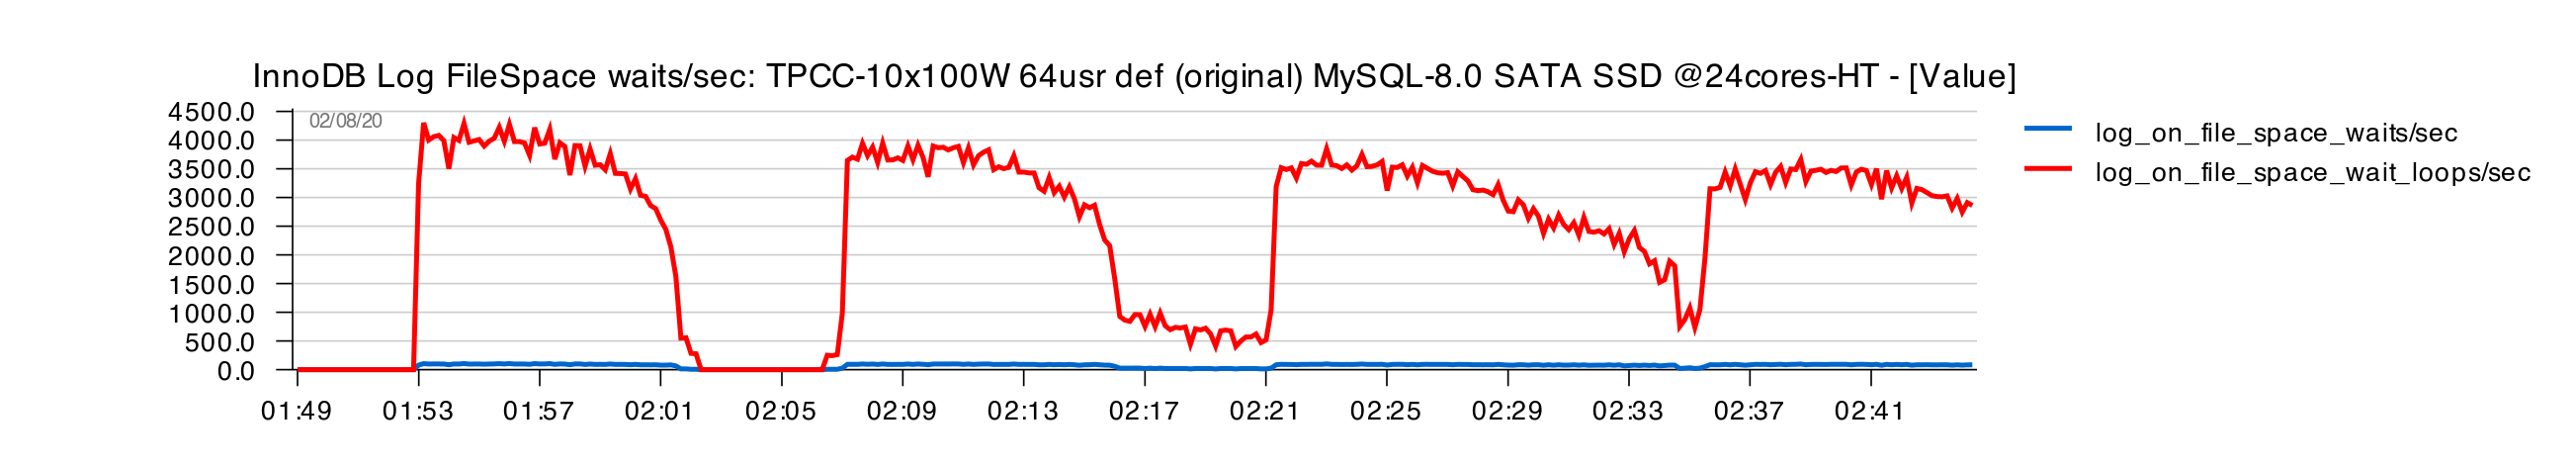
Confirmed by REDO stats reporting space waits :
REDO fsync stats are under 1ms, not much stable, but not related to stalls either :
So far, what is going here ?
- from the first impression it looks like used 4K value for IO capacity max was set too low..
- however, if you'll look on the sync flushing => you'll see it could only reach 6K pages/s flushed as max possible rate !
- which means increasing IO capacity settings in such conditions will not help..
- all is rather pointing on :
- total SSD saturation
- but also possible unexpectedly increased time of page flush
- and the only thing which can increase page flush time in in-memory workload is DBLWR !
for ref. : DBLWR -- InnoDB DoubleWrite feature to protect from partially written pages (each page is written twice, first to DBLWR space, then to its datafile), note that these writes are going sequentially and in the best case we double time of every page write (but it can easily be more as well)..
How do you troubleshoot DBLWR ?
- first of all just try to replay the same test workload with DBLWR switched off
- this at least will give you idea about overall TPS and IO impact, but also about changes in flushing times
- after what you enable DBLWR again and try to play with DBLWR tuning
- the main config options for DBLWR in MySQL 8.0 are :
innodb_doublewrite_files = Ninnodb_doublewrite_pages = M
Unfortunately it's hard to predict "universal" config which would be good for any kind of storage.. The default config is generally doing well on fast enough storage, but I have big doubts about my SATA SSD here ;-))
To make it short, after few probes, I've found that 2 files and 64 pages for DBLWR config will be less or more "good enough" for this SATA SSD.
"Tuned-1" Config
In parallel with DBLWR tuning I've also observed the following things on this test workload :
- AHI (Adaptive Hash Index) was creating a bottleneck here, so switching it OFF (generally AHI helps SELECT queries, but quickly becomes a bottleneck as soon as you have writes)
- Change Buffer did not give any help here and its buffer was staying zero all the time, but it was reported in contentions, so switched this one also OFF
- and finally better DBLWR config allowed me to increase IO capacity settings
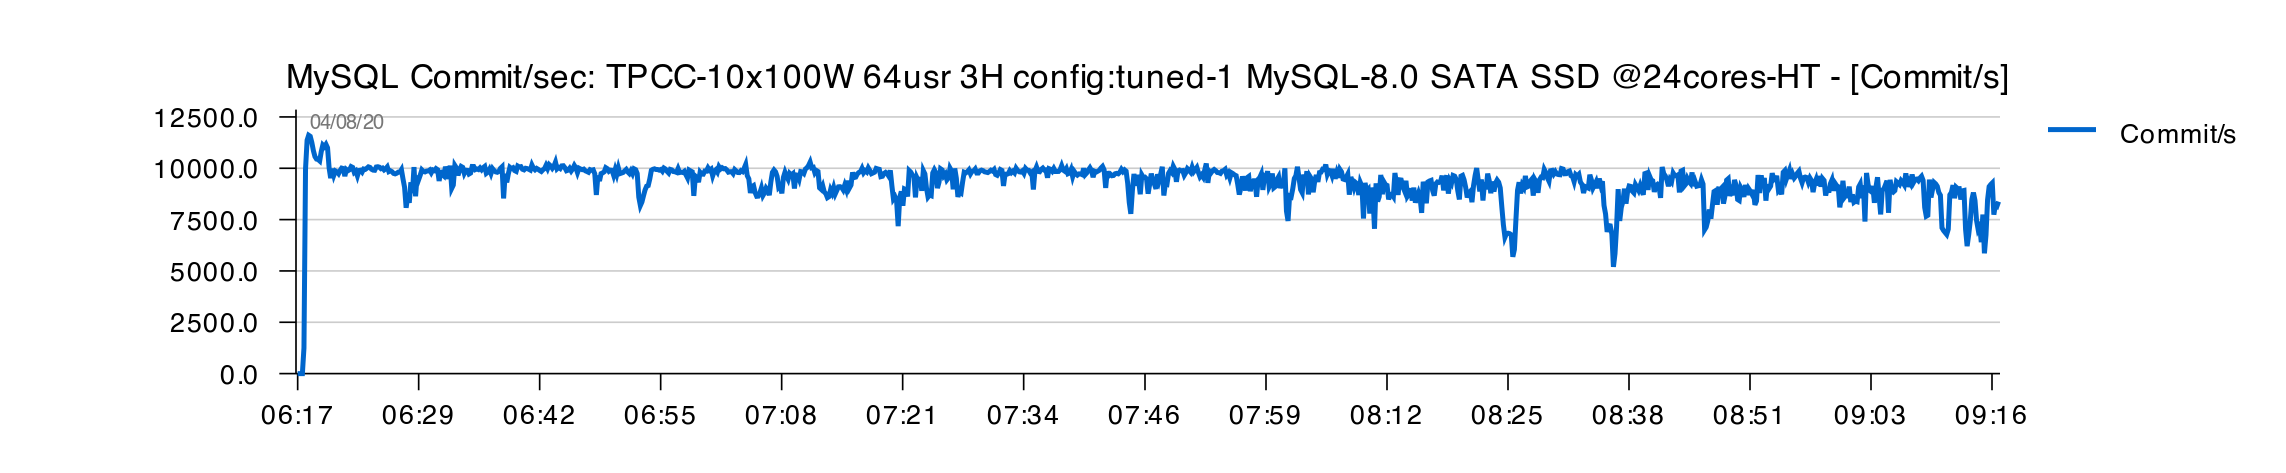
So far, the "Tuned-1" config for the next test got these additional changes in my.conf :
innodb_doublewrite_files = 2
innodb_doublewrite_pages = 64
innodb_adaptive_hash_index = 0
innodb_change_buffering = none
innodb_io_capacity = 7000
innodb_io_capacity_max = 7000
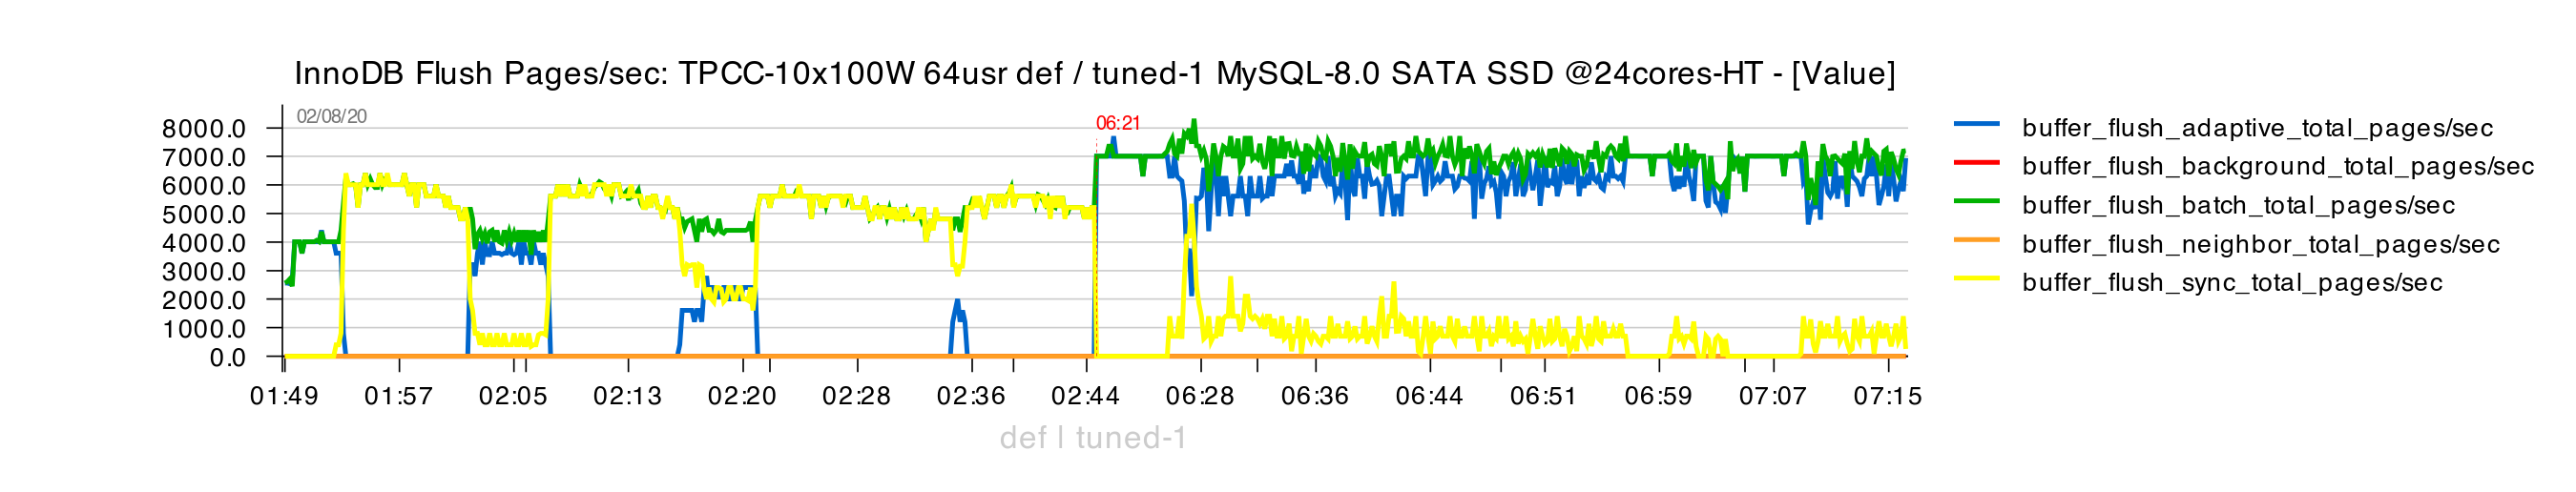
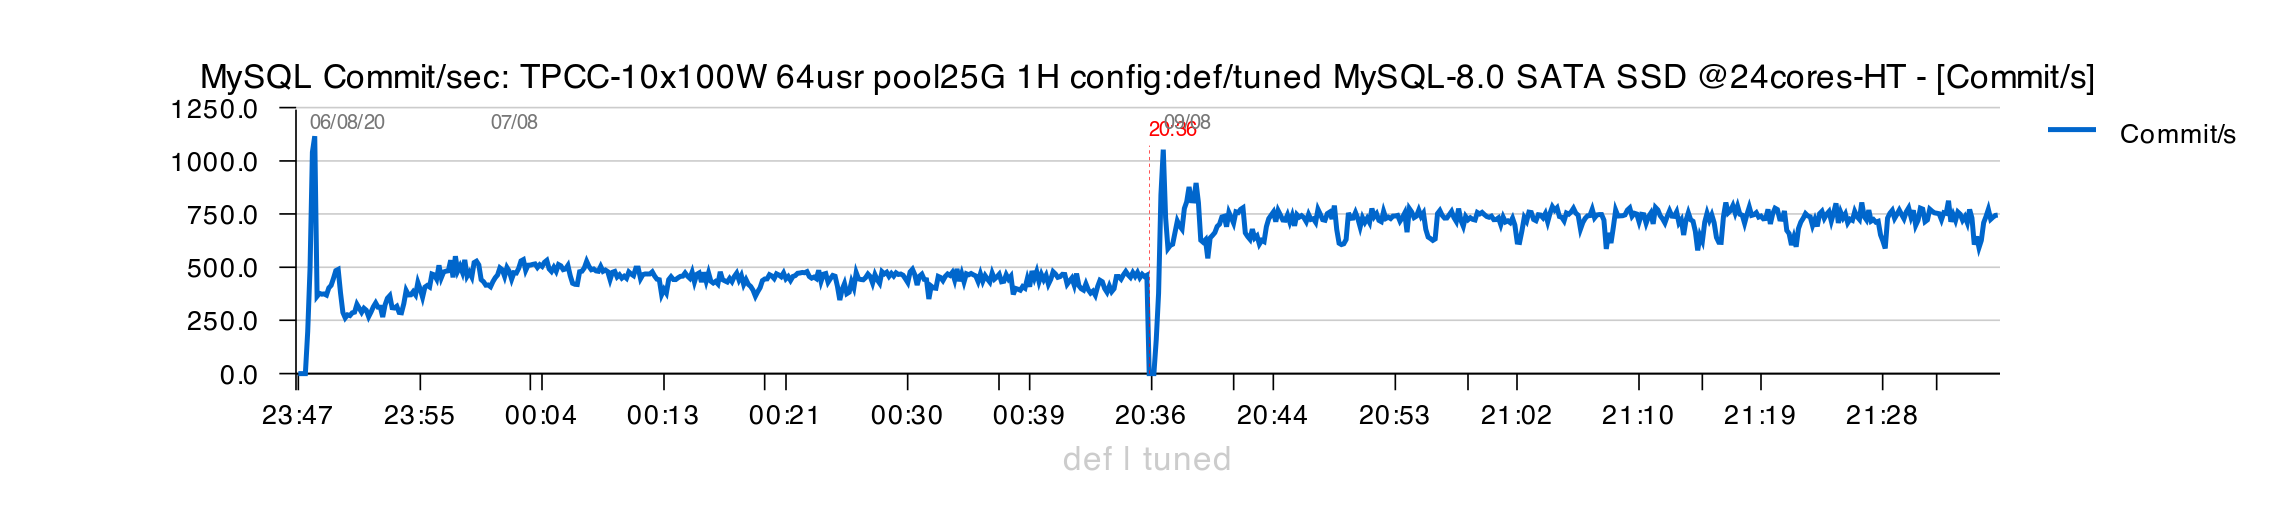
After what I've got the following TPS :
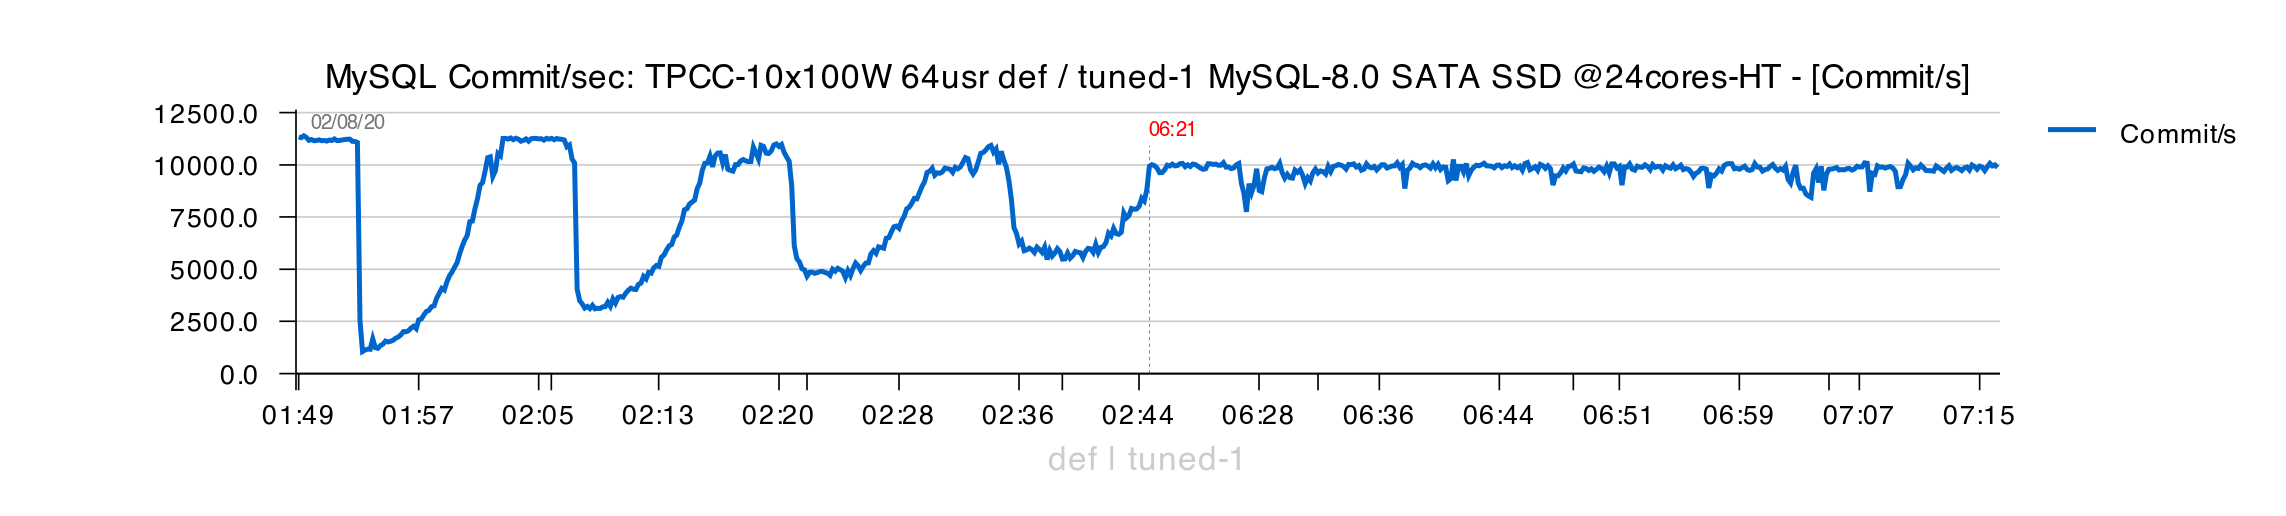
- on the left side you can see TPS obtained with the "original" (def) config
- and on the right side TPS with "tuned-1"
- and as you can see, the initially observed "waves" are gone now.. ;-))
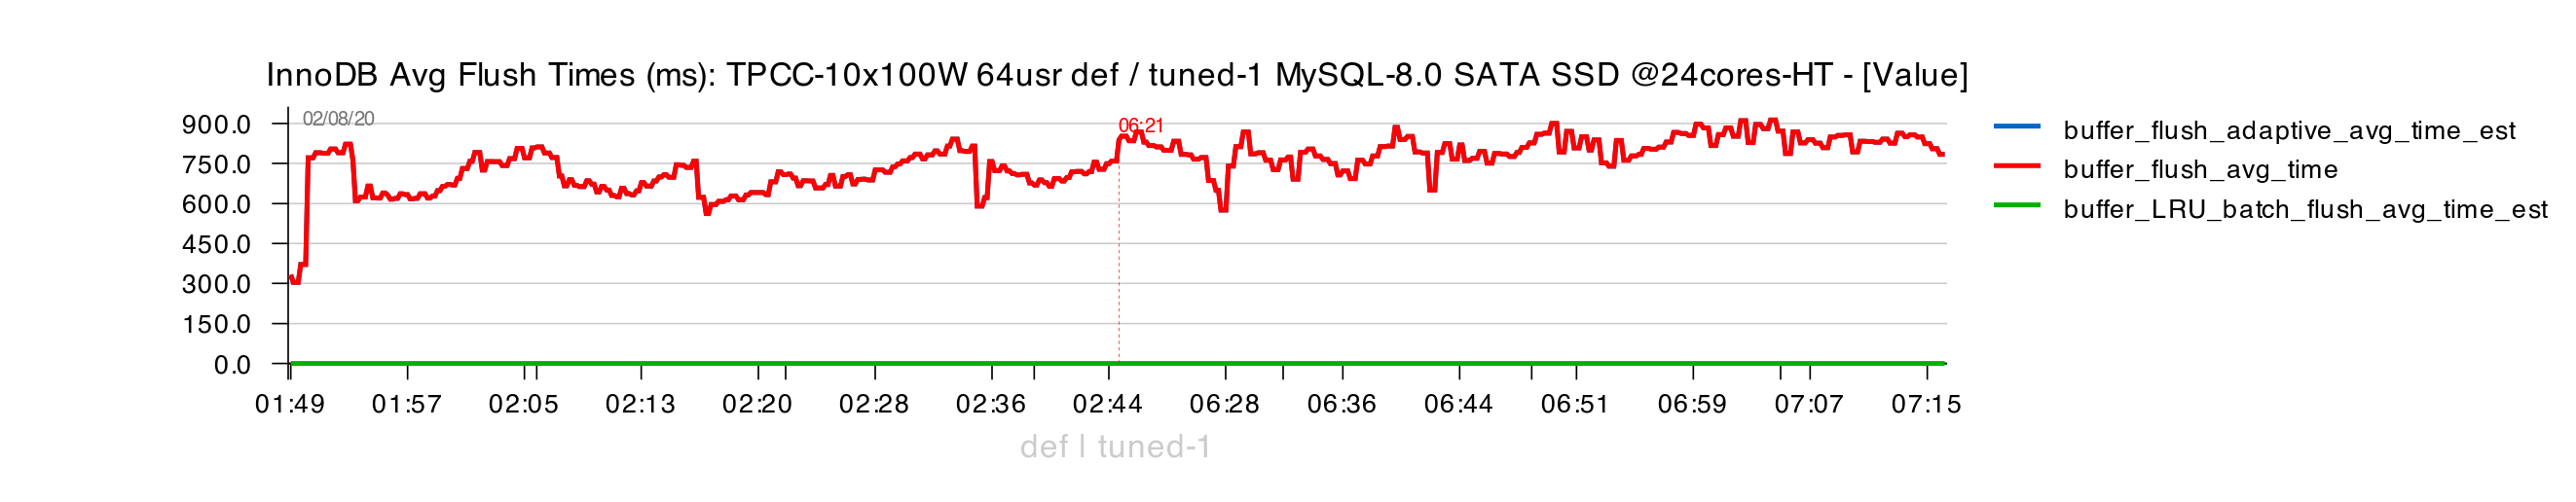
The flushing time still stays under 1sec :
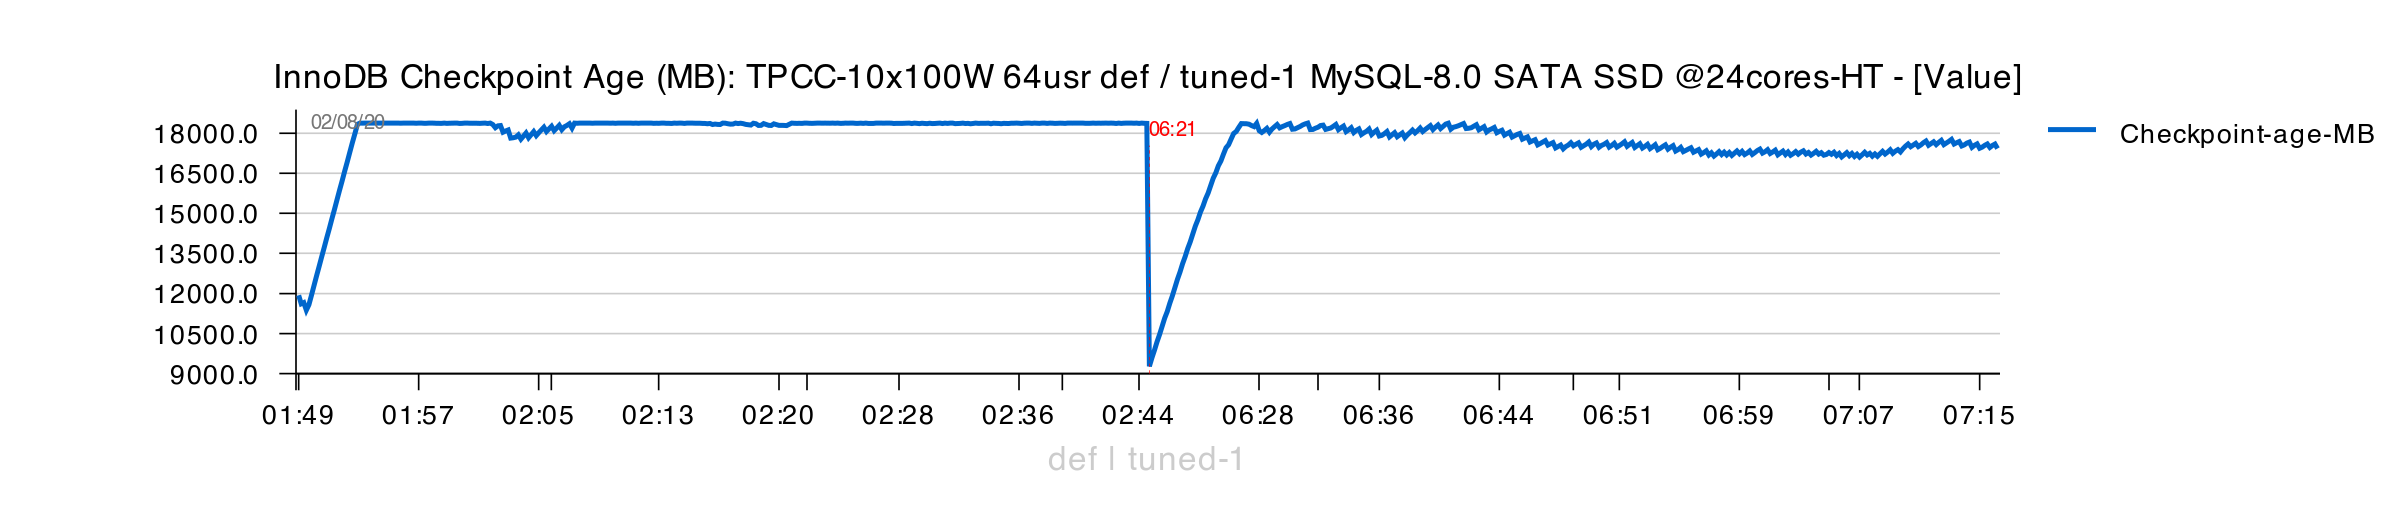
However, Checkpoint Age is rising very close to its max limit :
And you can see that sync flushing is still present :
But as we could flush more now than before, the waits on REDO space are largely lowered :
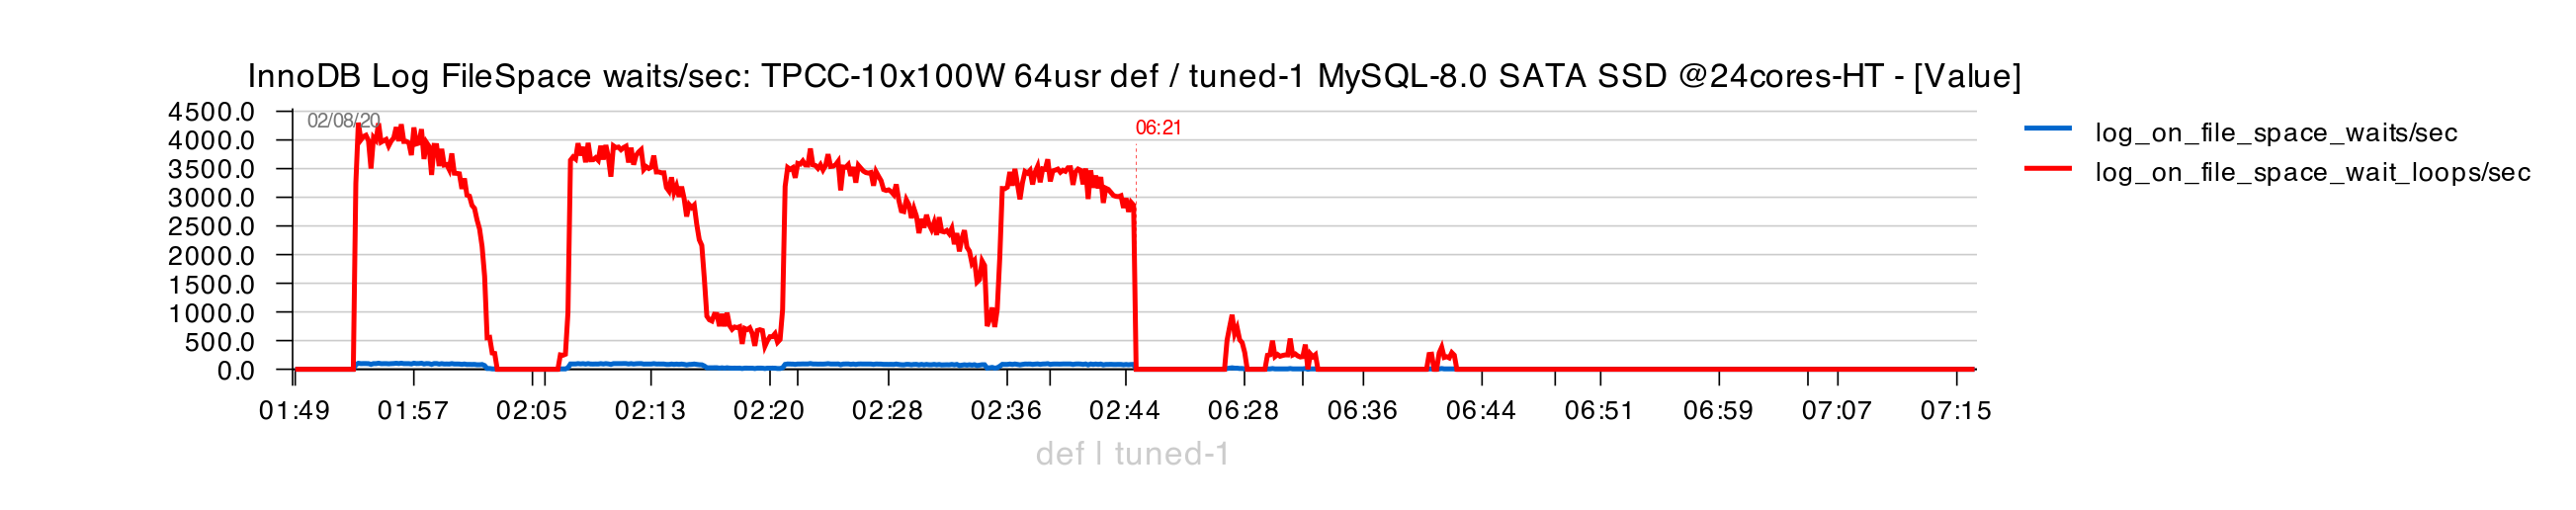
From the other side, as SSD is already not far from its limits, higher traffic on page writes is also directly impacting REDO writes / fsyncs, increasing REDO latency :
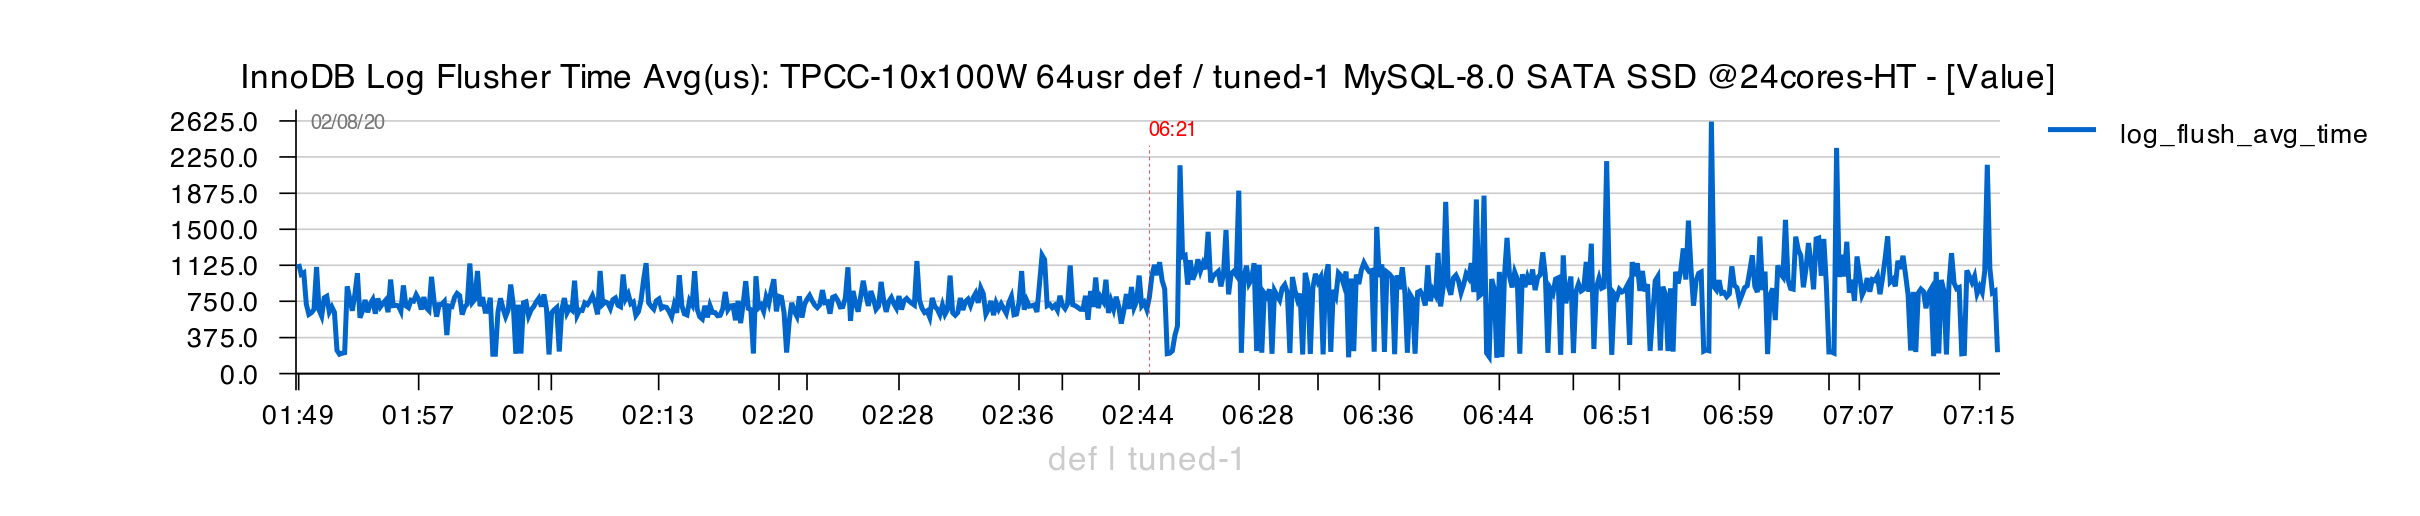
So, all in all, with "Tuned-1" config we reached here a balance between DATA / REDO writes, and this SATA SSD drive capacities.
Tuned-2 Config
What if we increase IO capacity little bit more, will it help to lower Checkpoint Age and still keep TPS on the same level, or will rather have an opposite effect ? -- only real test will give you the answer (c) ;-))
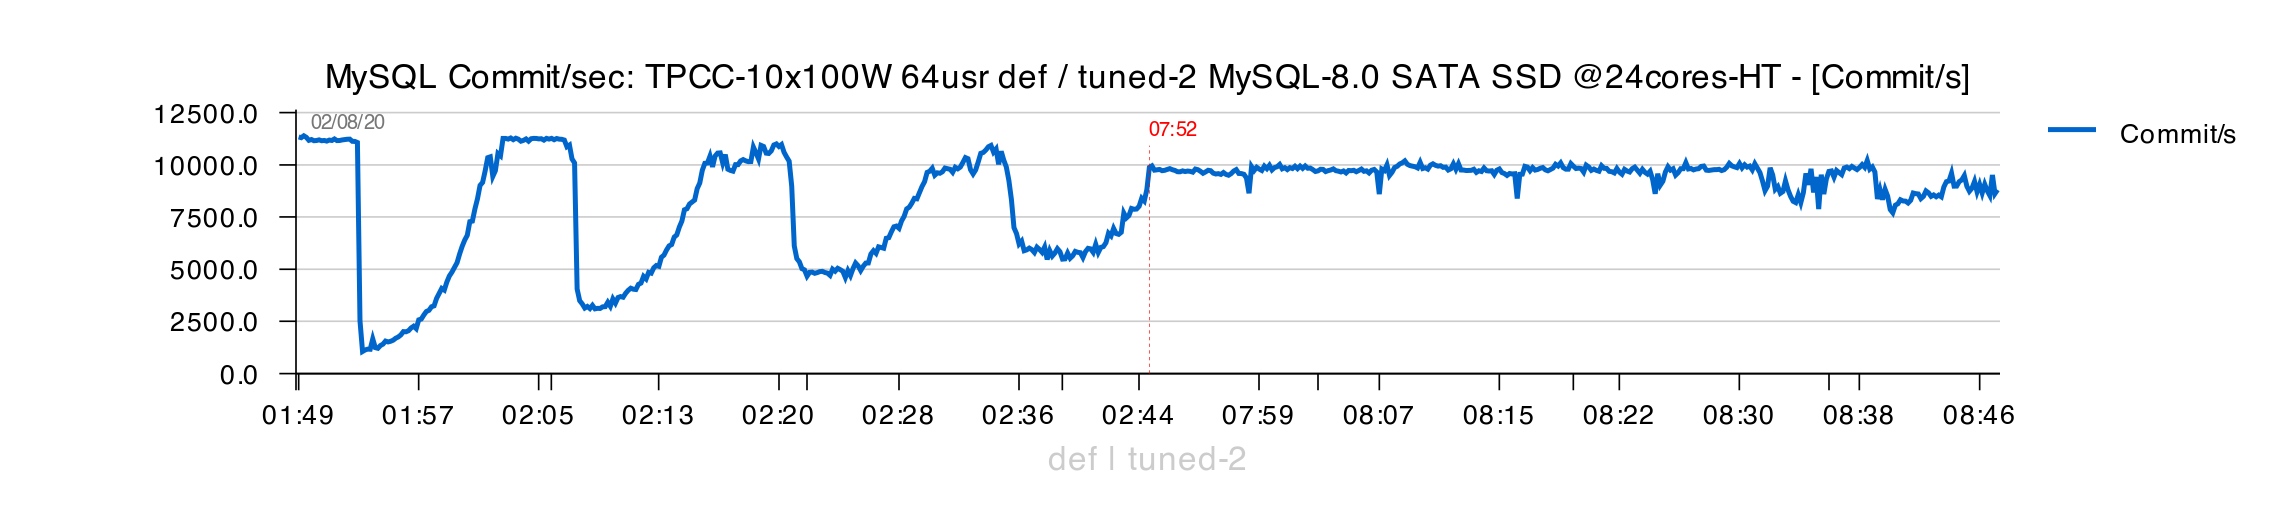
So, the "Tuned-2" config is the same as "Tuned-1", but :
innodb_io_capacity = 8000
innodb_io_capacity_max = 8000
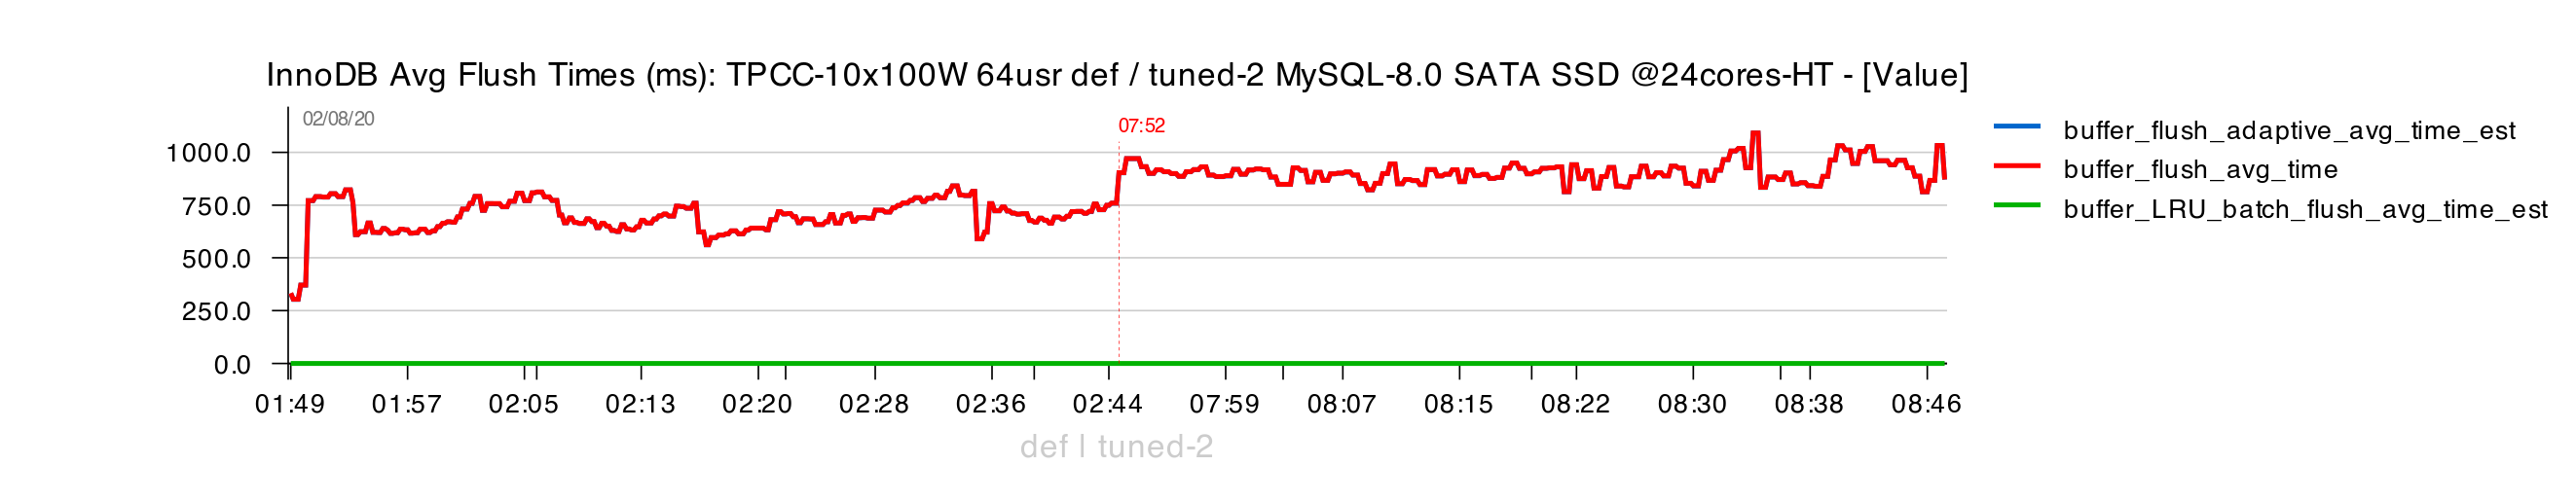
Still much more stable TPS comparing to "original" :
However, flushing times are starting to reach 1sec in execution time :
Checkpoint Age remains lower during mostly 1H, but going up again at the end of the test :
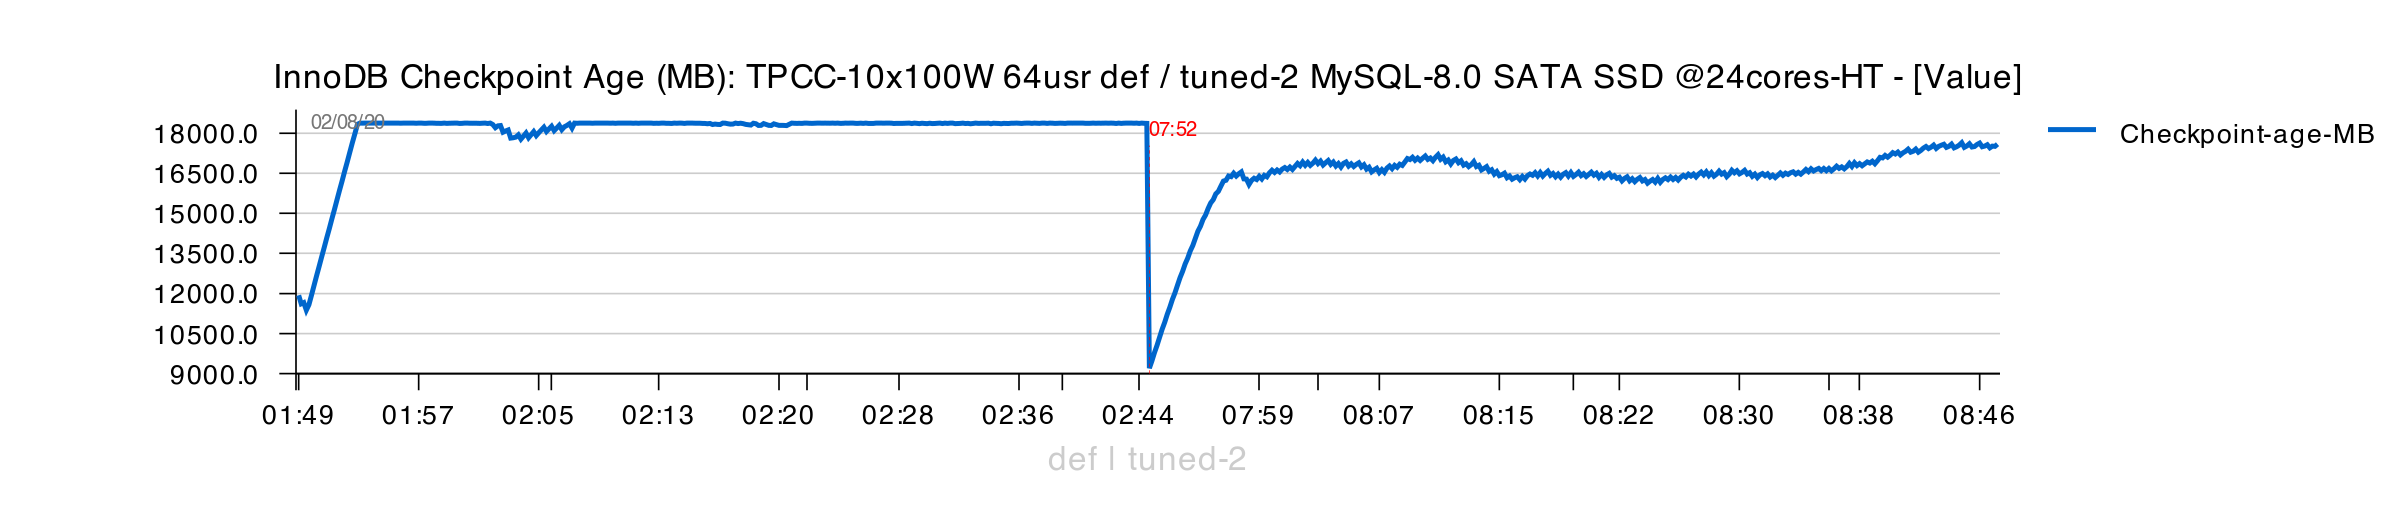
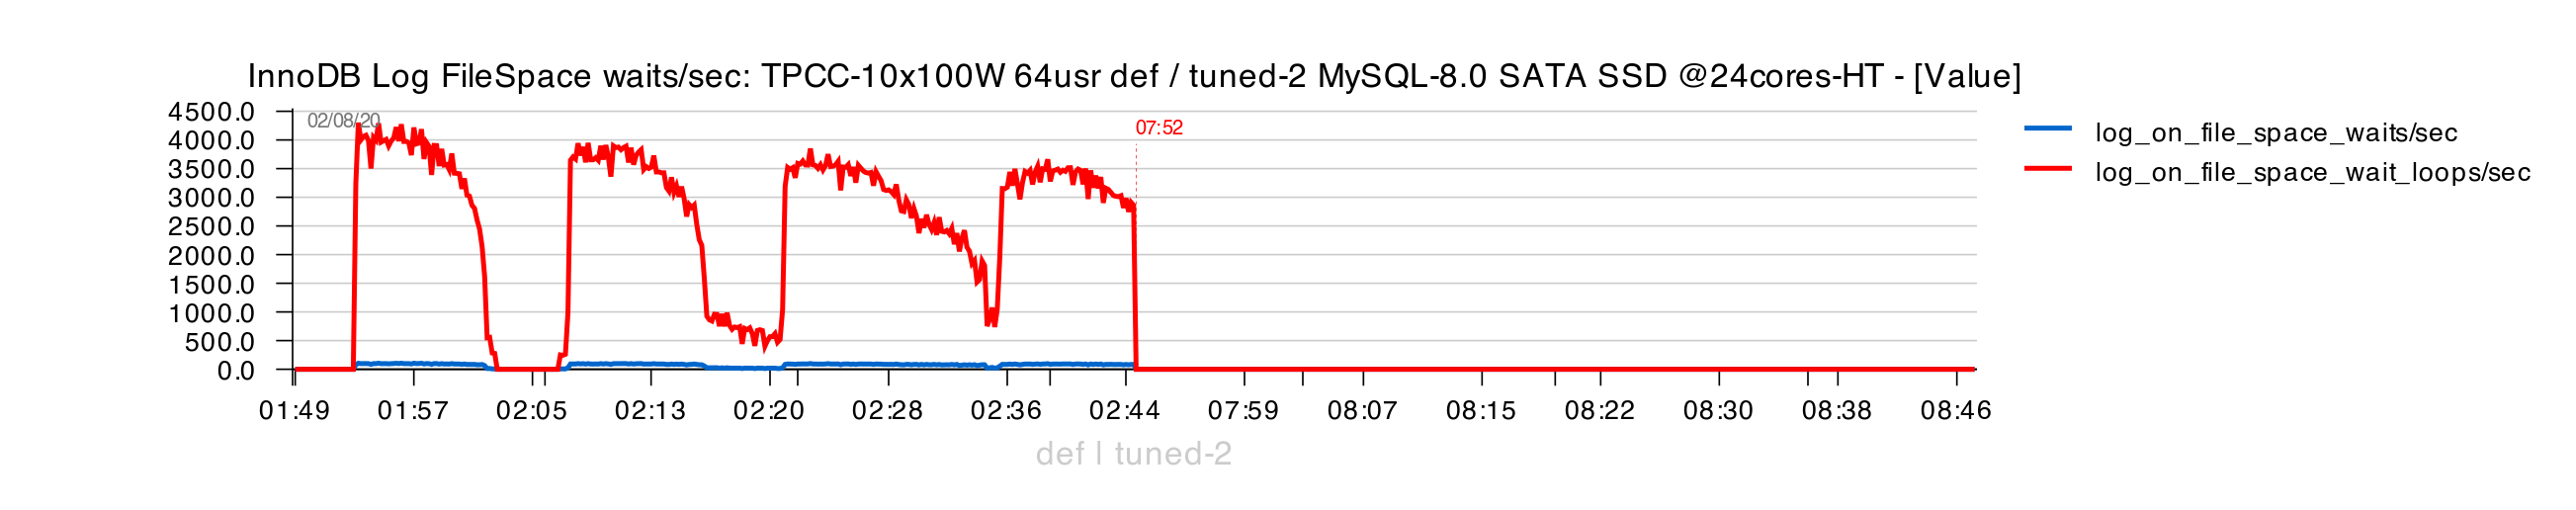
No sync flushing at all till mostly the end :

And totally absent REDO space waits :
But higher page write traffic now impacts even more REDO latency :
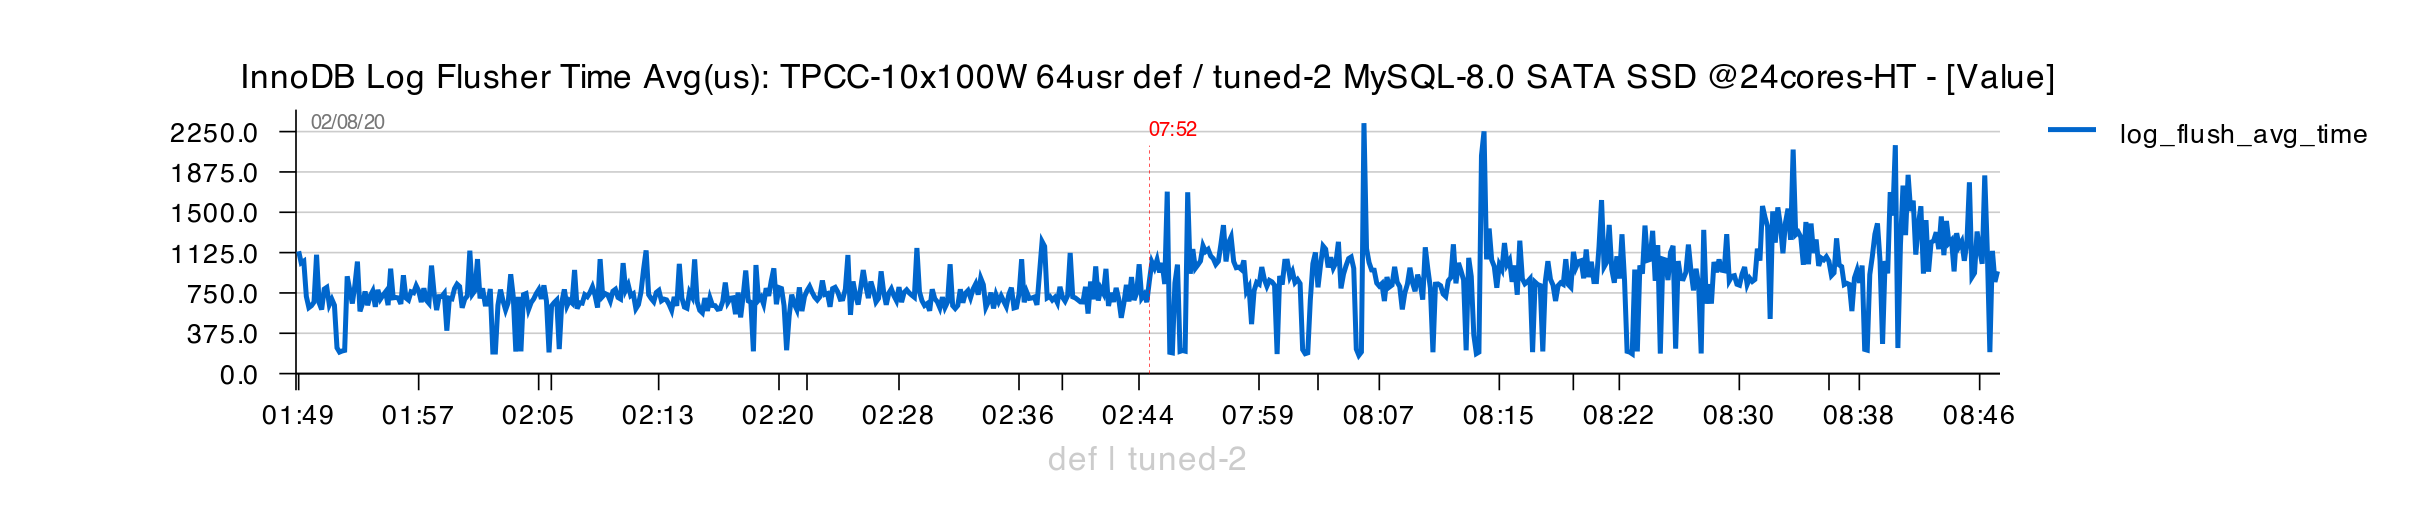
And at the end of 1H of test execution we're seeing TPS decreasing.. -- and there few other reasons are also coming into the game :
- you need to keep in mind that TPCC workload is constantly increasing database size
- and even very small misbalance in IO activity on this SSD will create troubles (some IO reads for ex.)
- specially as you can see even if we "wish" to flush 8K pages/sec, we're able to flush only 7.5K
Well, personally I'd just suggest to upgrade storage to something better (even Cloud network storages today are able to do better) -- but I understand that sometimes you simply have to use what you have..
3H Test Execution
And now, final "verdict" -- 3H test execution with all 3 configs !
Original
Tuned-1 :
Tuned-2 :
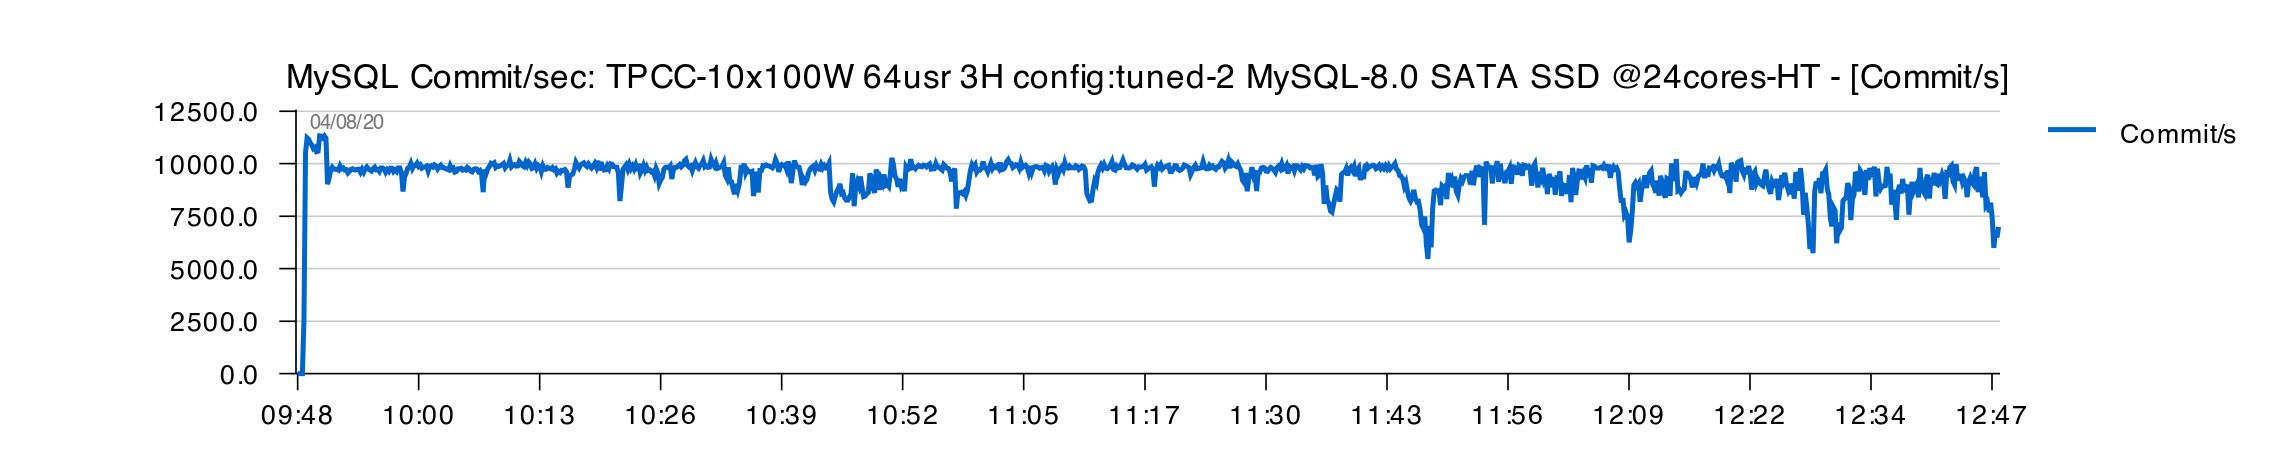
Comments :
- all in all, both "Tuned" configs are doing better here
- however, after 2H of execution, we can observe the first signs of TPS drops..
- why ?
- you need to keep in mind that within 3H of test execution the initial 100GB db size will already reach 200GB in size
- and exactly after 2H of test execution we're starting to meet first important IO reads
- and as SSD IO capacity was already running on its limits, this is directly impacting REDO latency and page flushing..
How the storage will change if this poor SATA SSD will be replaced by more capable NVMe drive ?..
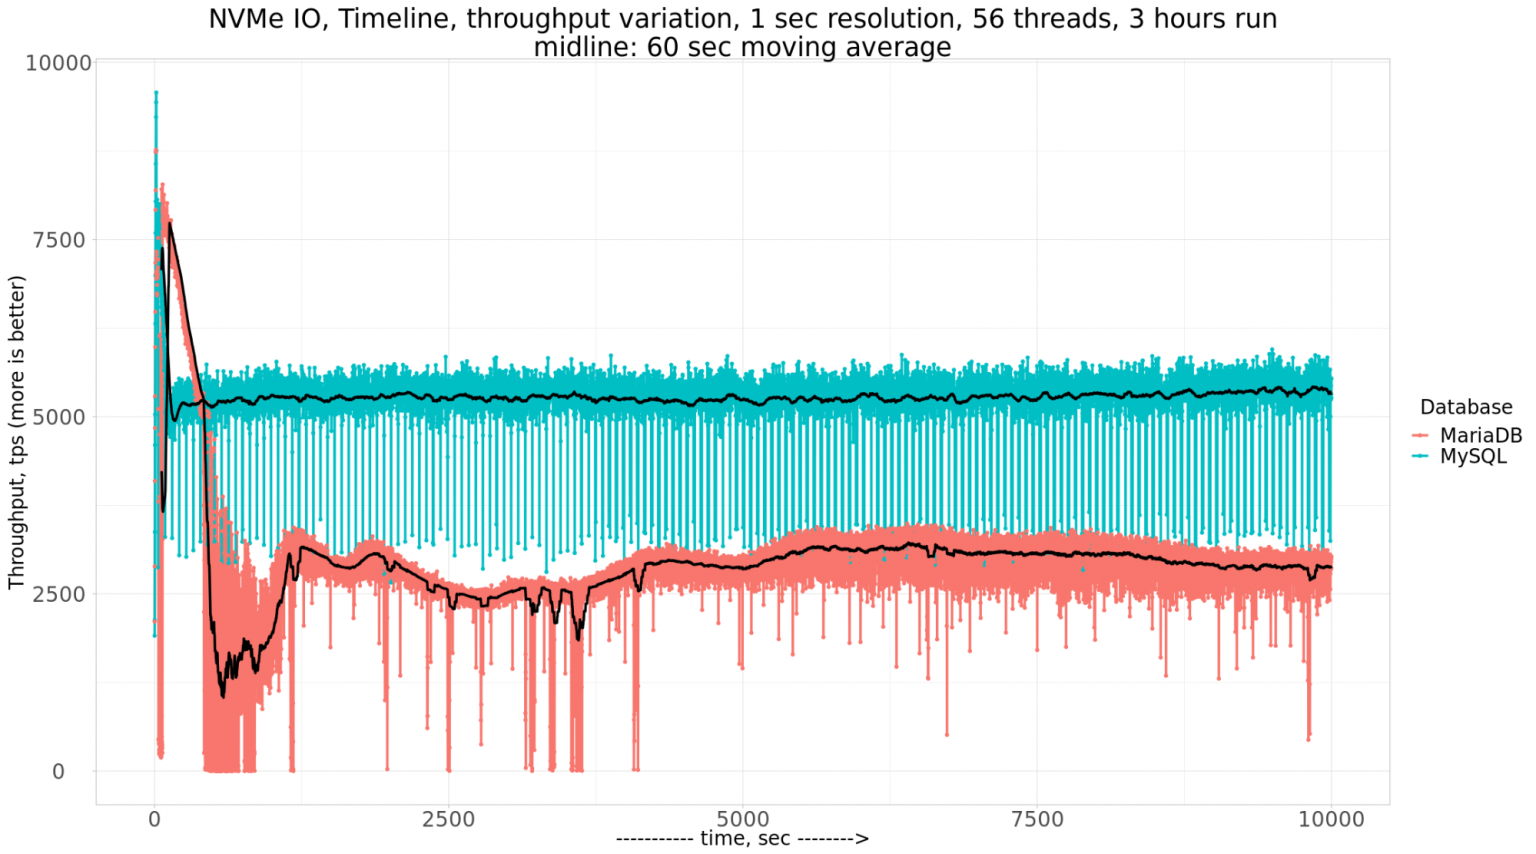
Using NVMe instead of SATA SSD :
For NVMe we can use "Tuned-2" config and just increase IO capacity settings :
innodb_io_capacity = 15000
innodb_io_capacity_max = 15000
And here is the obtained TPS :
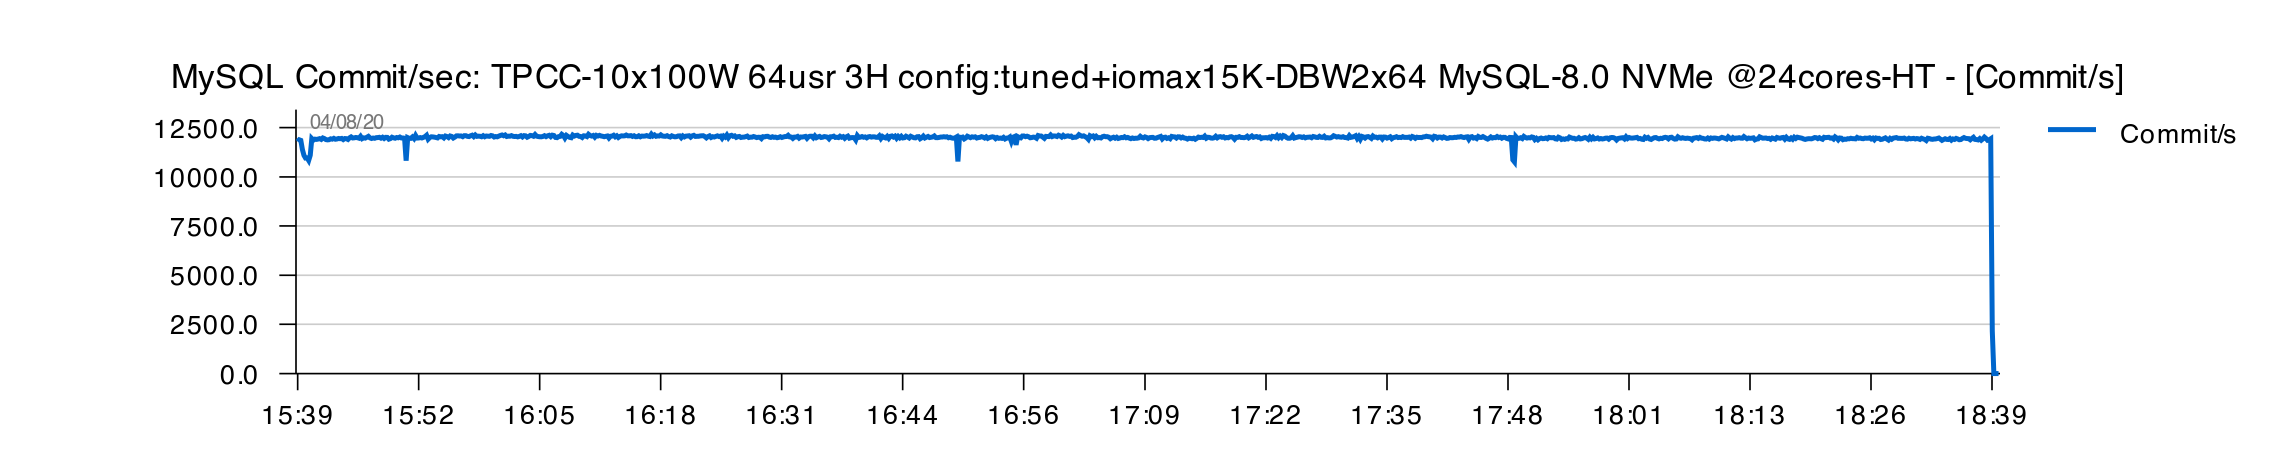
My stats in the above TPS graph are reported for every 10 sec. time interval, but you can see that TPS level is way more stable than reported by Vadim even as avg by 60 sec. :
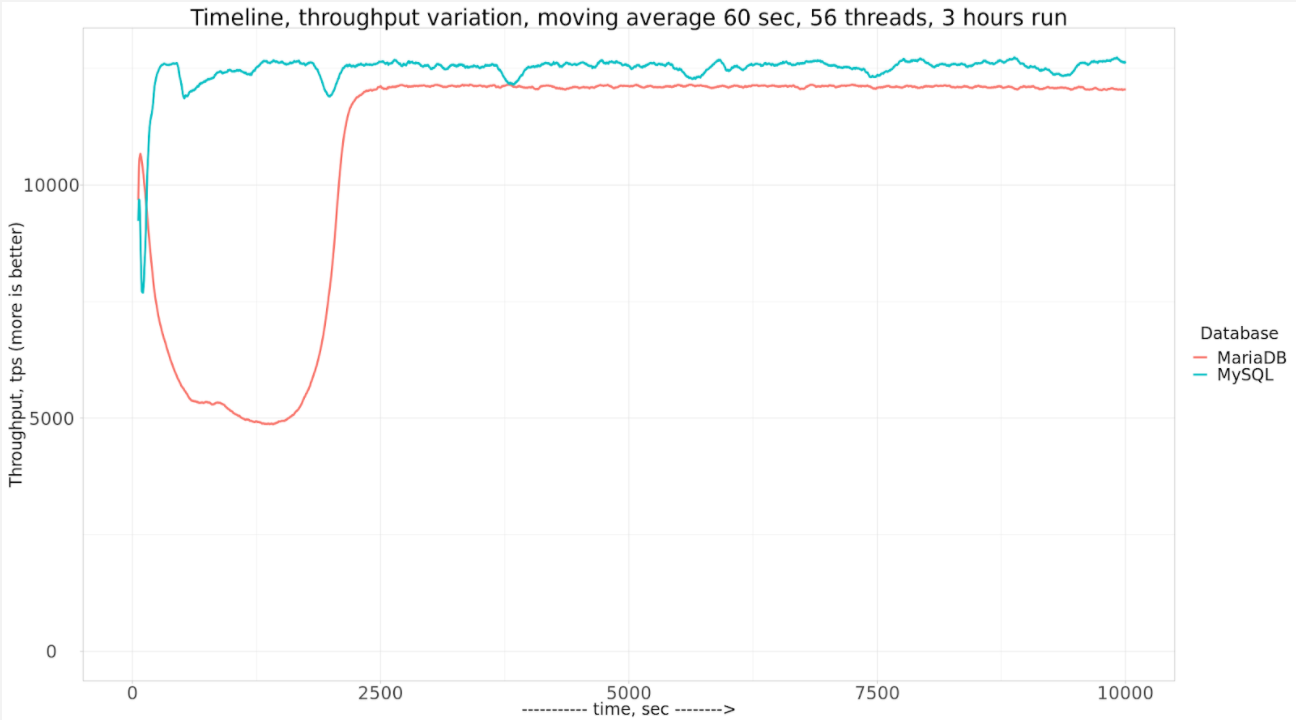
ref : https://www.percona.com/blog/2020/07/30/how-mysql-and-mariadb-perform-on-nvme-storage/
What else ?.. ;-))
NOTE : I see a lot of speculations in advices which IO capacity one should be used and why.. -- just keep in mind a simple thing : it's not "because can" that "you should". If with less IO traffic you can still get same level of performance -- then do it, because I'll directly impact your IO latency.
Moving to IO-Bound Workload
The next series of the tests was about the same TPCC workload, but within "IO-bound" conditions -- by changing BP size from 140GB to 25GB. Which could not fully cache now 100GB data set, so there will be IO reads. And these IO reads will dramatically impact SSD IO capacity, which was already near its limits before..
The main difference on IO-Bound workload comparing to In-Memory :
- IO capacity tuning is not playing much any role (should be not too low, that's all)
- the main IO writes will go now from LRU flushing (and not controlled by anything)
- they are only following the demand of your workload :
- as users will need to read pages, they will need to get a free page first from BP
- as your data are way bigger than your BP, there are high chances there will be no more free pages available
- to provide free pages to users, Page Cleaners will try to "evict" pages from LRU tail and make them "free"
- if any of these pages will be still dirty, it should be flushed first, before to be evicted
- which is creating a "balance dilemma" : if you do too much IO reads, you'll not have capacity to do IO writes, and if your IO writes will stall, this as the result will block your IO writes, and so on..
Tuned Config
After few test probes with "original" config, I've observed the following :
- AHI is still impacting (as expected), switching OFF
- Change Buffer helps ! (even represents some contentions, the gain is bigger than overhead)
- DBLWR tuning helps as well
So, the only additional changes I have are :
innodb_doublewrite_files = 2
innodb_doublewrite_pages = 64
innodb_adaptive_hash_index = 0
1H Test results :
- "original" config on the left, and "tuned" on the right
- the "tuned" is more stable and giving higher TPS
- however, always mind to look not only on final TPS, but also on what is reported from MySQL/InnoDB internals to be sure you're not missing other problems..
3H Test results with "tuned" config :
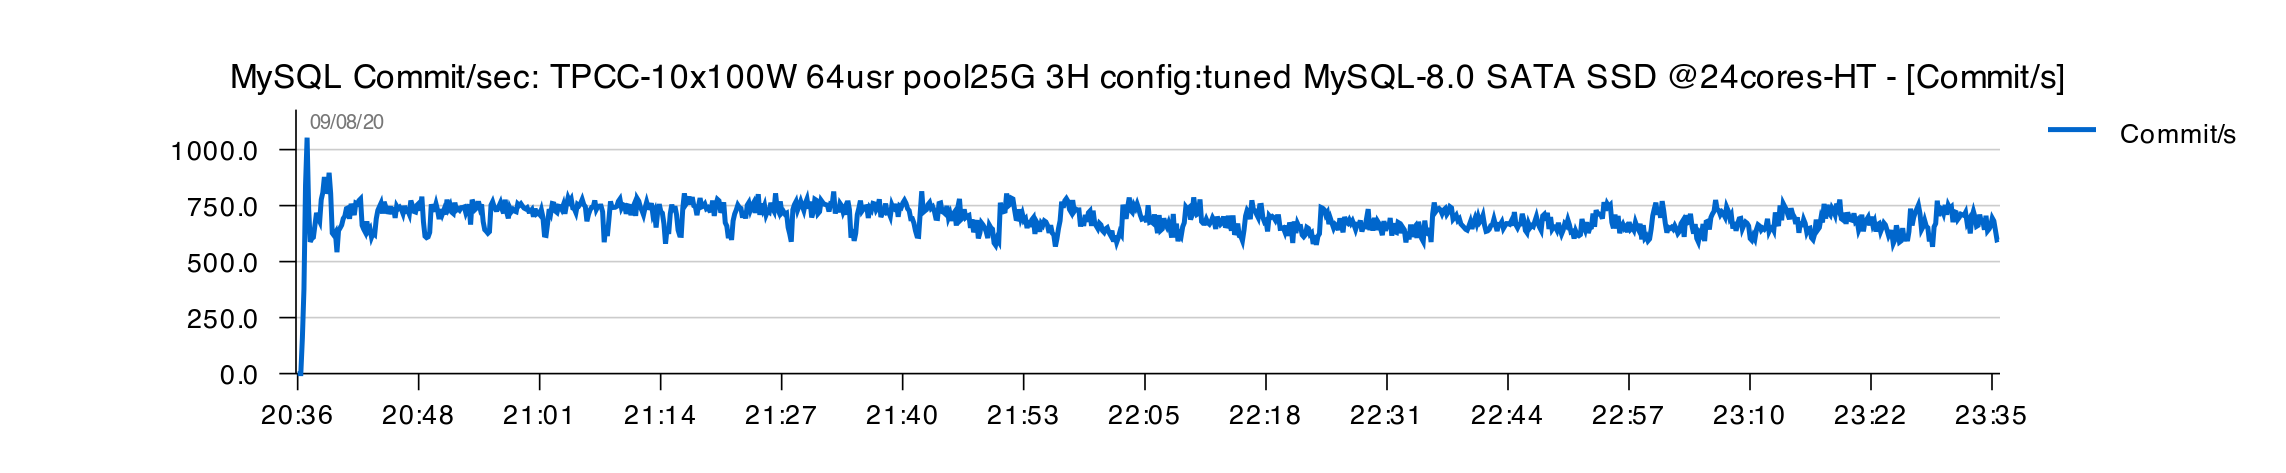
- no big variations over 3H of test time
- however, avg level of TPS seems to decline little after 1H, but not changed much during the rest 2H time execution
And now, let's switch to NVMe to see the difference ?
3H Test results with "tuned" config on NVMe :
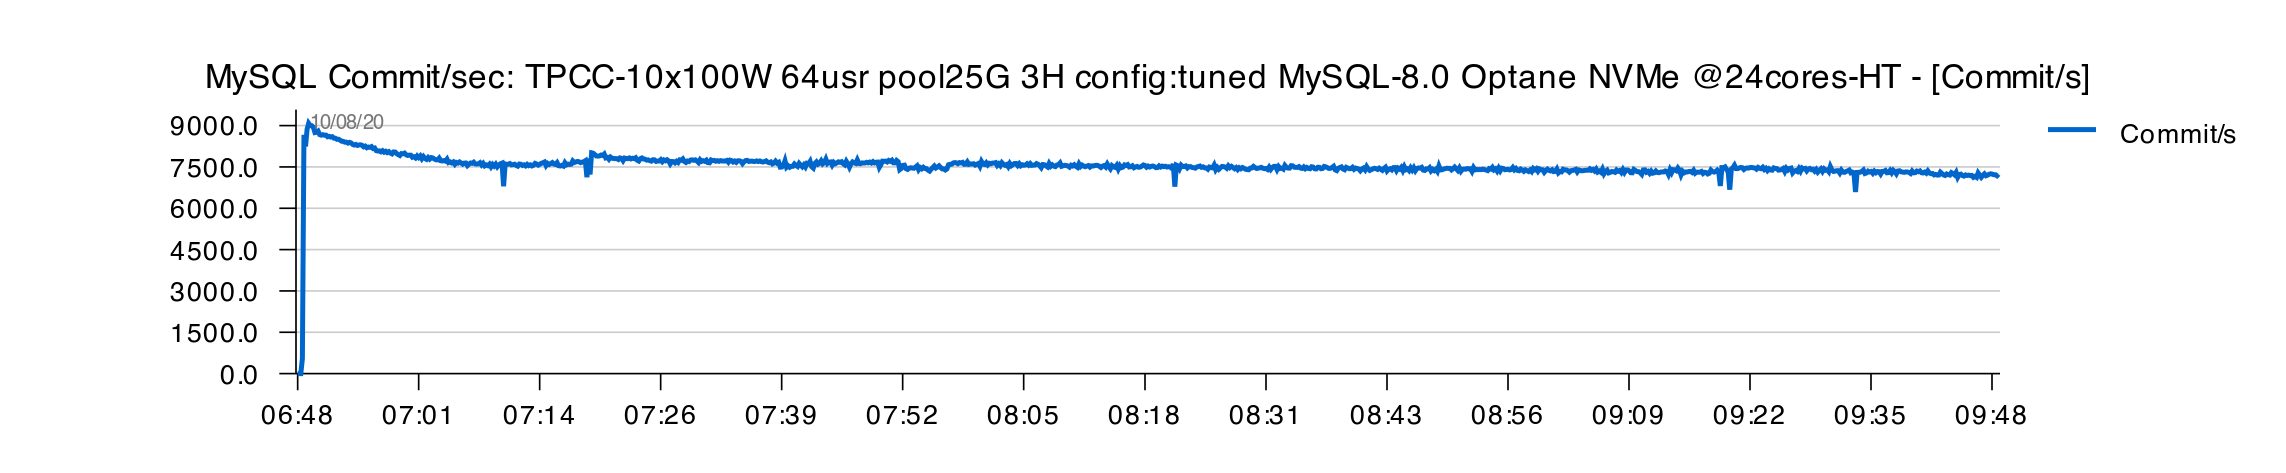
As you can see, x10 times higher TPS over SATA SSD (!!) and still more stable TPS comparing even to 60 sec. avg results from Vadim :
SUMMARY
- even when you're seeing something "strange", try to understand it first..
- don't hesitate to try to tune => practice is the only way to learn !
- default DBLWR config can be good in most cases, but maybe not in yours.. -- mind to check it !
- unfortunately AHI may create more troubles to your workload, rather some help.. -- check !
- same with Change Buffer, think to check it as well !
- go by understanding of how the things are working, rather trying random tricks !
- and, finally, love your DATA ! => use faster storage ;-))
Thank you for using MySQL ! and stay tuned, MySQL 8.0 is "continuous release", yet more is constantly coming ;-))
Rgds, -Dimitri