Created: 2009-04-07
Last modified: 2009-04-21
MySQL Performance: MySQL-5.4.0 and other InnoDB engines @dbSTRESS Benchmark (Apr.2009)
by Dimitri
SSC Team, 2009
Sun Microsystems Inc.
|
Ces informations sont données ŕ titre indicatif et n'engagent pas Sun Microsystems.
Table of contents
Customer Name(s): SSC Team
NDA: no
Contact Information:
Dates: Mar-Apr.2009
Keywords: MySQL 5.4, Perf Version , InnoDB, Percona, XtraDB, PostgreSQL, db_STRESS, M8000
Server(s):
- M8000 SPARC64-VI 16CPU (bi-core, bi-thread), 256GB RAM
Storage:
- ST6540, 2x LUN (RAID1 16HDD, 950GB)
System:
Application(s):
- MySQL 5.1.32 / 5.1.33
- MySQL 5.4.0
- InnoDB plugin 1.0.3
- XtraDB 1.0.2-3
- MySQL 5.Perf build5 (experimental)
- dbSTRESS test kit (injector)
Overview: Recently many changes came with new updates on XtraDB , InnoDB plugin and MySQL Perf Version - 5.4.0 is just announced and more experimental code is still in pipe! :-) Seeing a great performance improvements reached by XtraDB before (see: http://dimitrik.free.fr/db_STRESS_BMK_XtraDB_Percona_2009.html ), I was impatient to compare them all together and see where we are currently, and what is the next bottleneck :-)
All presented results here are "unofficial" and not engaging in any case Sun/MySQL. On the same time, benchmark testing gives us a way to learn (from bad or good), to see the whole result of improvements (if any), and provide information to make more efficient the next steps in development.
Goal(s): Even I was very curious to understand what's still blocking InnoDB to scale far better, but I tried to compare engine implementations first, and only then analyze contentions (all depends on time :-))
Result(s): on following pages :-)
As I expected to test all variations of InnoDB engine implementation I have to reduce the number of test cases to keep them within a given time slice :-)
I continue to use db_STRESS for the current testing too. A full db_STRESS description you may find here: http://dimitrik.free.fr/db_STRESS.html , and here some explanations about "active connections" and TPS graphs: http://dimitrik.free.fr/db_STRESS_BMK_2008.html#note_5220 . Current testing scenario will be limited only to the Stress scenario.
Stress scenario:
- Concurrent sessions: 1, 2, 4, 8, 16, 32, 64, 128, 256
- Think time: 0 sec.
- Read/Write ratio (RW): 0 (read-only), 1 (read+write), 10 (10 reads per write)
NOTE: there is 3 "write" operations within a single write transaction (insert + delete + update), so read+write case is quite aggressive, and having RW=10 making sense
- CPU cores: 8, 16, 32 cores
NOTE: all second threads are put off on all cores to avoid any ambiguity in result interpretation (specially on SPARC64-VI chip)
|
InnoDB thread concurrency
|
Even there was a lot of improvement within MySQL/InnoDB code during last time, I'm still suggesting to use "innodb_thread_concurrency" not equal to zero on production environment. No one database is protected from unexpected workload and it'll help to keep load even if the number of concurrent connections was multiplied by 4. (see also extreme case: http://dimitrik.free.fr/db_STRESS_BMK_2008.html#note_5231 :-))
As well one single graph explains it is better rather one page of words :-)
Impact of InnoDB thread concurrency
 |
|
|
Here is a simple example if InnoDB thread concurrency impact on Read+Write (RW=1) workload with MySQL 5.1.32 (default) version. As you see, concurrency=16 is still continuing to keep workload with 64 and 128 concurrent sessions (and in production I'll prefer such slowly decreasing TPS level rather drop down :-))
I'll cover this topic more in detail later in this document, and may just add here I've tested all cases with zero and non-zero concurrency value to evaluate made progress..
|
As mentioned in the previous tests ( http://dimitrik.free.fr/db_STRESS_PerfVersion_Feb2009.html ), InnoDB buffer pool size makes a big difference on the final results depending on the number of free pages existed during the test as well if data were retrieved from a cache or red from disk..
To avoid such primary bottleneck and focus more on engine internals, I've used 12GB buffer pool during all tests (until it's not mentioned explicitly).
|
Variants of InnoDB engine
|
All following engines where compiled from source in 64bit binaries with GCC 4.3.2 (gcc43) and/or SunStudio 12 (ss12). The same configure/compile options were used everytime (-m64 -O3):
#
# GCC43
#


CC=/usr/local/gcc4/bin/gcc
CXX=/usr/local/gcc4/bin/g++
CFLAGS="-m64 -mcpu=v9 -O3"
CXXFLAGS="-m64 -mcpu=v9 -O3"
LDFLAGS="-lmtmalloc"


./configure --prefix=/apps/mysql --with-plugins="myisam,innobase"


gmake install
Quite curious: all engines demonstrated a higher performance if were compiled with GCC43 - seems to me it's due GCC atomics used within MySQL code - while they are used when compiling with GCC43 but ignored for SS12; and atomics become important once locking contention become hot.
NOTE: MySQL-5.4.0 and PerfVersion are using Solaris atomics if compiled with SS12 (great work of Tim Cook @Sun)
Current "default" MySQL 5.1 distribution "as it" if you download if from mysql.com site. There was several significant performance improvement since GA 5.1.30, but, as you will see from folowing steps, "default" engine become outdated now.. And to better appreciate "better food" you should to know what do you have by default :-))
Following base my.conf configuration file was used:
[mysqld]
 max_connections=2000
 key_buffer_size=200M
 low_priority_updates=1
 sort_buffer_size = 2097152
 table_open_cache = 8000


# files
 innodb_file_per_table
 innodb_log_group_home_dir=/LOG/plugin
 innodb_log_file_size=128M


# buffers
 innodb_buffer_pool_size=12000M
 innodb_additional_mem_pool_size=20M
 innodb_log_buffer_size=8M


# tune
 innodb_checksums=0
 innodb_doublewrite=0
 innodb_support_xa=0
 innodb_thread_concurrency = 16
 innodb_flush_log_at_trx_commit=2
 innodb_flush_method= O_DIRECT
 innodb_max_dirty_pages_pct=15
NOTES:
- table_open_cache=8000 was used to avoid LOCK_open mutex contention
- REDO logs directory was placed to the different storage LUN to split data I/O from log traffic
- REDO log file size is chosen equal to 128MB ( innodb_log_file_size=128M ) - I've found this value as the most optimal from performance & recovery constrains (see: http://dimitrik.free.fr/db_STRESS_BMK_XtraDB_Percona_2009.html#note_5306 for more details)
- from the same link you may see that innodb_max_dirty_pages_pct=15 is not playing any role here, but I keep it as it in case once it'll work as it supposed to :-))
- I've set innodb_flush_log_at_trx_commit=2 as it gives "acceptable" transaction security without being completely I/O-bound on log writing :-)
InnoDB plugin since version 1.0.3 finally applied Google SMP patch and got an important improvement comparing to the "default" code shipped with MySQL 5.1.32 (see: innodb plugin-103 announce ). To be honest this improvement should be compared to the previous 1.0.2 plugin version (as "default" code is mainly based on it), but anyway it's a big step ahead!
(More details on InnoDB plugin performance enhancements you may find here: http://www.innodb.com/doc/innodb_plugin-1.0/innodb-performance.html )
No new parameters needed to add into the base my.conf file as plugin did not integrated yet I/O capacity and I/O threads patches.
However, from the following graphs you may see the performance gain with a new plugin compared to the "default" version on 8 cores.
Read-Only Workload vs default
 |
|
|
As you may see, InnoDB plugin performs at least twice better on 8 cores system since 16 concurrent sessions and bring an important performance boost for those who wants to get more benefit from the bought platform :-))
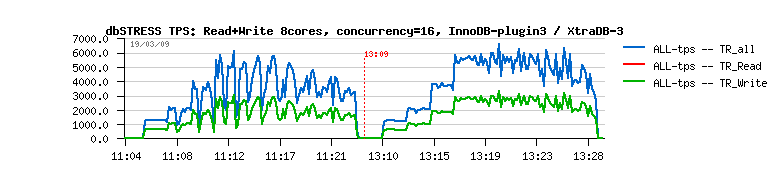
However, on the Read+Write workload the difference is not significant so much..
|
Read+Write Workload vs default
 |
|
To improve performance on the Read+Write workload InnoDB plugin needs to integrate some other patches too, as well I/O-related...
|
For a long time Percona team was famous with their performance patches and even more with their MySQL Performance Blog - tons of various interestions articles and discussions you may find here! :-)
However, for a long time performance patches remained just patches - not easy to apply and use on your own risk (I'm exaggerating probably here, but truth is not so far :-)). And for unknown reasons the main InnoDB code maintainer (InnoDB/Oracle) still did not apply performance patches until March 2009.. So, Percona started to ship their own "patched" and supported version of MySQL/InnoDB, and then prepared a true gift for all MySQL community when announced their own XtraDB engine
- it's based on InnoDB plugin (so fully InnoDB compatible) and incorporating most of available performance patches developed by MySQL community, Google team, as well specially by Percona.
Main differences:
- Massive use of GCC atomics brings an important performance boost comparing to XtraDB-2 (due GCC atomics compiles on Solaris only with GCC 4.3.2 or higher)
- I/O capacity : by default InnoDB has a fixed number of max I/O flushes/sec - it's equal to 100; and of course, most of current modern storage boxes may do much more, and have it as an adjustable parameter is a very helpful :-)
- I/O threads : by default InnoDB has only one "read prefetch" thread and only one thread flushing dirty pages from buffer pool; and of course you cannot get the max performance of your storage by doing a single per time I/O request - you should run them more and in parallel! - and it's exactly what's is done by this patch: you may configure more read and write I/O threads :-)
- Adaptive checkpoint : this is an absolutely proper to Percona feature and it makes a huge difference on any workload having writing! :-) Detailed information about how it works you may find here: http://www.mysqlperformanceblog.com/2008/11/13/adaptive-checkpointing/ ; from my part I may just add I like in general InnoDB checkpoint implementation - it looks quite different of the classic "stop the world" solution (see my notes about InnoDB checkpoint ), but Adaptive Checkpoint feature make things even better - it brings an incredible throughput stability during a read+write workload! (see following graphs)
My additional my.conf parameters for XtraDB:
# perf special
 innodb_adaptive_checkpoint = 1
 innodb_read_io_threads = 16
 innodb_write_io_threads = 16
 innodb_io_capacity = 2000
NOTE: XtraDB-3 performs way better comparing to XtraDB-2 (dbSTRESS results with XtraDB-2 you may find here: http://dimitrik.free.fr/db_STRESS_BMK_XtraDB_Percona_2009.html )
NOTE: few database freezes happened with XtraDB during my tests. The problem was hard to identify, but according to this bug report it was probably my case.. (I've tested XtraDB 1.0.2-3 version.) - I was lucky anyway as majority of tests worked successfully and I was able to get final results :-)
Adaptive Checkpoint in action
 |
|
As you may see from this graph, TPS level on the same read+write workload is much more stable with XtraDB rather with InnoDB plugin. Jumping between 3.000 and 6.000 TPS is much worse then say stable 5.000. Stable TPS also means stable response time for customers and no bad surprise in production :-)
|
Read-Only Workload
 |
|
Read-Only workload results are better with InnoDB plugin here. But keeping in mind XtraDB-3 version is based on 1.0.2 plugin, we may expect for sure it'll work as well as InnoDB plugin onc it'll be upgrade to the 1.0.3 plugin level! Let's see :-)
|
Read+Write Workload
 |
|
As said before, XtraDB performs much more better then InnoDB plugin on Read+Write workload. And I even do not mention here a "default" InnoDB coming with MySQL 5.1.32 :-) Seems to me everybody will have now a good reason to upgrade from an engine by "default" :-)
|
|
MySQL 5.4.0 and Experimental Perf Version builds
|
MySQL 5.4.0 is just announced at http://mysql.com and representing the first officially available build of MySQL "Performance Version" prepared by Sun MySQL Performance Team. It integrates already mentioned previously "I/O capacity" and "I/O read/write threads", as well unique for the moment implementation of InnoDB thread concurrency algorithm: instead of spinning on queue concurrency locks it's timeout-based - threads are simply sleeping little bit if the given max number of active threads is already reached or calling yield() to leave other continue working :-) Lock contention was divided by 10(!) freeing more CPU cycles to do something more useful :-)
More information about performance improvements in MySQL 5.4.0 you may find on Mikael's blog from the source :-)
NOTE: Adaptive Checkpoint is not integrated yet within MySQL 5.4.0.
MySQL 5.Perf - used here as a short name for the "Development MySQL Performance Version". Work is still continues and experimental changes applied to the code are labeled by "build number". Results with the first (zero) build were presented here: http://dimitrik.free.fr/db_STRESS_PerfVersion_Feb2009.html .
And now I was interested in the latest bits:
- MySQL 5.4.0 - the base performance release
- MySQL 5.Perf b4-b5 (build4, build5..) - current development builds
My additional my.conf parameters for Perf Version (same as XtraDB but without adaptive checkpoint):
# perf special
 innodb_read_io_threads = 16
 innodb_write_io_threads = 16
 innodb_io_capacity = 2000
Read-Only Workload @8cores
 |
|
As you may see, on 8 cores Read-Only workload Perf Version performs slightly worse then InnoDB plugin and slightly better then XtraDB (I think mostly because in MySQL 5.4.0 Buffer Pool mutexes are still not splitted into the lists yet (if I'm not wrong :-))
|
Read+Write Workload @8cores
 |
|
But it performs much better then others on the Read+Write workload (even without including Adaptive Checkpoint yet) - a big surprise! :-)
|
Read-Only Workload @16cores
 |
|
On 16cores performance gap is increasing in favor of MySQL 5.4.0. It's still continuing to keep growing workload and even increasing performance!
|
Read+Write Workload @16cores
 |
|
BTW, if you'll compare now Read+Write workload between 8 and 16 cores you'll see that performance gain is yet small after move to 16 cores (from 6.500 TPS to 7.500 TPS anyway for Perf Version :-) but only 15%)...
But on the same time there is a huge progress done here - there is no more performance degradation either! :-)) And yes, all my previous tests trying workloads on 16 cores were unsuccessful
(just look on this graph: XtraDB-2 on 16 and 8 cores - it was only 3 months ago, and performance was 50% better on 8cores vs 16(!).
So now I'm pretty sure - scaling on 16 cores and more it's only a question of time! :-))
|
|
Benchmark Results Overview
|
Before to present here the final TPS level histograms, I want to attract your attention to the performance graphs tracing each engine activity during different workloads. Final histograms are agerage TPS values for each level of load (#sessions). But on performance stats graphs you may see a more detailed view of engine internals - for ex. if your performance jumping all the time between 2.000 and 6.000 TPS you'll miss it just by looking on the final avg 4.000 TPS result, and drop from 6.000 to 2.000 TPS usually means drop of the response time (divides by 3) which in some cases may be just innacceptable :-)
That's why I don't like too much only "avg" values - it reminds me an old joke about "average temperature in the hospital" (it may be 36.7C° for ex., and you'll miss say 3 persons having 42C° and which may die tomorrow if you do nothing).. So my final histograms are presenting also the MAX TPS level for every workload too, so you may see the gap between MAX and AVG, and if it's very big you may get an idea about performance stability :-)
But well, before some performance stats. Several engines are presented on the same "live" graph (the execution order of engines you may see in the graph title (each engines was stressed with the same workload one after other)). Workload is progressively increased from 1, 2, 4, .. to 256 concurrent sessions and you may easily recognize it by TPS level steps.
Some observations:
- concurrency=16 seems to be the most secure value for the moment (don't agree? ;-))
- graphs are showing very well how read+write performance level is yet unstable..
- performance benefit after move from 8 to 16 cores is small, but there is no degradation anymore!!
- curiously, on 16 cores read+write results are better with concurrency=16 and not 32 :-)
- 32cores seems to be too much yet...
TPS Level: Read-Only Workload @8cores, concurrency=16
TPS Level: Read-Only Workload @16cores, concurrency=16
As you may see here, Read+Write performance level reaching 8.500 TPS, however they are missing stability, so AVG value will be only around of 7.000 :-)
TPS level: Read+Write Workload @8cores, concurrency=16
TPS level: Read+Write Workload @16cores, concurrency=16
All benchmark results are presented like a following histogram.
- The title is describing the test conditions (#cores, concurrency, etc.)
- Y-axis showing a TPS level
- X-axis representing a number of concurrent sessions during the given workload
- Legend explaining which color corresponding to each engine
- [Avg-TPS] link contains result with Average TPS Level
- [Max-TPS] link - with Max TPS Level reached during a given workload
Just click & enjoy! :-)
|
Example of one of the result Histograms
|
|
Full Benchmark Results List
|
ALL dbSTRESS Results
|
InnoDB Thread Concurrency: hack or feature?..
|
Before starting this discussion I'd remind you first about an impact of InnoDB concurrency value. As you may see from following graphs, all engines are impacted! Independently they have new or old concurrency implementation... By "impacted" I mean in most of cases it's the only option which gives you a way to keep workload on 64 or more concurrent sessions, and avoid a dramatic drop down of performance...
|
InnoDB thread concurrency impact on MySQL-5.4.0 @16cores
|
|
InnoDB thread concurrency impact on XtraDB-3 @16cores
|
|
Full Results comparing InnoDB thread concurrency impact
|
- InnoDB-5.1.32-gcc43 results:
[Avg-TPS]
- InnoDB-plugin3-gcc43 results:
[Avg-TPS]
- MySQL-5.4.0-gcc43 results:
[Avg-TPS]
- MySQL-5.Perf-b5-gcc43 results:
[Avg-TPS]
- XtraDB-3 results:
[Avg-TPS]
How InnoDB concurrency is working?..
I liked this short but quite detailed explanation given by Percona: http://www.mysqlperformanceblog.com/2006/06/05/innodb-thread-concurrency/
My best default value I may suggest for the moment is innodb_thread_concurrency=16 , and absolutely independently(!) on the number of CPU/cores :-)
And here is why..
MySQL and InnoDB has a lot of critical parts with are protected by mutexes, and sometimes by a single mutex (less and less with latest code improvement, buts still present). All threads (sessions) trying to access such critical parts are generating a mutex lock/unlock calls. And having too much lock calls on the same mutex generating a lock contention. More higher is a lock contention, more lower is your workload performance. Hope it's not surprising for you: if you already have a lock contention within your application it may become only more hot if you increase the number of CPU on your server (e.g. with more CPU you'll have less performance! sounds stupid, but it's a reality :-))
On the same time each application has its own "pic" of lock contention - once workload is reaching this pic the lock become too hot and performance starting to decrease.. Nobody willing to see performance decreasing, we expect it'll at least remain the same, even if with twice a number of users your response time is also as twice higher, and it's still better then 100x times drop, no? ;-)
If you cannot remove locks from your application, all you may to do is to limit concurrency on your hot locks. For example, if you see then after 20 concurrent users your performance is decreasing - your goal will be to not leave more than 20 users to be concurrent on the same time! What you need is a kind of multiplexor which will switch workload activity between users and guarantee no more than 20 of them will try to get a lock.
And it's exactly what InnoDB thread concurrency is doing: it's a way to have a guaranteed concurrency limit on locking of any critical resources. More lock contentions will be fixed within InnoDB code - more bigger "pic" value will be acceptable for innodb_thread_concurrency...
Now, let's say you have a server with 16CPU (cores). How many tasks it'll be able to run in parallel on its full speed?.. (well, of course you may say it depends on OS, and you're right (and of course Solaris is the best (kidding) :-)) - but let's say we have ideal OS and ideal 16 cores - so?..
Fully CPU-bound tasks on the box full power may be run only 16. Or 32 (if tasks are not really optimized and will stall on data or other). But well, once your CPU stats says all cycles are totally eaten you cannot expect performance increase anymore. Let's say it happened with 32 parallel tasks. What will happen now if they will be 64?.. (To simplify, let's say we have a global TPS numbers and individual per task response times) - So, will at least TPS level still remain the same with 64 parallel concurrent (ideally independent) tasks?..
TPS level will be slightly lower just because your OS also needs CPU cycles and OS scheduler will bring an overhead due cycles spent for task management. And with 128, 256, and more tasks it may be only worse! Finally we'll spend more time to manage tasks rather do a "useful" work (don't forget, tasks are CPU-bound)...
So, even within an ideally scaling application having 128 truly CPU-bound well optimized batches, running 5min each - you're still winning running them by 32 tasks together (in 4 groups, one after one), rather start them all together on the same time! :-)
And even more, imagine the result of each batch is awaited by a real person. If you start them all on the same time - all 128 persons will receive their results within more than 20min. But if you start them by 32 in 4 groups - only 25% persons will wait 20min, and just by simple ordering you make 75% awaiting persons more happier! :-)) specially the first ones who will wait only 5min now :-)
InnoDB thread concurrency is also following this idea, and BTW, Oracle MTS was designed for exactly the same reasons. So I see it as feature and not as a hack :-))
Let's see more far..
Limiting a number of concurrent CPU-bound tasks helps to keep the highest possible "useful" work level from the given server. The problem come if tasks starting to do I/O operations time to time - waiting each time 5ms on the random read (for ex.) will waste a huge amount of CPU cycles which was possible to give to other tasks!
And the problem with InnoDB thread concurrency is exactly the same: each thread (session) receives its elapse of execution time by engine, and this time is completely independent of what this thread will do. If it'll do a page read - all other "queued" threads will continue to wait in the queue while an "active" thread is wasting CPU cycles on waiting for the end of its I/O operation... And that's why we observe a so significant performance drop if a page read is not hitting its data from the buffer pool!
What should be changed: if any active thread have to execute a physical I/O operation (usually read) - it has to declare itself as no more active, leave its place to others in the queue, and only then execute its I/O request. It'll improve a lot the current concurrency schema, and probably prepare InnoDB internals for something even more optimized :-)
BTW, proposed pool-of-threads solution in MySQL 6.0 is suffering of exactly the same problem.
To implement an ideal solution you need to accept that each server has its critical pic number for:
- max CPU-bound tasks executed in parallel
- max I/O operations in parallel accepted by its storage subsystem
- max Network tasks sending & receiving packets in parallel
So, ideally we should attribute for a given system how many database may run of:
- CPU workers
- IO workers
- NET workers
The numbers of workers in each category is chosen according the given system limits. And it'll finally guarantee the system will run its the most optimal speed!
Each worker is session independent. It just:
- waits for a job from its input queue
- execute received job
- send the result to its output queue
- waits for a job from its input queue
- ...
All what need to do "user sessions" - is just split a user request into tasks for database workers and combine the answers :-) If there are only few sessions - they may use the server better as (depending on the query), but query execution may be shared by several workers; and after we come very close to implement a parallel query execution! :-))
The concept is not new, and was already implemented at least once by INFORMIX :-))
|
Current Hottest Lock contention during Read-Only workload
|
While InnoDB thread concurrency is set - the hottest lock contention will be on the concurrency management part (of course). So, to understand what is blocking InnoDB from scaling more far innodb_thread_concurrency should be set to zero :-)
I've tried to trace Read-Only workload locks that time (and it gave some ideas how to setup contention monitoring for the next tests)... BTW, it's a bad scalability on the Read-Only workload is the most hard to explain, as only reading data should not create any contention, isn't it? ;-))
So, I observed with "manually tracing" 2 cases on 16 cores:
- First: read-only test was started with an empty buffer pool (and rows are constantly reading from disk)
- Second: all rows are already sitting in the buffer pool
Here are my "plockstat" outputs (first 5-7 lines, most hot contentions).
- Lock contention on the Read-Only workload while data are still reading from disk:
16 sessions
Count     nsec Lock                         Caller
-------------------------------------------------------------------------------
 4705    29481 mysqld`LOCK_open             mysqld`_Z10open_tableP3THDP10TABLE_LISTP11st_mem_rootPbj+0x3a8
 2188    25118 mysqld`LOCK_open             mysqld`_Z19close_thread_tablesP3THD+0xcc

     10   262840 0x100762b70                  mysqld`os_mutex_enter+0x4

     27    12888 mysqld`LOCK_alarm            mysqld`thr_end_alarm+0x10

     17    12276 mysqld`LOCK_alarm            mysqld`thr_alarm+0x1c
...

32 sessions
Count     nsec Lock                         Caller
-------------------------------------------------------------------------------
33792   260383 mysqld`LOCK_open             mysqld`_Z10open_tableP3THDP10TABLE_LISTP11st_mem_rootPbj+0x3a8
13850   156355 mysqld`LOCK_open             mysqld`_Z19close_thread_tablesP3THD+0xcc
 6357   199987 0x100762588                  mysqld`os_mutex_enter+0x4
 5202   167966 0x100762588                  mysqld`os_mutex_enter+0x4
 2091   208586 0x100762588                  mysqld`os_mutex_enter+0x4
  823   206320 0x100762588                  mysqld`os_mutex_enter+0x4
  624   198637 0x100762588                  mysqld`os_mutex_enter+0x4
...

64 sessions
Count     nsec Lock                         Caller
-------------------------------------------------------------------------------
48526   543352 mysqld`LOCK_open             mysqld`_Z10open_tableP3THDP10TABLE_LISTP11st_mem_rootPbj+0x3a8
18989   241576 mysqld`LOCK_open             mysqld`_Z19close_thread_tablesP3THD+0xcc
 9441   284768 0x100762588                  mysqld`os_mutex_enter+0x4
 7791   249328 0x100762588                  mysqld`os_mutex_enter+0x4
 4064   284151 0x100762588                  mysqld`os_mutex_enter+0x4
...

128 sessions
Count     nsec Lock                         Caller
-------------------------------------------------------------------------------
61098  1200011 mysqld`LOCK_open             mysqld`_Z10open_tableP3THDP10TABLE_LISTP11st_mem_rootPbj+0x3a8
25071   238692 mysqld`LOCK_open             mysqld`_Z19close_thread_tablesP3THD+0xcc
11334   416758 0x100762588                  mysqld`os_mutex_enter+0x4
 4423   721319 0x100762588                  mysqld`os_mutex_enter+0x4
 8879   322576 0x100762588                  mysqld`os_mutex_enter+0x4
 5634   348857 0x100762588                  mysqld`os_mutex_enter+0x4
...

256 sessions
Count     nsec Lock                         Caller
-------------------------------------------------------------------------------
50536  3376433 mysqld`LOCK_open             mysqld`_Z10open_tableP3THDP10TABLE_LISTP11st_mem_rootPbj+0x3a8
12760  1283299 0x100762588                  mysqld`os_mutex_enter+0x4
 9541  1309168 0x100762588                  mysqld`os_mutex_enter+0x4
12658   903163 0x100762588                  mysqld`os_mutex_enter+0x4
 9801  1022544 0x100762588                  mysqld`os_mutex_enter+0x4
21909   386888 mysqld`LOCK_open             mysqld`_Z19close_thread_tablesP3THD+0xcc
 9233   557634 0x100762588                  mysqld`os_mutex_enter+0x4
...
- Lock contention while all data are sitting in the buffer pool:
32 sessions
Count     nsec Lock                         Caller
-------------------------------------------------------------------------------
31168   259453 mysqld`LOCK_open             mysqld`_Z10open_tableP3THDP10TABLE_LISTP11st_mem_rootPbj+0x3a8
12925   154502 mysqld`LOCK_open             mysqld`_Z19close_thread_tablesP3THD+0xcc
 7347   203271 0x100762588                  mysqld`os_mutex_enter+0x4
 6002   172267 0x100762588                  mysqld`os_mutex_enter+0x4
 2524   204915 0x100762588                  mysqld`os_mutex_enter+0x4
...

64 sessions
Count     nsec Lock                         Caller
-------------------------------------------------------------------------------
32003   304938 mysqld`LOCK_open             mysqld`_Z10open_tableP3THDP10TABLE_LISTP11st_mem_rootPbj+0x3a8
12930   170752 mysqld`LOCK_open             mysqld`_Z19close_thread_tablesP3THD+0xcc
 7799   235271 0x100762588                  mysqld`os_mutex_enter+0x4
 6640   193273 0x100762588                  mysqld`os_mutex_enter+0x4
 2993   237082 0x100762588                  mysqld`os_mutex_enter+0x4
 1208   283836 0x100762588                  mysqld`os_mutex_enter+0x4
...

128 sessions
Count     nsec Lock                         Caller
-------------------------------------------------------------------------------
59778   973223 mysqld`LOCK_open             mysqld`_Z10open_tableP3THDP10TABLE_LISTP11st_mem_rootPbj+0x3a8
24707   241628 mysqld`LOCK_open             mysqld`_Z19close_thread_tablesP3THD+0xcc
10412   422900 0x100762588                  mysqld`os_mutex_enter+0x4
 4890   755574 0x100762588                  mysqld`os_mutex_enter+0x4
 8266   331302 0x100762588                  mysqld`os_mutex_enter+0x4
 3465   745314 0x100762588                  mysqld`os_mutex_enter+0x4
 3613   645061 0x100762588                  mysqld`os_mutex_enter+0x4
 5114   321406 0x100762588                  mysqld`os_mutex_enter+0x4
 1803   620108 0x100762588                  mysqld`os_mutex_enter+0x4
...

256 sessions
Count     nsec Lock                         Caller
-------------------------------------------------------------------------------
64029  7220793 mysqld`LOCK_open             mysqld`_Z10open_tableP3THDP10TABLE_LISTP11st_mem_rootPbj+0x3a8
 8193  1546318 0x100762588                  mysqld`os_mutex_enter+0x4
 6672  1595149 0x100762588                  mysqld`os_mutex_enter+0x4
27380   288497 mysqld`LOCK_open             mysqld`_Z19close_thread_tablesP3THD+0xcc
 6113  1279058 0x100762588                  mysqld`os_mutex_enter+0x4
 9664   781844 0x100762588                  mysqld`os_mutex_enter+0x4
 7460   539336 0x100762588                  mysqld`os_mutex_enter+0x4
 5092   559434 0x100762588                  mysqld`os_mutex_enter+0x4
 2233  1120384 0x100762588                  mysqld`os_mutex_enter+0x4
...
As you may see, the most hottest lock contention is on the LOCK_open mutex in both cases!
On the same time, "unnamed" mutex 0x100762588 (coming from sync_array functions) become more and more hot while rows are no more read from disk, and probably even more hot if we combine all time spent on it!
But the main problem is LOCK_open for the moment, and only once it'll be resloved (by splitting or recoding) makes sense to resolve other problems :-)
(BTW, my open table cache is set to 8000 (just in case))...
I realized I did not test PostgreSQL for more than one year now, and was curious to see how performs the current latest PostgreSQL version 8.3.7. Two years ago PostgreSQL was twice better than MySQL (see http://dimitrik.free.fr/db_STRESS_BMK_Part1.html for details)
I've compiled ProstgreSQL 64 bit binaries from the sources with GCC43 (similar as MySQL).
To adapt flush (fsync) option (comparable with InnoDB's innodb_flush_log_at_trx_commit=2) I've used synchronous_commit=off .
On 16cores performance was quite low on the read-only workload (5.000 TPS only), so I quickly switched to 32cores - as PostgreSQL did not suffer in the past such high locking problems as MySQL, the result should be only better on 32cores. And it's true - 6.500 TPS reached on 32cores.
Initially I used DIRECTIO mount option to see how high will be a caching impact. I set shared_buffers=12G (as InnoDB), but seeing still a lot of reading from the disk, I've increased it to 24GB, and it did not help either. Finally, I got impression the mix of shared buffers + partially delegating I/O buffering to the filesystem will be more optimal :-) Without DIRECTIO and 12GB shared buffers there was no read I/O anymore. However, in the same conditions increasing shared buffers to 24GB still helped too! - 7.500 TPS on the read-only (vs 6.500 with 12GB), 7.000 TPS on the read+write (vs 6.000 with 12GB).
Observations:
- huge amount of I/O operations generated by PostgreSQL: reads were decreased by using FS cache, writes are decreased with shared buffers = 24GB
- a single session on the Read-Only workload reaching only 500 TPS (while InnoDB has now 1000 TPS) - so there is already something goes slowly from the beginning.. - the response time of the "select" queries seems to be slightly higher comparing to MySQL, but not too much to expect something abnormal..
- on the same time if it scales well, even with 500 TPS at a single session I should reach 15.000 - 16.000 TPS on my 32 cores
- but Read-Only TPS reaching only 6.500 with shared buffers = 12GB, and 7.500 TPS with 24GB..
- final max TPS level on all workload is 7.000 - 7.500 which make me think there is a contention or limitation somewhere (communication? concurrent access?)
- there is no any system bottleneck (specially on read-only), even CPU is used at less than 80%(!)
- on the same time on any workload performance level is staying admirably stable! but pic throughput is remaining the same even with growing number of clients (sessions)
- 2 years ago on the same test case MySQL was 2 times slower vs PostgreSQL, today it's PostgreSQL 2 times slower on Read-Only workload, and equal or slower on Read+Write workloads...
I did not have more time to investigate farther, but hope it was not the last test :-))
Workload activity graphs (best cases) are presented in appendix in the end of report..
MySQL 5.1.33
Default 5.1.33 is not performing better comparing to default 5.1.32
XtraDB-4
While I was finishing this report, Percona shipped the new version of XtraDB based on the latest 1.0.3 InnoDB plugin: http://www.mysqlperformanceblog.com/2009/04/08/xtradb-storage-engine-release-4/
And I got a solution to run another test on the same platform! But I cannot add new XtraDB results into the final list because XtraDB is still suffering of rw_lock problem - database was freezed several times with giving a following message in the log file:
–Thread 1080 has waited at btr/btr0cur.c line 508 for 241.00 seconds the semaphore:
 X-lock on RW-latch at fffffffc72f811f8 created in file buf/buf0buf.c line 683
 a writer (thread id 1080) has reserved it in mode wait exclusive
 number of readers 0, s_waiters flag 0, x_waiters flag 1, lock_word: 100000
 Last time read locked in file btr/btr0cur.c line 508
 Last time write locked in file btr/btr0cur.c line 508
Analyzing mysql log file, I may suppose that freeze arriving during read+write workload when several sessions trying to access/modify different but neighbor rows (if I remember well InnoDB sometime also locking neighbors). And it's not an InnoDB bug as it not happens with InnoDB plugin or Perf Version. I've posted a question about freezes on comments, but did not have a fix on time..
The only thing I may confirm now - XtraDB-4 is not better on the Read-Only workload comparing to XtraDB-3 (and, honestly, I expected it'll perform at least as well as InnoDB plugin). And there is even a slight performance degradation on concurency=0 (but probably all it's due "rw_lock" problem). Regarding freezes - hope it'll be fixed soon...
|
XtraDB-4 @16cores concurrency=0
|
|
XtraDB-4 @16cores concurrency=16
|
Final notes:
- Huge performance improvement on InnoDB engine!
- MySQL 5.4.0 /Perf Version seems to be the most performant InnoDB implementation for the moment! (only except on the Read-Only workload @8cores where InnoDB plugin-1.0.3 is leading!)
- MySQL is outperforming PostgreSQL on my tests now!
- Regarding scalability, get a look at 8 vs 16 cores graphs, and you'll see it's the big step forward - no performance degradation on 16 cores is a very positive sign! and there is only 3 months distance between tests!
- LOCK_open needs a fix ASAP! :-)
- Analyzing my test results, it's too early to say InnoDB is scaling up to 16 cores, but the test results on 16 cores are already outperforming 8 cores, and I'm absolutely sure now - very quickly it'll perform even better! so see you soon! :-))
I've added here the most interesting STAT graphs observed during dbSTRESS workloads on different engines. You may find here a lot of other interesting details if you're not seeking just for a final result :-)
Few "decoding" notes for titles:
- ccr=N : means concurrency=N (more exactly: innodb_thread_concurrency=N (but it's too long :-))
- RW=M : means Read/Write ratio = M (0 - Read-Only, 1 - Read+Write, 10 - ten Reads per single Write)
|
Workload STATs: MySQL 5.1.32
|
Workload STATs: MySQL 5.1.32
|
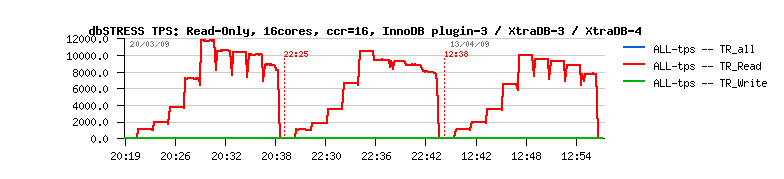
Workload STATs: InnoDB plugin 1.0.3
|
Workload STATs: InnoDB plugin 1.0.3
Workload STATs: XtraDB
|
Workload STATs: MySQL-5.4.0
|
Workload STATs: MySQL-5.4.0
|
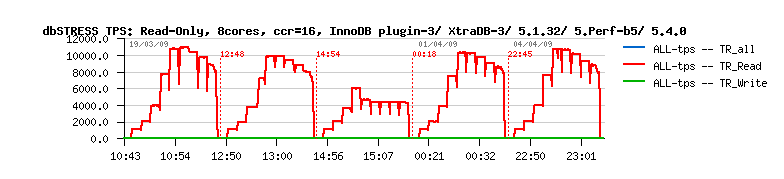
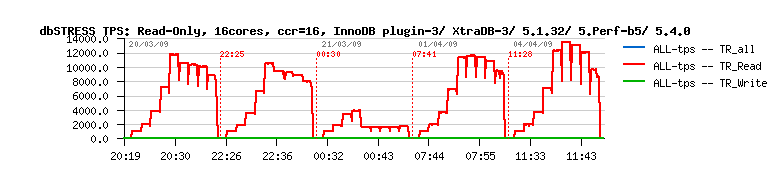
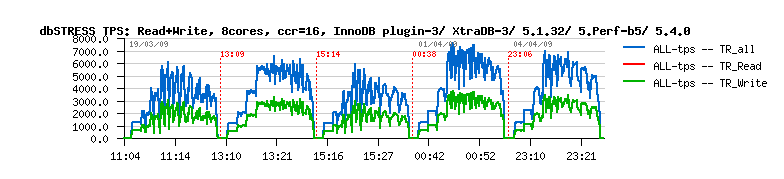
Workload STATs: MySQL-5.Perf-build5
|
Workload STATs: MySQL-5.Perf-build5
|
Workload STATs: PostgreSQL 8.3.7
|
Workload STATs: PostgreSQL 8.3.7