Created: 2008-11-19
Last modified: 2008-12-15
MySQL Scalability @2008
by Dimitri
SSC Team, 2008
Sun Microsystems Inc.
|
Ces informations sont données ŕ titre indicatif et n'engagent pas Sun Microsystems.
Table of contents
Customer Name(s): Sun / MySQL
NDA: no
Contact Information:
- Dimitri@Sun.COM
Dates: Nov - Dec/2008
Keywords: MySQL, InnoDB, PBXT, Falcon, Concurrency, Scalability, db_STRESS, M9000, M-series, SPARC64
Server(s):
- domain #0 M9000, 192GB RAM, 12CPU SPARC64-VII 2500Mhz (or 48cores, or 96threads) - DB Server
- domain #1 M9000, 256GB RAM, 16CPU SPARC64-VII 2500Mhz (or 64cores, or 128threads) - Client Injector
Storage:
- SE3511 RAID1 900GB, single FC-port, Controller with a write cache
System:
- Solaris 10 update 5
- UFS
Application(s):
- MySQL
- db_STRESS
- dim_STAT
Overview: It's more than one year I did not test any latest MySQL version, and as everybody from the MySQL team tell me there was a lot of performance improvements since my last test - I started to seek for a good occasion to replay again my dbSTRESS tests on the even more powerful and widely scalable platform. As well, I was curious to apply on the real workload all tuning findings seen from other teams - MySQL is a part of Sun now and everybody now paying attention about this database engine more then ever...
So, once we got a customer canceled their M9000 testing - I did not miss the opportunity to run my tests within a lost for other machine time :-)
Goal(s): Understand MySQL scalability bottlenecks or potential limits, and find the most optimal configuration for the single MySQL instance. My main interest will be the most currently popular transaction engine - InnoDB.
Result(s): continue to read, please :-)
To understand MySQL internal bottlenecks, I have to be sure there is no one H/W limitation blocking database engine. That's why during most of the tests my "redo flushing" will stay OFF (means it'll still be written to the filesystem, but not flushed to the disks (innodb_flush_log_at_trx_commit=0)). I also limited my tests to the InnoDB as the most attractive, currently working and stable transactions engine.
From several "best practice" findings I may summarize other "my.conf" options:
- table_cache = 8000 (too small by default, should be big to avoid table file descriptors contention)
- innodb_buffer_pool_size = 16000M (seems InnoDB is quite sensible)
- innodb_thread_concurrency = 0 (disable InnoDB thread concurrency and reach better scalability)
So, my initial MySQL config file is looking like:
[mysqld]
 max_connections=2000
 key_buffer_size=200M
 low_priority_updates=1
 table_cache = 8000
 sort_buffer_size = 2097152
 innodb_file_per_table
 innodb_log_file_size=500M
 innodb_buffer_pool_size=16000M
 innodb_additional_mem_pool_size=20M
 innodb_log_buffer_size=8M
 innodb_checksums=0
 innodb_doublewrite=0
 innodb_support_xa=0
 innodb_thread_concurrency=0
 innodb_flush_log_at_trx_commit=0
 innodb_max_dirty_pages_pct=15
The full dbSTRESS description and as well some reports about my previous tests with MySQL you may find here - http://dimitrik.free.fr
Here I'll just remind main point of 2 test scenarios, as well some details to better understand the contents of the workload graphs.
Stress Test scenario:
- Goal: max TPS and +/- stable TPS level after max
- Think time: 0 sec (full stress)
- Test iterations:
- Concurrent Sessions: 1, 2, 4, 8, 16, 32, 64, 128, 256 (increasing step by step)
- Ratio Write / Read: 0, 1, 10, 1000 (0 means read-only)
1600 Users Test scenario:
- Goal: stable 1 TPS for each session, all sessions should should stay "alive"
- Think time: 1 sec (cool)
- Test iterations:
- Concurrent Sessions: 50, 100, 200, 400, 600, 800, 1000, 1200, 1400, 1600 (increasing step by step)
- Ratio Write / Read: 0, 1, 10 (0 means read-only)
Graph: Number of Active Sessions
 |
|
|
Here is an example of graph showing a Number of Active Clients (Sessions) during the test (Stress Test in this case, with Read/Write ratio=0 (RW=0)). Axes X is a time scale; axes Y is a value; legend + title giving the name(s) of value(s) as well a test name.
This graph representing a result from 2 tests (one started at 11:20 on 19/Nov, and second at 05:34 on 03/Dec):
- the first test is bad: no more 200 sessions able to work together
- the second test is ok: load increasing step by step and all 256 sessions are running together
|
Graph: Number of TPS
 |
|
|
This is an example of graph showing a TPS level (Stress Test in this case, with Read/Write ratio=0 (RW=0)). Axes X is a time scale; axes Y is a TPS value; legend + title giving the name(s) of value(s) as well a test name (TPS Read/ Write/ All in this case).
This graph representing a result from 2 tests (one started at 11:20 on 19/Nov, and second at 05:34 on 03/Dec):
- the first test is really bad: 3000 TPS max, and then dramatic fall down after 16 concurrent sessions
- the second test is better, bit is still bad: 6000 TPS max, and fall down after 32 sessions...
What is bad here - even if your database is not scaling very well with growing number of concurrent sessions it should not drop down its TPS level!...
|
Initially I expected to test following MySQL versions:
- MySQL v.5.0.37 (to compare performance improvements vs 5.0.67)
- MySQL v.5.0.67 (latest official 5.0 on that moment)
- MySQL v.5.0.67-percona-highperf
- MySQL v.5.1.29 (latest 5.1 RC on that moment)
- MySQL v.6.0.7 (latest 6.0 alpha on that moment)
All binaries are compiled myself from the sources.
|
Percona MySQL patched version
|
Percona company is providing its own patched MySQL builds and sources. Their improvements are very interesting, but I did not have enough time to discover them in depth... My main problem with Percona code was to get it compiled on Solaris :-) And I'm not really happy here because I was able to compile only 32bit version with GCC and it cannot be truly compared to others as was limited to 2GB buffer cache max (vs 16GB for other 64bit builds, and according to what I observer, buffer cache size is playing a very important role for InnoDB))...
As well, http://www.mysqlperformanceblog.com is a great source of all MySQL performance-related information!
Compiling MySQL Percona b7
Persona MySQL build7 was shipped on that time and I was very curious to see what kind of improvement may we expect if their patches will be ported and officially applied to the main branch...
However, it was not so easy to compile the code sources as I expected:
- 1.) you'll need a GCC to compile persona MySQL (well, it was easier way, rather to fix all compiler errors I got initially)
- 2.) you may need to fix some source files to finish compiling successfully, as well "strsep()" string function is missing on Solaris, so you'll need to add and equivalent into the source:
To fix pure C++ error on /sql:

sql_class.h:49: error: expected constructor, destructor, or type conversion before “extern”
sql_class.h:49: error: expected `,’ or `;’ before “extern”
sql_class.h:59: error: expected constructor, destructor, or type conversion before “extern”
sql_class.h:59: error: expected `,’ or `;’ before “extern”
...

And seems something goes wrong with DECLS macros:

#ifdef __cplusplus
__BEGIN_DECLS
#endif
extern ulonglong frequency;
#ifdef __cplusplus
__END_DECLS
#endif

(same error with SS12 too)

I’ve added explicitly into sql_class.hh:

#undef __BEGIN_DECLS
#undef __END_DECLS
#ifdef __cplusplus
# define __BEGIN_DECLS extern “C” {
# define __END_DECLS }
#else
# define __BEGIN_DECLS /* empty */
# define __END_DECLS /* empty */
#endif

And it worked! :-))

Then I got an error about missing “strsep” function in sql_show.cc, so
I’ve found and added a following code (found via google):

http://www.koders.com/c/fid4F16A5D73313ADA4FFFEEBA99BE639FEC82DD20D.aspx?s=md5

char *
strsep (char **stringp, const char *delim)
{
  char *start = *stringp;
  char *ptr;
...
}
- NOTE: there was no problem to compile the same code under Linux with GCC4.3
Finally I was able to compile only 32bit MySQL Percona version.
My First tests I've started with MySQL 5.0.37, and then progressed with other versions once they were ready (compiled and 10M Objects loaded (64GB avg database size))...
|
First STRESS Test results
|
First Stress Test is running with following parameters:
[mysqld]
 max_connections=2000
 key_buffer_size=200M
 low_priority_updates=1
 table_cache = 8000
 sort_buffer_size = 2097152
 innodb_file_per_table
 innodb_log_file_size=500M
 innodb_buffer_pool_size=16000M
 innodb_additional_mem_pool_size=20M
 innodb_log_buffer_size=8M
 innodb_checksums=0
 innodb_doublewrite=0
 innodb_support_xa=0
 innodb_thread_concurrency=0
 innodb_flush_log_at_trx_commit=0
 innodb_max_dirty_pages_pct=15
Tested MySQL versions: 5.0.37, 5.0.67, 5.0.67-percona, 5.1.29, 6.0.7
NOTE:
- all versions compiled and running with mtmalloc library
- my compiled binaries ran slightly faster vs "standard" from mysql.com, so I used mine
- there was no difference in tests if mysqld process priority was changed to FX
 |
|
|
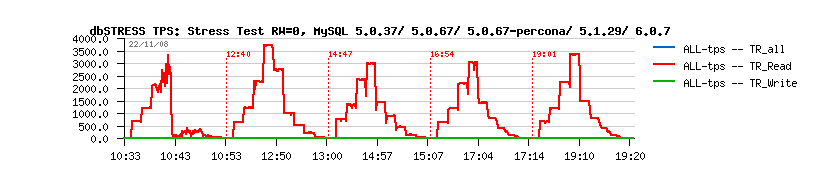
Here is a Read-Only (RW=0) Stress Test graph comparing TPS numbers between: MySQL 5.0.37/ 5.0.67/ 5.0.67-percona/ 5.1.29 and 6.0.7.
As you may see, TPS peak level is reached with 8 concurrent sessions and then just dropping down with 16 and more clients... With 64 sessions there is less TPS vs a single client load...
Seems to be the same situation as I saw before in my previous tests. Since 16 concurrent sessions the lock contentions between MySQL threads become so hot then it kills performance... What will be more optimal is to have a some kind of multiplexor within a mysqld to leave only a given max threads really "working" internally and just keep a context and communication with "sessions" threads... I also tried a various solutions with connection pools for MySQL (like mysql-proxy), but seems the pooling is possible in case when sessions are closed and opened all the time (however I may be wrong here, I did no go too much in depth here). As well with mysql-proxy I got only 2000 TPS max even without any proxy script, so with additional logic it may be only worse, and I stop to seek in this direction...
|
|
Full STATS during First Test
|
Full STATS during First Test
Even before InnoDB MySQL already have a "thread_concurrency" parameter. Seeking in the MySQL sources I found all it does is calling thr_setconcurrency() system call with a given value. The only problem is since Solaris 9 we use a one-to-one LWP model in Solaris and this system call is not doing anything anymore and just kept for backward compatibility in Solaris...
|
First 1600 Users Test results
|
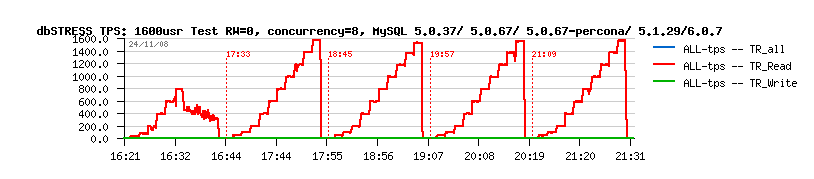
First 1600 users test simply killed me - no one test finished correctly!!!
During every test after 200 concurrent sessions (and each session is sleeping 1 second between queries) the TPS level just dropped down and stayed on the near of zero value... Bummer!...
|
What is going wrong???...
|
 |
|
|
Should I say I spent a bunch of time to see if there is something wrong within my code/ binaries/ data/ etc. etc. etc... Then I started to compare last year results, graphs, loads - and it was clear for me it was not a dream, and 1600 users load worked for me with success last year!
The only things which probably may make a difference is the "innodb_thread_concurrency" which is equal to 0 now and was equal to 8 last year... But all recent publications about MySQL performance saying it should be 0 to get the best scalable results - well, let's check anyway...
|
|
Same Test with innodb_thread_concurrency = 8
|
 |
|
|
As you may see - having innodb_thread_concurrency equal to 0 may be very dangerous! :-))
Setting it to 8 seems played a role of such "session multiplexor" as I expected but on the InnoDB level! Instead to leave threads beating for the data access, InnoDB managing them itself and keeping only 8 active "workers"...
Also, we may see a huge improvement comparing to the old 5.0.37 version which is still dead on higher number of sessions... No doubt, there was a good progress made within the MySQL code during last year! :-))
|
|
Restart ALL Tests with innodb_thread_concurrency = 8
|
It's quite cool feature in InnoDB - we may change innodb_thread_concurrency live on the running database! But anyway, I wanted to better understand what will be the real impact on both Stress and 1600usr workloads. So I've restarted all test again but with innodb_thread_concurrency=8 ...
|
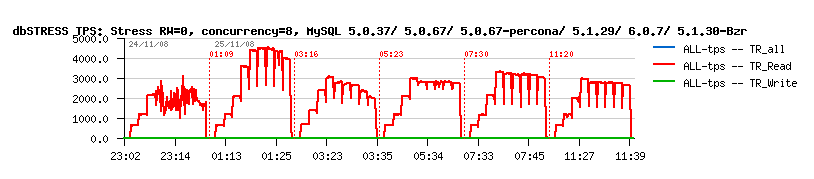
Stress Test with innodb_thread_concurrency = 8
|
 |
|
|
As you may see on this graph the difference in TPS level is simply killing!
Observations:
- TPS level is much more stable whith increasing number of concurrent sessions!
- Max TPS level is the same or higher (4500 now for v.5.0.67)
- Huge improvement in MySQL 5.0.67 comparing to 5.0.37
- Regression in 5.1+ vs 5.0
- Percona MySQL seems to suffer small buffer cache size, so should not be compared to other..
|
Full STATS during Stress Test with innodb_thread_concurrency = 8
Full STATS during Stress Test with innodb_thread_concurrency = 8
|
1600 Users Test with innodb_thread_concurrency = 8
|
 |
|
|
As I said previously, innodb_thread_concurrency =8 made a huge difference! It's just making this test work and completely removing a previous dead state :-))
Observations:
- Read-Only (RW=0): TPS level is truly stable from begin till the end and strongly keeping 1 TPS for each session
- Read/Write 50/50 (RW=1): TPS level is staying relatively stable from begin till the end but cannot guarantee 1 TPS for each session, but even response time become higher with more sessions, all sessions are still active and continue to work together!
- Read/Write Mix (RW=10, 1000): Less Write transactions are executed in concurrency with Read - more stable become TPS level (probably most realistic with RW=10 comparing to the real-life workloads)...
- Huge improvement in MySQL 5.0.67 comparing to 5.0.37
- MySQL Percona seems to be the most stable comparing to other when Write transactions are present (specially write response time is the most lower and stable)
|
Full STATS during 1600 Users Test with innodb_thread_concurrency = 8
Full STATS during 16OO Users Test with innodb_thread_concurrency = 8
Once my workload became stable, I've tried to find other points of possible improvement.
The first step seems to me is to see if innodb_thread_concurrency = 8 is really optimal, or may give some positive variations with bigger value?...
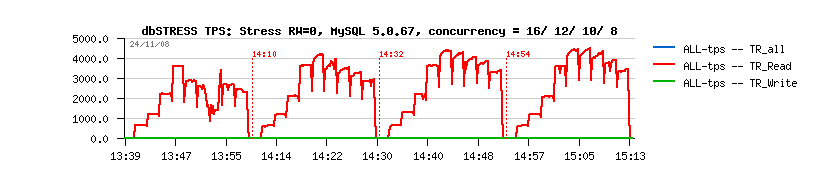
Compare innodb_thread_concurrency = 16/ 12/ 12/ 8
 |
|
As you may see, innodb_thread_concurrency = 8 is still the most optimal option for the moment...
Let's see if there is something else to improve :-))
|
|
MySQL Buffer Cache allocation...
|
I was quite surprising to discover MySQL/InnoDB is allocating buffer cache as a simple HEAP pageable zone and not as ISM Shared Memory (for ex.) like it's doing Oracle (for ex.)...
I've jumped into the source code and discovered at least for Linux it forces SHM usage and paying special attention to use big page size for space allocation. Well, Solaris is using 4MB page size automatically when application asking to allocate a big memory space, but the MySQL code is doing a simple malloc and it should be not optimal while your database is running on the already well loaded server - having buffer cache pages moved in memory is never a good idea :-))
So, I've changed little bit the InnoDB code...
To support ISM SHM, I've added into ./mysql-5.0.67/innobase/os/os0proc.c following part:
#ifdef UNIV_SOLARIS
#define PAGE_4M  (1024*1024*4)
  ulint size;
  int shmid;
  void *ptr = NULL;
  struct shmid_ds buf;
  /* Align block size to os_large_page_size */
  size = (n/PAGE_4M + 1) * PAGE_4M;
  shmid = shmget( IPC_PRIVATE, (size_t)size, IPC_CREAT | 0777 );
  if (shmid < 0) {

      fprintf(stderr, "InnoDB: HugeTLB: Warning: Failed to allocate %lu bytes. "

              "errno %d\n", size, errno);
  } else {

      ptr = shmat(shmid, 0, SHM_SHARE_MMU );

      if (ptr == (void *)-1) {

        fprintf(stderr, "InnoDB: HugeTLB: Warning: Failed to attach shared memory "

                "segment, errno %d\n", errno);

      }

      /* Remove the shared memory segment so that it will be automatically freed

        after memory is detached or process exits */

      shmctl(shmid, IPC_RMID, &buf);
  }
  if (ptr) {

      if (set_to_zero) {
#ifdef UNIV_SET_MEM_TO_ZERO

        memset(ptr, 0, size );
#endif
  return( ptr );
  }
...
Memory allocation
Ass you may see now - my 16GB of buffer size are allocated as ISM shared segment:
# pmap -sx 16755
...
00000001007F8000         32         32         32            -   8K rwx--    [ heap ]
0000000100800000      16384      16384      16384            -   4M rwx--    [ heap ]
0000000101800000       4096            -            -            -      - rwx--    [ heap ]
0000000101C00000    4030464    4030464    4030464            -   4M rwx--    [ heap ]
0000010000000000   16388096   16388096            -   16388096   4M rwxsR    [ ism shmid=null ]
FFFFFFFF7C73E000          8          8          8            -   8K rw--R    [ stack tid=10 ]
...
#
|
Any iprovement for Read-Only workload?...
|
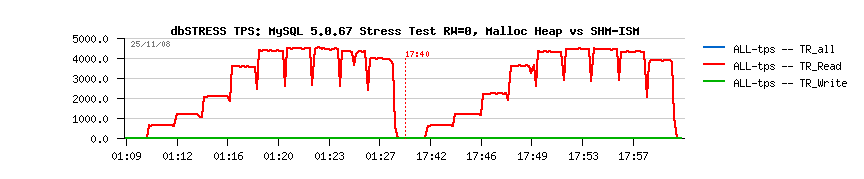 |
|
|
As you may see, it's at least exactly the same TPS level (well, I have 256GB RAM on this server and probably to see the real difference you should have less RAM on the server, or other applications running on the same time :-))
But I think at least the buffer cache access should be more optimal now.
|
|
Any iprovement for Read+Write workload?...
|
 |
|
|
Believe or not, but Read+Write workload is working slightly better with ISM shared segment rather default HEAP solution. And, honestly, I don't think it may be worse :-))
So, probably it should be fine to add ISM SHM support for Solaris - or even better, just to present is as configuration option? - In this case there will be a choice for everybody :-))
RFE? ;-))
|
MySQL + InnoDB generating a lot of mutex locking related to various internal data/resources access. And seems to me it's still the main source of MySQL scalability limitations...
On the same time the locking nature is completely changing when innodb_thread_concurrency is not equal to zero - other functions (like srv_conc_enter_innodb()) going on the top of locks...
On the same time so much increased CPU System Time is quite negative...
So, I've tried to get a more close look on it. What is hot in the kernel?..
Count indv cuml rcnt     nsec Hottest Lock           Caller
-------------------------------------------------------------------------------
362156  29%  29% 0.00    23991 0x600e0693a00          lwp_unpark+0x54
176963  14%  43% 0.00     1336 pse_mutex+0xd00        page_trylock+0xbc
176555  14%  57% 0.00     1311 pse_mutex+0xd00        fsflush_do_pages+0x3b0
 77776   6%  64% 0.00    10409 0x300541ef648          cv_wait_sig_swap_core+0x94
 77544   6%  70% 0.00     3474 0x300542636a8          lwp_park+0x164
 66499   5%  75% 0.00    19609 0x300542aa268          lwp_unpark+0x4c
 47017   4%  79% 0.00     5092 0x600e062d940          clock_tick_execute_common+0xe8
 40597   3%  82% 0.00     5949 0x600e0693a00          clock_tick_execute_common+0x7c
 29577   2%  85% 0.00     1785 0x600e000bc80          task_cpu_time_incr+0x88
 25662   2%  87% 0.00     2065 0x600e0693a00          post_syscall+0x358
 16231   1%  88% 0.00    17574 lwpchanlock+0x3c00     lwp_mutex_wakeup+0x138
 12740   1%  89% 0.00    15292 lwpchanlock+0x3c00     lwp_mutex_timedlock+0x34c
 11432   1%  90% 0.00     1521 0x600e0038000          callout_schedule_1+0x120
  7849   1%  91% 0.00     1676 0x300022b9280          kmem_cache_alloc+0x64
  7134   1%  91% 0.00   165609 0x600e0628740          clock_tick_process+0x120
...
Generally, to reduce any kind of lock contention you have several ways:
- remove locks :-)
- split single lock to several independent locks (e.g. split data)
- reduce a concurrency level...
The last option is the most accessible in my case, avoiding rewriting of InnoDB + Solaris codes :-))
So, having innodb_thread_concurrency = 8 is already reduced a concurrency level from InnoDB part. What can we do with kernel? - just reduce number of CPU! - easy no? :-)) Hard to believe, but it's true :-) Most of applications having locking and scalability issues will run faster with fewer CPU :-))
Let's test?...
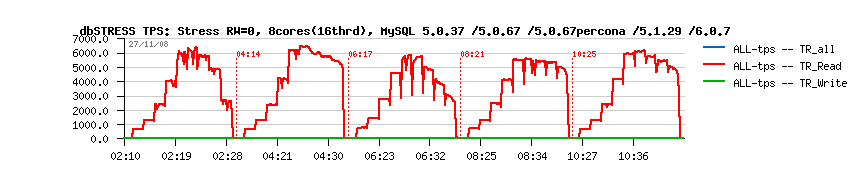
So, I just leaved 8 cores enabled on the system and restart my Stress test.
Stress Read-Only test with 8 cores
 |
|
Observations:
- 6500(!) TPS max comparing to the previous 4500 value!
- I still don't like decreasing TPS with increasing session number
|
Stress Read+Write test on 8 cores
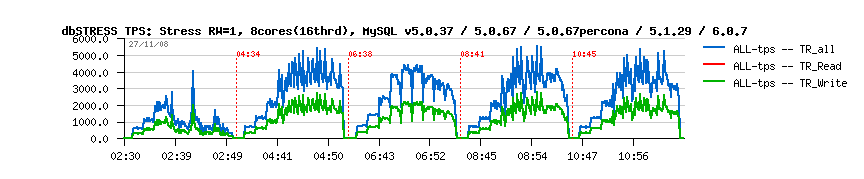 |
|
Observations:
- also higher TPS values!
- still don't like decreasing TPS with increasing session number...
|
|
Seeking for the Most Optimal Configuration
|
As you may see, with less CPU/sores I got a better performance level. But I'm still thinking it may be even better if I'll fine the most optimal pair between innodb_thread_concurrency value and CPU/cores number...
What I'm trying to do: while my max. TPS level is already better comparing to my initial 3500 value, I'll try now to find a most optimal parameters to keep my 256 concurrent sessions on the highest possible TPS, and then on my opinion it'll be my currently best possible configuration!
So, I've created a processor set on my server and start MySQL inside. Then adding or removing on-fly any CPU/core/threads to/from this processor set. As well changing innodb_thread_concurrency value in MySQL, and trying to get the best ration between CPU User and System time, and as final confirmation - TPS level on 256 concurrent sessions.
Here are my findings:
Configurations tested with Processor Set:
 ==========================================================================
   CPU Cores /Threads |  InnoDB Concurrency | CPU Usr% | CPU Sys% |   TPS
 ==========================================================================
       8 /8                       4               40%       12%      3,000
       8 /8                       8               66%       17%      4,500
       8 /8                      12               77%       20%      5,100
       8 /8                      16               78%       21%      5,000
       8 /16                     16               66%       23%      6,000 (!)
       8 /16                     20               67%       26%      5,300
       8 /16                     24               66%       28%      4,700
      16 /16                     16               56%       20%      4,300
 ==========================================================================
So, the best configuration seems to be:
- 8 cores, 16 threads (half of one SB)
- InnoDB concurrency = 16
And finally, without any processor set and just leaving only 2CPU on the system (via psradm) I've reached the same 6,500 TPS too!!!
However, during a real full test TPS level for 256 sessions was around 6.000 - so we should avoid to mix micro-test and full test expectations, even if the tuning model is right :-))
More in depth on 256 Sessions Testing...
Next step - I've tried next to see if InnoDB concurrency = 16 is still needed while the number of running concurrent threads is limited now by the system...
- 8 cores, 16 threads (half of one SB)
- InnoDB concurrency = 0
- CPU Usage: User 75%(!), System 20%
- TPS: 7,000 (!) - as user time increased we may expect better performance :-)
The question now: will MySQL still be able to keep 1600 active sessions with concurrency = 0 ...
And.. NO!.. - after 600 users wokload is explosing and TPS dropping to the near zero level...
Well, it's good to know :-)
And I'll restart a full test to get all details over a night test.
Summary: don't know why, but during a true test I don't see 7000 tps with 256 sessions anymore! :-)) Quite curious, but that's reality :-))
Finally, keeping InnoDB concurrency = 0 in production environment may be a very bad thing if workload level is unexpected...
|
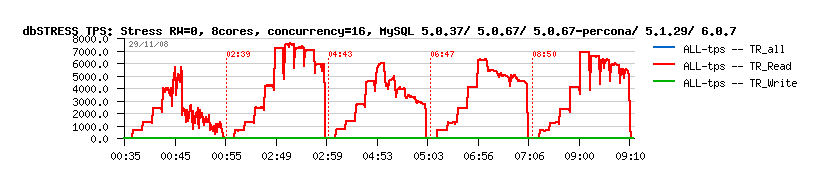
Stress Read-Only test with 8 cores and concurrency = 16
|
 |
|
Observations:
- whole TPS level is increased
- 6000 TPS for 256 sessions!
- quite interesting gap between MySQL versions :-))
- at least huge and visible progress comparing to MySQL 5.0.37 :-))
|
|
Restart ALL Tests with 8 cores
|
Optimal configuration:
- 2CPU (8 cores, 16 threads)
- innodb_thread_concurrency = 16
NOTE: I've also tried innodb_thread_concurrency = 0 within this configuration and all results where much more worse, as well 1600 Users Test did not work... So, having innodb_thread_concurrency != 0 seems to be much more secure for me :-))
|
Stress Test: 8 cores and innodb_thread_concurrency = 16
|
Stress Test: 8 cores and innodb_thread_concurrency = 16
|
1600 Users Test: 8 cores and innodb_thread_concurrency = 16
|
1600 Users Test: 8 cores and innodb_thread_concurrency = 16
|
Restart ALL Tests with FS cache disabled (Direct I/O)
|
Well, just to see at the end how well MySQL/InnoDB will work without any File System caching help (probably more close to the real life? it depends :-))
Tested configuration:
- UFS with forcedirectio,logging mount options
- 2CPU (8 cores, 16 threads)
- innodb_thread_concurrency = 16
- innodb_flush_log_at_trx_commit = 2 (as it's DIRECT all write system calls are guaranteed to be written to the storage)
 |
|
Not too bad, except due limited memory addressing (32bit) Percona patched MySQL was not able to compete having a 10x times smaller buffer cache.
|
|
Stress Test: USF Direct, 8 cores and innodb_thread_concurrency = 16
|
Stress Test: USF Direct, 8 cores and innodb_thread_concurrency = 16
|
1600 Users Test: USF Direct, 8 cores and innodb_thread_concurrency = 16
|
1600 Users Test: USF Direct, 8 cores and innodb_thread_concurrency = 16
|
And other MySQL Engines?..
|
Well, I did not test MYISAM, probably will see it next time...
However, I was very interested on:
- Falcon engine - seems to be very advanced, etc.
- PBXT engine - seems to be very attractive!
Both engines pretending to scale very well! But as always: idea is good, but implementation is most important! :-))
Few final words:
- Huge progress in MySQL performance comparing to the last year (with v.5.0.37/36)!
- Having innodb_thread_concurrency = 0 may be very dangerous! :-) Choose your value according your workload!
- RFE: add ISM Shared Memory support for MySQL cache buffers!
- Need to fix Solaris locking issue to work better with more CPU/cores!
- Percona patched MySQL code should be compiled in 64bit and tested more closely as there is many features not enabled by default and also needing a well understanding first! :-) Stay tuned! :-)
- Stay tuned on Falcon and PBXT! :-)