MySQL 5.5.6: IO-bound Read+Write workload @
| More in depth.. |
Seems there were several problems at once.. So, to understand one thing a time I'll try to split the issues and will keep the focus only on the Read-Only workload for the moment..Specially that it was a great post published by Mark Leith when between other interesting things he also mentioned that the use of the "btr_search_latch" may be completely disabled by setting innodb_adaptive_hash_index off.. - that was a good point and interesting option to try!! :-))
So, let's get a look now on the MySQL 5.5.6 performance on the Read-Only workload once the
was added to the my.conf file:innodb_adaptive_hash_index = 0
- so far, the load is growing from 1 to 256 users step by step (1,2,4,8,16,32,.. 256)
- on the left side the TPS level obtained while innodb_adaptive_hash_index = 1
- on the right side: innodb_adaptive_hash_index = 0
- as you can see, since 16 users TPS become lower in the second case, and since 32 users it's as twice as lower comparing to the performance with innodb_adaptive_hash_index = 1 ...
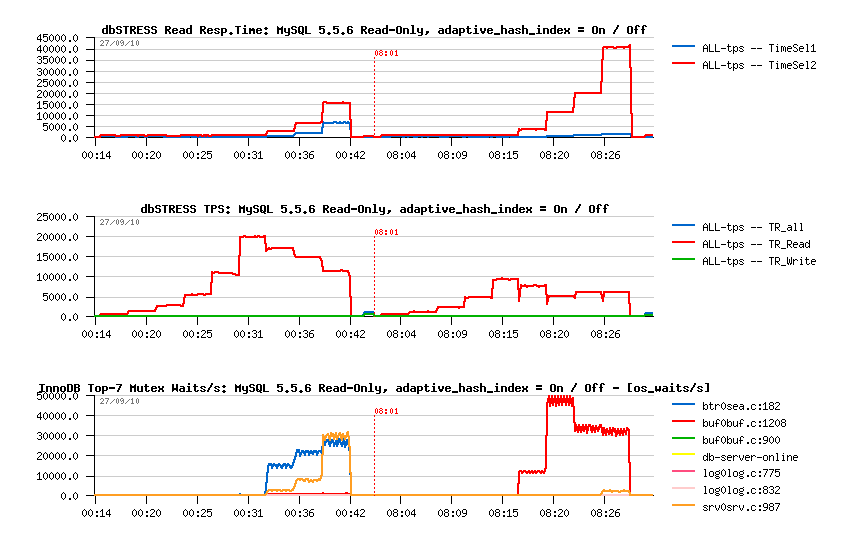
- same, left part of graphs is with innodb_adaptive_hash_index enabled, and the right part - with disabled..
- the first graph represents the response times for SEL1 and SEL2 (SELECT statements) and as you can see, curiously when the innodb_adaptive_hash_index is disabled the SEL2 response time growing too much while the SEL1 is still lower comparing to the case when the innodb_adaptive_hash_index is enabled!..
- the second graph represents TPS levels as before..
- and the third graph explains the source of the problem here - it represents the mutex waits reported by InnoDB during the growing workload and you may see that since innodb_adaptive_hash_index was disabled the contention from "btr_search_latch" and "kernel_mutex" was moved now to the Buffer Pool mutex!..
- use smaller database block for hot tables (fixed to 16K for InnoDB for the moment)
- sometimes even keep a huge free space inside of blocks to split per block-bound accesses (not applicable for InnoDB for the moment)
- and if the problem is coming from the cache latch - incrrease the number of these latches to several thousands within init.ora (will mean here over a thousand of Buffer Pool instances which is not applicable)..
| MySQL 5.5.6 Read-Only workload + innodb_adaptive_hash_index= 1 / 0 |
Observations :
Why?...
Let's get a more detailed view now..

| Detailed MySQL 5.5.6 Read-Only workload + innodb_adaptive_hash_index= 1 / 0 |
Observations :
How it's possible?.. - InnoDB Buffer Pool was supposed to be fixed already since MySQL 5.5.4, isn't it?..
Yes, the contention was fixed by splitting the mutex into several Buffer Pool Instances (so having several mutexes instead of a single one).. - and it works until your access to the data pages is less or more well distributed between Buffer Pool Instances.. - but what if the hottest pages will be loaded into the same Instance?.. - we'll once again obtain a single mutex for all these pages as before and the old fixed contention will come back to say "hello".. - it's exactly what's happening here!..
Let's get a look on the "MUTEX STATUS" output..
| Buffer Pool mutex contention |
As you can see from the following output the mutex waits are distributed between all Buffer Pool Instances, but there is one Instance (marked in bold) which is way hotter comparing to all others, and it's the main source of contention here:
mysql> show engine innodb mutex;
+--------+----------------------------+-------------------+
| Type   | Name                       | Status            |
+--------+----------------------------+-------------------+
| InnoDB | log/log0log.c:775          | os_waits=26       |
| InnoDB | log/log0log.c:771          | os_waits=1        |
| InnoDB | buf/buf0buf.c:1208         | os_waits=3219     |
| InnoDB | buf/buf0buf.c:1208         | os_waits=6990     |
| InnoDB | buf/buf0buf.c:1208         | os_waits=4619     |
| InnoDB | buf/buf0buf.c:1208         | os_waits=5627     |
| InnoDB | buf/buf0buf.c:1208         | os_waits=7873     |
| InnoDB | buf/buf0buf.c:1208         | os_waits=4466     |
| InnoDB | buf/buf0buf.c:1208         | os_waits=16929    |
| InnoDB | buf/buf0buf.c:1208         | os_waits=19305    |
| InnoDB | buf/buf0buf.c:1208         | os_waits=16301962 |
| InnoDB | buf/buf0buf.c:1208         | os_waits=11649    |
| InnoDB | buf/buf0buf.c:1208         | os_waits=950471   |
| InnoDB | buf/buf0buf.c:1208         | os_waits=6545     |
| InnoDB | buf/buf0buf.c:1208         | os_waits=4262     |
| InnoDB | buf/buf0buf.c:1208         | os_waits=5642     |
| InnoDB | buf/buf0buf.c:1208         | os_waits=7878     |
| InnoDB | buf/buf0buf.c:1208         | os_waits=387166   |
| InnoDB | fil/fil0fil.c:1559         | os_waits=1265     |
| InnoDB | srv/srv0srv.c:987          | os_waits=460452   |
| InnoDB | combined buf/buf0buf.c:900 | os_waits=38503    |
| InnoDB | log/log0log.c:832          | os_waits=184      |
| InnoDB | combined buf/buf0buf.c:901 | os_waits=77       |
+--------+----------------------------+-------------------+
23 rows in set (0.56 sec)

mysql>
Currently I've used 16 Instances (innodb_buffer_pool_instances=16), I've also tried with 64 but it did not change anything (and 64 is the max allowable setting as bigger value will make an overhead of the Buffer Pool management too high)..NOTE : the contention is coming not because several users are accessing the same data! - all users are still accessing different rows for sure, but they are just unlucky because the pages which became most accessed were loaded into the same Buffer Pool instance..
This problem is quite often observed during Oracle database benchmarks too.. The solutions which are applicable for Oracle RDBMS are:
So, the question is open and will need a fix.. - Probably a mix with hash table as it was tried for 5.4 prototypes?..
If you have any ideas - please, share! :-))
| Testing with only one SELECT (SEL1) in the READ Transaction |
On the same time I was also surprised to see a so huge difference in response time between two different SELECT statements on the previous graphs..So, I was curious to know which TPS level is possible to obtain if the READ transaction will be composed of only one SELECT at time and not both.. As SEL2 was slower, I wanted to see first the performance impact if the SEL2 will be not executed at all in the READ transaction.. - it required to modify the dbSTRESS script little bit, but the new result was very exciting :-))
Just to remind you, the SEL1 Query is a join of 3 tables and looks like:
where $REF is the random Object Reference..SELECT * from OBJECT O, SECTION S, ZONE Z WHERE S.REF = O.REF_SECTION and Z.REF = S.REF_ZONE and O.REF = '$REF' ;and the explain plan looks like:
mysql> EXPLAIN select * from OBJECT O, SECTION S, ZONE Z
where S.REF = O.REF_SECTION and Z.REF = S.REF_ZONE
and O.REF = '0000000001';

+----+-------------+-------+-------+-----------------+-----------------+---------+-------+------+-------+
| id | select_type | table | type  | possible_keys   | key             | key_len | ref   | rows | Extra |
+----+-------------+-------+-------+-----------------+-----------------+---------+-------+------+-------+
|  1 | SIMPLE      | O     | const | object_ref_idx  | object_ref_idx  | 10      | const |    1 |       |
|  1 | SIMPLE      | S     | const | section_ref_idx | section_ref_idx | 2       | const |    1 |       |
|  1 | SIMPLE      | Z     | const | zone_ref_idx    | zone_ref_idx    | 2       | const |    1 |       |
+----+-------------+-------+-------+-----------------+-----------------+---------+-------+------+-------+
3 rows in set (0.00 sec)

mysql>
Let's get a look on the Read-Only workload:
- #1 - base config, O_DIRECT=off, innodb_adaptive_hash_index=0
- #2 - base config, O_DIRECT=off, innodb_adaptive_hash_index=1
- #3 - base config, O_DIRECT=on, innodb_adaptive_hash_index=1
- #4 - base config, O_DIRECT=on, innodb_adaptive_hash_index=1, innodb_thread_concurrency=32
- Honestly, it's hard to say if we're not limited by the number of CPU cores here ;-)) because contentions are starting since 64 users and 32 cores is probably simply not enough ;-))
- Interesting that the "kernel_mutex" is coming on the first position under this workload and we don't see any "btr_search_latch" here..
- As well, limiting the InnoDB thread concurrency to 32 we obtaining a much more stable result with a high number of users (and usually is what we expecting from this parameter :-)) - seems for this workload it works well..
- SEL1 response time remains the same on the first workloads as on the Read-Only, which is great! :-))
- interesting that using here innodb_adaptive_hash_index=1 is slightly lowering performance level..
- using O_DIRECT is slightly lowering performance too..
- while limiting InnoDB thread concurrency is lowering UPDATE response time which is resulting in a higher overall performance with a higher number of concurrent users!.. (on the same time it's surprisingly increasing the time of the SEL1 query, so the final result is not as good as expected, but still better than without any concurrency limit)..
- main contention is on the "kernel_mutex"..
- since innodb_adaptive_hash_index is enabled the waits on the "btr_search_latch" become visible too, but remain minor..
- periodic "furious flushing" is happening during the workload..
- limiting InnoDB thread concurrency is reducing the "kernel_mutex" contention..
- it's hard to say who is the winner here, but first 2 configurations seem to perform better than the next ones :-)
- using O_DIRECT seems to reduce SEL1 time, but dramatically increase the time of UPDATE on the higher loads - I was quite surprised to see it here as I expected to see performance improvement by using O_DIRECT within a Read+Write workload rather a degradation..
- limiting InnoDB thread concurrency make things worse here (probably mainly because the code is not aware when an active user/session involving an I/O operation and still keep other threads waiting too..)
- main contention is on the "kernel_mutex"..
- since innodb_adaptive_hash_index is enabled the waits on the "btr_search_latch" become visible too, but hard to say if it dominates any time because the waits are reporting the number of waits and not the time waited -- need a Performance Schema here to understand better..
- there is NO periodic "furious flushing" during the workload! - as users are also occupied by doing I/O operations the load is less aggressive here (however the overall TPS is kept similar to the In-Memory workload due good performance of SSD disks)..
- limiting InnoDB thread concurrency is reducing all mutex waits (as expected) - but don't bring TPS stability (this one was not expected)...
- RW=0 -- Read-Only (SEL1)
- RW=1 -- Read+Write (SEL1+UPDATE)
- fdsync -- O_DIRECT is off
- direct -- O_DIRECT is on
- ccr0 -- InnoDB thread concurrency=0
- ccr32 -- InnoDB thread concurrency=32
- ahi0 -- innodb_adaptive_hash_index=0
- ahi1 -- innodb_adaptive_hash_index=1
- RW=0 SEL1 InMem MySQL-556-ccr0-fdsync-ahi0
- RW=1 SEL1 InMem MySQL-556-ccr0-fdsync-ahi0
- RW=0 SEL1 IO-bound MySQL-556-ccr0-fdsync-ahi0
- RW=1 SEL1 IO-bound MySQL-556-ccr0-fdsync-ahi0
- RW=0 SEL1 InMem MySQL-556-ccr0-fdsync-ahi1
- RW=1 SEL1 InMem MySQL-556-ccr0-fdsync-ahi1
- RW=0 SEL1 IO-bound MySQL-556-ccr0-fdsync-ahi1
- RW=1 SEL1 IO-bound MySQL-556-ccr0-fdsync-ahi1
- RW=0 SEL1 InMem MySQL-556-ccr0-direct-ahi1
- RW=1 SEL1 InMem MySQL-556-ccr0-direct-ahi1
- RW=0 SEL1 IO-bound MySQL-556-ccr0-direct-ahi1
- RW=1 SEL1 IO-bound MySQL-556-ccr0-direct-ahi1
- RW=0 SEL1 InMem MySQL-556-ccr32-direct-ahi1
- RW=1 SEL1 InMem MySQL-556-ccr32-direct-ahi1
- RW=0 SEL1 IO-bound MySQL-556-ccr32-direct-ahi1
- RW=1 SEL1 IO-bound MySQL-556-ccr32-direct-ahi1
| MySQL 5.5.6 Read-Only workload with SEL1 |
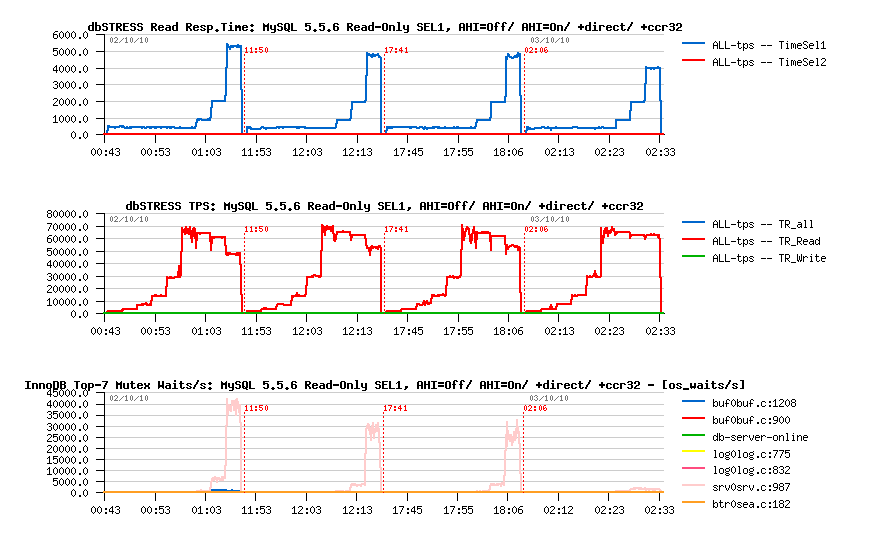
Before even I'll say you anything, you've probably already noted over 70.000 max TPS level! - x3.5 times higher comparing to the previously seen 20.000 TPS (but well, there were 2 SELECTs within a single transaction, so 40.000 SELECT/sec in fact :-)) Of course SEL1 query is more simple than SEL2, but it's still a join from 3 tables! - so on the simpler SELECT(s) you should obtain even better results :-) But well, let me give you details about the presented graphs:
First of all, I've tested here 4 different configurations:
All configurations were tested exactly in the presented order, so you may recognize each workload from 4 parts on the graphs from the left to right..
Observations :
Anyway, I was still curious what is the mutex waits summary at the end of the test?..
-
InnoDB Mutex Waits on Read-Only with SEL1
mysql> show engine innodb mutex;
+--------+----------------------------+------------------+
| Type   | Name                       | Status           |
+--------+----------------------------+------------------+
| InnoDB | log/log0log.c:775          | os_waits=43      |
| InnoDB | log/log0log.c:771          | os_waits=1       |
| InnoDB | buf/buf0buf.c:1208         | os_waits=348     |
| InnoDB | buf/buf0buf.c:1208         | os_waits=375     |
| InnoDB | buf/buf0buf.c:1208         | os_waits=303     |
| InnoDB | buf/buf0buf.c:1208         | os_waits=396     |
| InnoDB | buf/buf0buf.c:1208         | os_waits=357     |
| InnoDB | buf/buf0buf.c:1208         | os_waits=327     |
| InnoDB | buf/buf0buf.c:1208         | os_waits=129430  |
| InnoDB | buf/buf0buf.c:1208         | os_waits=97077   |
| InnoDB | buf/buf0buf.c:1208         | os_waits=319     |
| InnoDB | buf/buf0buf.c:1208         | os_waits=94375   |
| InnoDB | buf/buf0buf.c:1208         | os_waits=334     |
| InnoDB | buf/buf0buf.c:1208         | os_waits=15000   |
| InnoDB | buf/buf0buf.c:1208         | os_waits=313     |
| InnoDB | buf/buf0buf.c:1208         | os_waits=329     |
| InnoDB | buf/buf0buf.c:1208         | os_waits=363     |
| InnoDB | buf/buf0buf.c:1208         | os_waits=9844    |
| InnoDB | fil/fil0fil.c:1559         | os_waits=41      |
| InnoDB | srv/srv0srv.c:990          | os_waits=3       |
| InnoDB | srv/srv0srv.c:987          | os_waits=8140973 |
| InnoDB | combined buf/buf0buf.c:900 | os_waits=7925    |
| InnoDB | log/log0log.c:832          | os_waits=281     |
| InnoDB | combined buf/buf0buf.c:901 | os_waits=6       |
+--------+----------------------------+------------------+
24 rows in set (0.25 sec)

mysql>
As you can see, even the "kernel_mutex" (srv/srv0srv.c:987) is still the most awaited, there are still some Buffer Pool Instances which are more hot then other.. - It means that once the "kernel_mutex" contention will be fixed, we'll be probably blocked by the Buffer Pool mutex again..
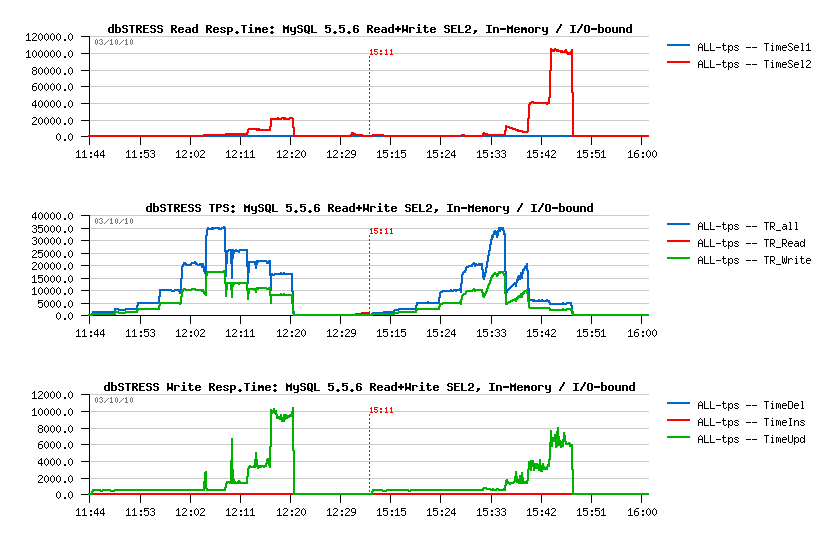
| MySQL 5.5.6 Read+Write with SEL1+UPDATE -- In Memory workload |
Same 4 different workloads here as on Read-Only before, but data are fitting into the Buffer Pool (In Memory workload).
-
MySQL 5.5.6 Read+Write with SEL1+UPDATE, In Memory workload - TPS & Resp.Time
MySQL 5.5.6 Read+Write with SEL1+UPDATE, In Memory workload - TPS & Mutex Waits
Observations :
And what about mutex waits?..

Observations :
Well, how it changes when the workload become I/O-bound ?..

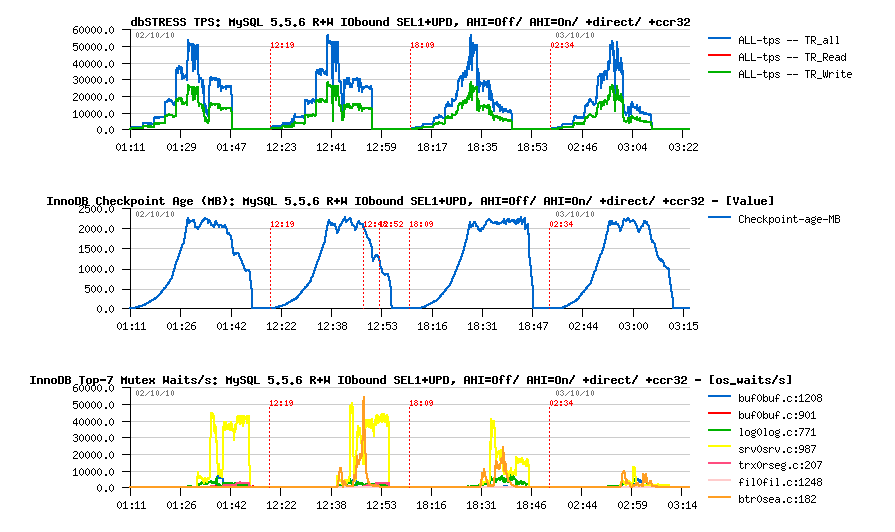
| MySQL 5.5.6 Read+Write with SEL1+UPDATE -- I/O-bound workload |
Same 4 different workloads here as before, but the accessed data are no more fitting into the Buffer Pool (I/O-bound workload).
-
MySQL 5.5.6 Read+Write with SEL1+UPDATE, I/O-bound workload - TPS & Resp.Time
MySQL 5.5.6 Read+Write with SEL1+UPDATE, I/O-bound workload - TPS & Mutex Waits
Observations :
And mutex waits?..

Observations -- quite similar to the In-Memory workload, but with some differences:
| Detailed STATs for the tested workloads |
Used abbreviations:
Detailed STAT graphs:
Detailed STATs for the tested workloads
| Testing with another one SELECT (SEL2) in the READ Transaction |
So far, what will be changed now if instead of the SEL1 I'll execute only the SEL2 in the READ transaction?..SEL2 Query is a join of 2 tables and looks like:
mysql> explain
SELECT * from HISTORY H, STAT S where ref_object = '0000000001' and ref_stat = ref;

+----+-------------+-------+--------+-----------------+-----------------+---------+---------------------+------+-------------+
| id | select_type | table | type   | possible_keys   | key             | key_len | ref                 | rows | Extra       |
+----+-------------+-------+--------+-----------------+-----------------+---------+---------------------+------+-------------+
|  1 | SIMPLE      | H     | ref    | history_ref_idx | history_ref_idx | 10      | const               |   20 | Using where |
|  1 | SIMPLE      | S     | eq_ref | stat_ref_idx    | stat_ref_idx    | 3       | dbstress.H.REF_STAT |    1 |             |
+----+-------------+-------+--------+-----------------+-----------------+---------+---------------------+------+-------------+
2 rows in set (0.00 sec)

mysql>
where ref_object is chosen randomly as in the SEL1.
- innodb_adaptive_hash_index=1 -- as without this setting we saw that SEL2 hitting the Buffer Pool mutex contention and performance become even worse..
- innodb_thread_concurrency=0 -- I want first to see how far it's able to scale here..
- O_DIRECT -- using direct here to be compatible with previously obtained results on dbSTRESS..
- "btr_search_latch" seems to be the main performance killer here..
- as well on the all previous dbSTRESS results seems that the TPS level was in many cases driven by performance of the SEL2..
- Looks like the SEL2 response time plays the main factor here..
- "btr_search_latch" is killing SEL2..
- "kernel_mutex" is killing UPDATE on the higher load..
| Test configuration |
Keeping in mind previous results, the following configuration setting was used:
Both In-Memory and I/O-bound workloads are tested.
| MySQL 5.5.6 Read-Only workload with SEL2 |
Observations :

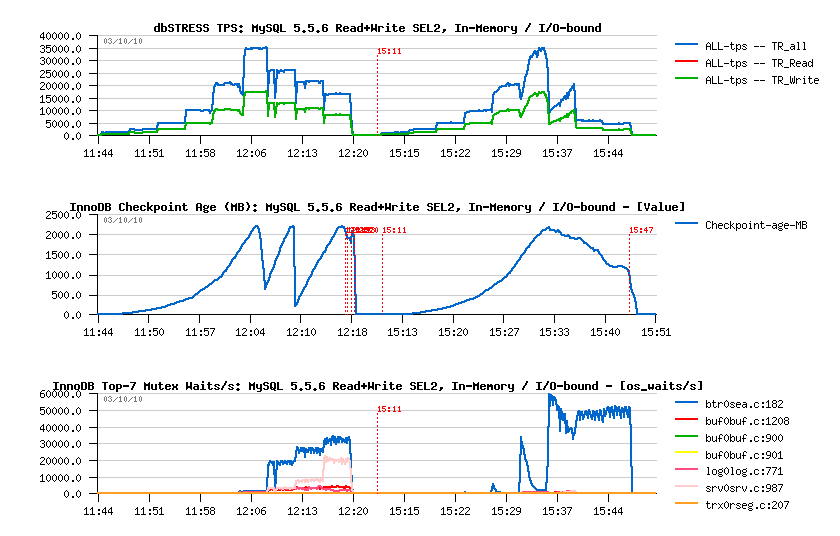
| MySQL 5.5.6 Read+Write with SEL2+UPDATE - TPS & Resp.Time |
| MySQL 5.5.6 Read+Write with SEL2+UPDATE - TPS & Mutex Waits |
Observations :
But well, seems main issue is around of the SEL2, and I'm interesting now what is limiting this query to go faster - which is resulting probably in understanding what kind of query is limited by "btr_search_latch" and which are not.. - for ex. curiously SEL1 is not hitting "btr_search_latch" contention..
| Analizing SEL2 Query variations.. |
What is so special in the SEL2 query?.. I'd say - really nothing! :-)Well, let's split it into several variations to better understand what going on ;-)
Initial query:
SELECT *
 FROM HISTORY H, STAT S
 WHERE ref_object = '$REF'
   AND ref_stat = ref;
Query Execution:
- the "ref_object" is a primary key in the HISTORY table
- HISTORY table contains 20 records per each ref_object value, so these 20 records are fetched directly by the primary key
- then for each fetched record we fetch a corresponding STAT record
- there is no index on the "ref_stat" column in the HISTORY table, so the whole record should be fetched first to get the "ref_stat" value, and then fetch the corresponding STAT record by its "ref" primary key..
Now - I'm curious to see how if *any* similar kind of query will hit contention on the "btr_search_latch" mutex or not.. - Let me present you the result first, and then explain other test details:
- 3 tests were blocked by "btr_search_latch" waits as before and reaching 20.000 TPS max..
- 5 other tests were mainly limited by waits on the Buffer Pool mutex and "kernel_mutex", and reached 40.000(!) TPS max - wow, 2 times higher!..
- and the one test which was mainly blocked by "kernel_mutex" waits and reached 80.000 (!) TPS.. - WOW! - again 2 times higher (or x4 times comparing to the initial level)..
- #1) initial query code:
 SELECT * FROM HISTORY, STAT
  WHERE ref_object = '$REF' AND ref_stat = ref;
- #2) changed to print few columns:
 SELECT ref_object,ref,horder FROM HISTORY, STAT
  WHERE ref_object = '$REF' AND ref_stat = ref;
- #3) changed to count(*):
 SELECT count(*) FROM HISTORY, STAT
  WHERE ref_object = '$REF' AND ref_stat = ref;
- #4) select star:
 SELECT * FROM HISTORY, STAT
  WHERE ref_object = '$REF' AND ref_stat = ref AND ref_stat = 1 ;
- #5) select count:
 SELECT count(*) FROM HISTORY, STAT
  WHERE ref_object = '$REF' AND ref_stat = ref AND ref_stat = 1 ;
- #6) select star:
 SELECT * FROM HISTORY
  WHERE ref_object = '$REF' ;
- #7) select count:
 SELECT count(*) FROM HISTORY
  WHERE ref_object = '$REF' ;
- #8) select single star:
 SELECT * FROM HISTORY
  WHERE ref_object = '$REF' AND ref_stat = 1 ;
- #9) select single count:
 SELECT count(*) FROM HISTORY
  WHERE ref_object = '$REF' AND ref_stat = 1 ;
| dbSTRESS SEL2 Query variations, Read-Only In-Memory Workload |
So far, here are two graphs representing 9 tests executed one after other. The first graph is reporting TPS, and the second one - InnoDB mutex waits.. Even without knowing what was exactly executed you may already realize that:
So, what are the differences between those tests?.. ;-))
First 3 tests : are checking the impact of the column list in SELECT .. FROM
As you see from TPS graphs, none of these changes has any impact on the result..
Next 2 tests : limited to a single record result from the same join
Curiously limiting the criteria to a single output record gave a x2 times higher max TPS level!.. - and what is interesting that "btr_search_latch" contention is gone! - the contention is moved now to the Buffer Pool mutex and "kernel_mutex" !!.. - on the same time, as there is no index on the "ref_stat" column, InnoDB still need to read all 20 records corresponding to the "ref_object" value and find the row having "ref_stat = 1" - so the main difference here in the execution process is that only one STAT record will be fetched here instead of 20 as before.. - And to be sure of this I'll replay now the same queries but using only HISTORY table.
Next 4 tests : running similar queries but only using HISTORY table
Between these 4 tests only the #7 test is making a difference here - just because InnoDB don't need to read rows to give the count(*) result, reading the "ref_object" index is enough and max TPS is resulting in 80.000! :-) All other queries will still involve the reading of all 20 records..
Then the things are changing once the workload become I/O-bound.

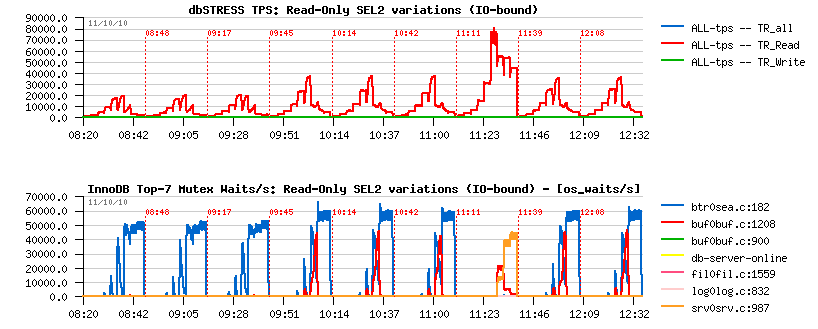
| dbSTRESS SEL2 Query variations, Read-Only IO-bound Workload |
Seems since the workload become I/O bound the contention is seating well on the "btr_search_latch".. - the only exception is again on the case #7 when the SELECT count(*) reading is coming from indexes and not involving data reading.. NOTE: I/O-bound is not really meaning there is a lot of I/O operations, your data may be successfully cached by the filesystem! - but since they cannot fit the Buffer Pool and the page move management should be involved the contention on the "btr_search_latch" become so hot (and it means it'll be probably hot for *any* read-only or read+write OLTP workload where the data are not fitting the InnoDB Buffer Pool (please, share your observations!!))..
And what if we disable adaptive hash index now?.. - As you can see from the following graphs, performance become even worse!..
| dbSTRESS SEL2 Query variations, Read-Only In-Memory Workload, AHI=OFF |
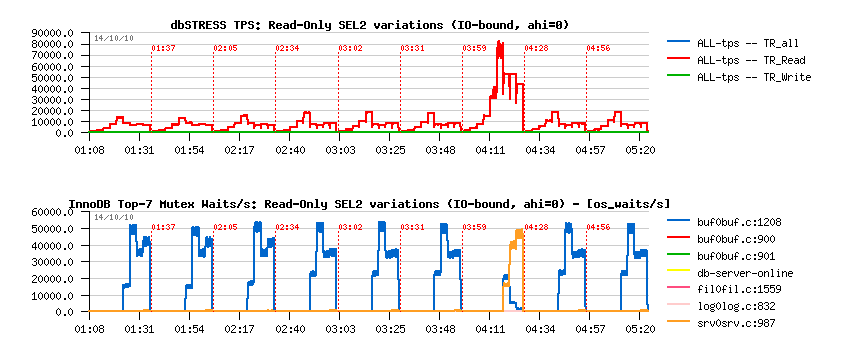
Same tests, but now with: innodb_adaptive_hash_index = 0As you can see, performance become even worse except for the #7 test, but this one did not involve any contention on the "btr_search_latch" even before..
And on the I/O-bound workload things are not better either:

| dbSTRESS SEL2 Query variations, Read-Only IO-bound Workload, AHI=OFF |
| Adding an INDEX on HISTORY(ref_object,ref_stat) |
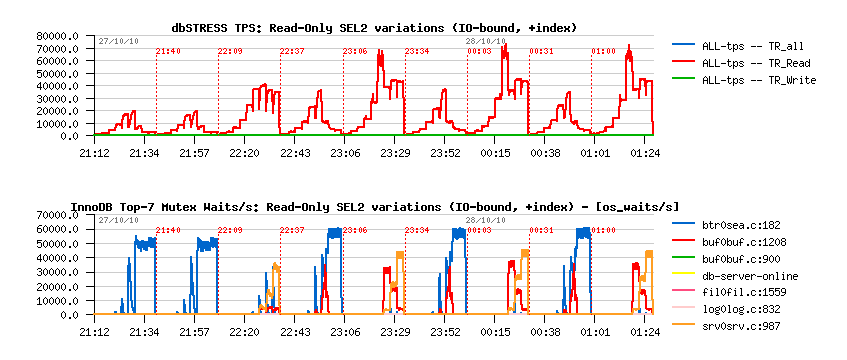
To finish this part of SEL2 query variations, I was curious if contentions will be changed if I'll create an index on the (ref_object,ref_stat) pair in HISTORY table - in this case all queries having additional "ref_stat = 1" criteria should fetch only one corresponding row instead of 20..Curiously, the real improvement came only on the "SELECT count(*)" variations as it fetch all needed infrmation from the indexes only now.. - On the same time the query having the highest max TPS result before (80.000 TPS) now reached only 70.000 TPS..
Another interesting point - on some workloads you may see how the presense of waits on the "kernel_mutex" reducing the waits on the Buffer Pool mutex and improves performance finally!.. - I'm very curious what kind of problems we'll meet if once the "kernel_mutex" will be splitted.. ;-))
The result graphs are here:
-
dbSTRESS SEL2 Query variations, Read-Only In-Memory Workload, +INDEX
dbSTRESS SEL2 Query variations, Read-Only IO-bound Workload, +INDEX

| Analyzing Buffer Pool Mutex contention |
On the same time I was surprised by the presence of contention on the Buffer Pool mutex and wanted to see more in depth if there are any "simple" way to avoid it, for ex:
- use more Buffer Pool Instances (currently 64 max possible in MySQL 5.5)..
- use smaller Buffer Pool, so have less pages within the same BP Instance and probably split locks via more than one Instance..
- then check if the things are not better once there are Writes mixed to Reads..
- Read transaction: represented by SELECT from HISTORY where ref_object = '$REF';
- Write transaction: UPDATE only statements by ref_object
- Read/Write ratio: 1, 2, 3, 10
- less UPDATE(s) are mixed to SELECT(s) - lower is performance :-)
- overall performance is really driven by SELECT statements..
- kernel_mutex, buffer pool mutex and btr_search_latch are the main killers..
| InnoDB Mutex Status with SEL2 HISTORY-only + 64bp |
Having 64 Buffer Pool Instances is not helping either - even if waits are present on the "kernel_mutex" and "btr_search_latch", there is still only one BP Instance become way hotter than all others:mysql> show engine innodb mutex; +--------+----------------------------+------------------+ | Type | Name | Status | +--------+----------------------------+------------------+ | InnoDB | log/log0log.c:775 | os_waits=1051 | | InnoDB | buf/buf0buf.c:1208 | os_waits=641 | | InnoDB | buf/buf0buf.c:1208 | os_waits=524 | | InnoDB | buf/buf0buf.c:1208 | os_waits=927 | | InnoDB | buf/buf0buf.c:1208 | os_waits=30764 | | InnoDB | buf/buf0buf.c:1208 | os_waits=703461 | | InnoDB | buf/buf0buf.c:1208 | os_waits=233 | | InnoDB | buf/buf0buf.c:1208 | os_waits=3045 | | InnoDB | buf/buf0buf.c:1208 | os_waits=550 | | InnoDB | buf/buf0buf.c:1208 | os_waits=206 | | InnoDB | buf/buf0buf.c:1208 | os_waits=3288 | | InnoDB | buf/buf0buf.c:1208 | os_waits=241 | | InnoDB | buf/buf0buf.c:1208 | os_waits=21631 | | InnoDB | buf/buf0buf.c:1208 | os_waits=440 | | InnoDB | buf/buf0buf.c:1208 | os_waits=260 | | InnoDB | buf/buf0buf.c:1208 | os_waits=1378 | | InnoDB | buf/buf0buf.c:1208 | os_waits=74040 | | InnoDB | buf/buf0buf.c:1208 | os_waits=498 | ... | InnoDB | buf/buf0buf.c:1208 | os_waits=824 | | InnoDB | buf/buf0buf.c:1208 | os_waits=228 | | InnoDB | buf/buf0buf.c:1208 | os_waits=292 | | InnoDB | buf/buf0buf.c:1208 | os_waits=9701683 | | InnoDB | buf/buf0buf.c:1208 | os_waits=871 | | InnoDB | buf/buf0buf.c:1208 | os_waits=643 | | InnoDB | buf/buf0buf.c:1208 | os_waits=212 | | InnoDB | buf/buf0buf.c:1208 | os_waits=542 | | InnoDB | buf/buf0buf.c:1208 | os_waits=857 | | InnoDB | fil/fil0fil.c:1559 | os_waits=378 | | InnoDB | srv/srv0srv.c:990 | os_waits=4 | | InnoDB | srv/srv0srv.c:987 | os_waits=3842680 | | InnoDB | combined buf/buf0buf.c:900 | os_waits=128721 | | InnoDB | log/log0log.c:832 | os_waits=169 | | InnoDB | btr/btr0sea.c:182 | os_waits=5195893 | | InnoDB | combined buf/buf0buf.c:901 | os_waits=68 | +--------+----------------------------+------------------+ 72 rows in set (0.17 sec) mysql>
| InnoDB Mutex Status with SEL2 - 1600M BP, ahi=0 |
Having a smaller Buffer Pool (1600M) forced a wider split of data, so instead of one Buffer Pool mutex contention we have two now - but it doesn't improve performance due additional overhead coming from page management (smaller buffer cannot keep all data cached)..mysql> show engine innodb mutex; +--------+----------------------------+-------------------+ | Type | Name | Status | +--------+----------------------------+-------------------+ | InnoDB | log/log0log.c:775 | os_waits=60 | | InnoDB | log/log0log.c:771 | os_waits=3 | | InnoDB | buf/buf0buf.c:1208 | os_waits=21041 | | InnoDB | buf/buf0buf.c:1208 | os_waits=38807 | | InnoDB | buf/buf0buf.c:1208 | os_waits=26045 | | InnoDB | buf/buf0buf.c:1208 | os_waits=30798 | | InnoDB | buf/buf0buf.c:1208 | os_waits=40403 | | InnoDB | buf/buf0buf.c:1208 | os_waits=24841 | | InnoDB | buf/buf0buf.c:1208 | os_waits=37915 | | InnoDB | buf/buf0buf.c:1208 | os_waits=47253 | | InnoDB | buf/buf0buf.c:1208 | os_waits=28717845 | | InnoDB | buf/buf0buf.c:1208 | os_waits=27379 | | InnoDB | buf/buf0buf.c:1208 | os_waits=17293479 | | InnoDB | buf/buf0buf.c:1208 | os_waits=27396 | | InnoDB | buf/buf0buf.c:1208 | os_waits=20034 | | InnoDB | buf/buf0buf.c:1208 | os_waits=31427 | | InnoDB | buf/buf0buf.c:1208 | os_waits=118630 | | InnoDB | buf/buf0buf.c:1208 | os_waits=1378253 | | InnoDB | fil/fil0fil.c:1559 | os_waits=14861 | | InnoDB | srv/srv0srv.c:990 | os_waits=6 | | InnoDB | srv/srv0srv.c:987 | os_waits=291878 | | InnoDB | combined buf/buf0buf.c:900 | os_waits=142610 | | InnoDB | log/log0log.c:832 | os_waits=462 | | InnoDB | combined buf/buf0buf.c:901 | os_waits=288 | +--------+----------------------------+-------------------+ 24 rows in set (0.02 sec) mysql>And if "innodb_adaptive_hash_index" is enabled, performance is killed by contention on the "btr_search_latch" due a huge page move on a such small Buffer Pool..
| dbSTRESS SEL2+UPDATE, In Memory Workload |
Here is the results from the Read+Write test with the following conditions:
As you can see:
But what's important : the contention on the Buffer Pool mutex is less critical since your reads are mixed with writes in InnoDB!..
And on IO-bound?..

| dbSTRESS SEL2+UPDATE, IO-bound Workload |
Scalability on the IO-bound workload is still killed by the contention on the "btr_latch_search" mutex.. - However, it needs to be verified also via MySQL Performance Schema to be sure nothing else is hidden here by observed waits ;-))
