by Dimitri SSC Team, 2009 Sun Microsystems Inc. |
Benchmark Information |
Customer Name(s): SSCNDA: no
Contact Information:
- dimitri (@) sun (.) com
Dates: Feb.2009
Keywords: MySQL, MySQL PerfVersion, InnoDB, Percona, XtraDB, db_STRESS
Hardware Configuration |
Server(s):
- M8000: 16CPU SPARC64-VI 2200Mhz bi-core bi-thread, 256GB RAM, 2x HBA FC-port 2Gbit
Storage:
- ST6140: 2x LUNs (RAID1 1TB each), 2Gb Fiber Channel connection, each LUN is connected by its own fiber channel to the server
Software Configuration |
System:
- Solaris 10 update 6
- UFS
Application(s):
- MySQL v.5.1.30 64bit
- db_STRESS
Abstract |
Overview: Recently Sun/MySQL Perf Project announced a probe release of the very first MySQL Perf version code. New features are experimental, but looked promising and solving performance problems slightly differently comparing to others... So, I absolutely wanted to try it and see how well it'll keep a db_STRESS workload comparing to default InnoDB plugin, as well previously tested XtraDB engine.Goal(s):
- Compare Perf version vs other InnoDB "variants"
- Check new scalability limits
- Find if any new way to improve performance again
Result(s): - see SUMMARY :-)
Preparation |
db_STRESS test scenarios will be still the same (for details get a look at http://dimitrik.free.fr/db_STRESS_BMK_2008.html#note_5220 )However redo logs will be placed on the separated LUN of the storage box (as it was done on the final configuration of XtraDB testing (see: http://dimitrik.free.fr/db_STRESS_BMK_XtraDB_Percona_2009.html )
Compiling in 64bit with SS12 (Sun Studio 12) |
As previously with XtraDB:$ bash $ export CC=/opt/SS12/bin/cc $ export CXX=/opt/SS12/bin/CC $ export CFLAGS="-m64 -xO3" $ export CXXFLAGS="-m64 -xO3" $ export LDFLAGS="-lmtmalloc" $ ./configure --prefix=/apps/mysql --with-plugins=innobase,myisam --enable-dtrace=no ... $ gmake ... $ gmake install ...NOTE: there were some problems to compile with dtrace probes enabled, so I disabled dtrace on configure...
Initial my.conf |
My initial config file for Perf version:
[mysqld] max_connections=2000 key_buffer_size=200M low_priority_updates=1 sort_buffer_size = 2097152 table_open_cache = 8000# files innodb_file_per_table innodb_log_group_home_dir=/DATA2/REDO innodb_log_file_size=128M
# buffers innodb_buffer_pool_size=8000M innodb_additional_mem_pool_size=20M innodb_log_buffer_size=8M
# tune innodb_checksums=0 innodb_doublewrite=0 innodb_support_xa=0 innodb_thread_concurrency = 16 innodb_flush_log_at_trx_commit=2 innodb_flush_method= O_DIRECT innodb_max_dirty_pages_pct=15
# Perf "special" innodb_io_capacity = 2000 innodb_read_io_threads = 16 innodb_write_io_threads = 16
Probe Test |
From the first probe test the result on the read-only workload is absolutely exciting! - Perf version is easily outpassing InnoDB plugin as well XtraDB by 50% !!On the same time more investigation seems to me will be needed on the read+write load...
Read-Only Probe Stress Test: XtraDB vs Perf |
Observations:
- 9,000 TPS max for Perf version
- 6,100 TPS max for XtraDB (from previous tests on this machine)
- Perf version easily outpassing XtraDB! (and default InnoDB as well)
Read+Write Probe Stress Test: XtraDB vs Perf |
Observations:
- On first steps Perf versions performs better vs XtraDB
- Then since 4 concurrent sessions performance level is suddenly dropping down...
- Where is the problem?..
- More in depth investigation is needed here...
Investigating on Read+Write performance... |
Analyzing more in details probe read+write tests, I was surprised to see better result within a "cold" run comparing to the "warm" one (means with cold and worm InnoDB cache)...Until now, to avoid any I/O and other external "secondary effects" in comparing test results, I've executed all tests in the following order:
- restart MySQL server to free buffer cache
- run "cold" read-only (RW=0) test with empty cache
- run "cold" read+write (RW=1) test with zero dirty pages
- run "warm" read-only (RW=0) test with partially filled cache
- run "warm" read+write (RW=1) test with partially filled cache
- ...
As usually "warm" tests presented better results, I always used only them to compare engines... But in this case "cold" is outperformed "warm", how?...
Read+Write Probe Stress Test: XtraDB vs Perf -- COLD RUN! |
Observations:
- on "cold" run Perf outpassing XtraDB
- Perf "cold" result is much better and way stable comparing to "warm"
- need more details...
So, what is the problem?.. |
After long and detailed analyzes of previous results with XtraDB comparing to the current tests with Perf version I found a strong dependency (thanks to InnoDB Stats Add-On @dim_STAT I may collect live all available stats from InnoDB and easily graph them for each test):
- all previous tests used total buffer pool size = 8GB
- during all previous tests 8GB was a big enough amount of RAM to finish "warm" read+write test still having non-empty list of free buffers!
- Perf version writes much more faster! and using buffer pool more quickly!
- for unknown reasons for me (probably according design?), but even flushed dirty pages are not coming back into free buffers list, so once it's empty - it'll remain empty all next time before next reboot of MySQL server...
- once there is no more free buffers performance is dramatically dropping down!...
- all previous tests with XtraDB and InnoDB plugin were measured with non-empty free buffers
- to be compatible, the same condition should be respected for Perf version...
Seems I need to retest them all again :-)
New Performance Test |
To reach a common "Compatible Base" for all tested InnoDB variations there are at least 2 straight forward solutions:Increase execution time of each read+write test:
- (+) free buffers will be out in all cases on longer test
- (-) still no guaranty it'll generate the same conditions :-)
- (-) but also global execution time will be increased...
Vary size of buffer pool:
- and I prefere this one, even it'll still generate more work again :-)
- my idea is to replay all tests again with buffer pool = 6GB and 12GB
- 12GB pool will give enough space to run all tests still having free pages
- 6GB will force all tests to run without free buffers for sure and in the same bad conditions
- comparing performance impact between 12G and 6G buffers may give new ideas for further optimizations ;-)
Let's test?..
Buffer Pool = 12G |
All tests are running with a big enough number of free buffers.
Perf version is outperforming all other candidates!
Read-Only Stress Test @Pool=12G: Perf vs XtraDB vs InnoDB |
Observations:
- Perf version is a true winner! :-)
- near 100% gain comparing to the default InnoDB plugin!
Read+Write (RW=1) Stress Test @Pool=12G: Perf vs XtraDB vs InnoDB |
Observations:
- Perf version is still a strong winner here even TPS gap is not so important as on read-only workload :-)
- NOTE: RW=1 means there is one write transaction for every read
Read+Write (RW=10) Stress Test @Pool=12G: Perf vs XtraDB vs InnoDB |
Observations:
- Perf version is still a strong winner here!
- TPS gap is mostly seen due better response time on read operations on Perf version
- NOTE: RW=10 means there is one write transaction for every 10 reads
Buffer Pool = 6G |
All tests are running with buffere pool out of free buffers (except read-only workload, so no need to present again)
Read+Write (RW=1) Stress Test @Pool=6G: Perf vs XtraDB vs InnoDB |
Perf version is only partially outperforming all other candidates here, then with higher load it's more equal and comparing with XtraDB..
Read+Write (RW=10) Stress Test @Pool=6G: Perf vs XtraDB vs InnoDB |
However, on RW=10 ratio Perf version is still making a huge performance gap due its more efficient concurrency management which decreasing significantly read transaction response time.
Free Buffers Impact |
Analyzing more and more in depth I may summarize now my observations on free buffer impact:
- note1: all read+write tests are running with innodb_flush_log_at_trx_commit=2
- note2: disk storage is not even 100% busy, there is no truly storage-related I/O bottleneck
- however severe performance drop is observing one buffer pool is out of free pages
- all "classic" explanations of this degradation I've found are saying "it's normal - once buffer is out of free pages, engine is starting to flush dirty pages to make a room, and usually it's meeting I/O bottleneck and performance is dropping..."
- according my observations it's not really true:
- there is no increased I/O write operations (they even decreasing)
- storage box is not overloaded...
- HOWEVER: the read I/O operations come back!!
- and on my understanding what's going here:
- instead to flush dirty pages, engine removes cache pages!
- which is resulting in physical read from disk (probably mostly random)
- random read here will be much more costly then writes! (storage has a write cache protected by battery)
- and I think these reads here is the main source of performance degradation!
Read+Write (RW=1) Stress Test Perf version: impact 12G vs 6G pool |
Read+Write (RW=1) Stress Test XtraDB: impact 12G vs 6G pool |
Some other observations |
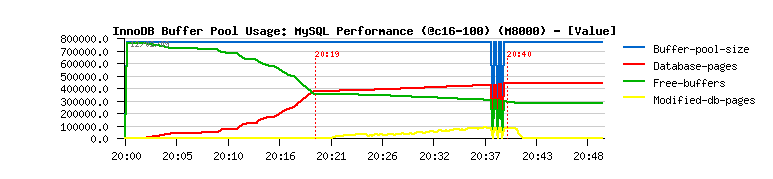
More about the "free buffer issue". I think there is a wrong logic somewhere (probably a bug or something is missing in design, etc.) - I know it sounds strange, but let's think together:
- initially buffer pool is free (800.000 pages)
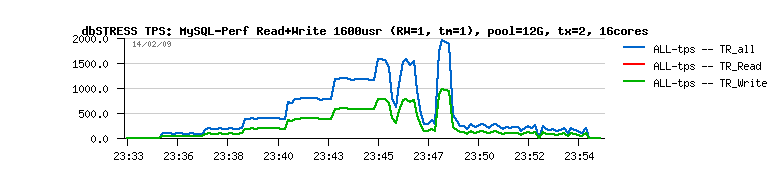
 (see graph above)
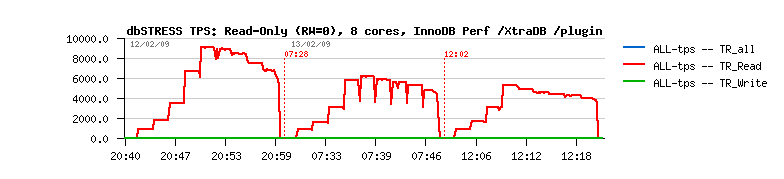
- after 20min of read-only activity 50% of buffer space is used to cache data; no reads anymore from the disk; reached max performance (database-pages = 400.000 pages)
- now writes are added to reads:
- modified-db-pages value is increasing with growing workload (up to 100.000 pages)
- free-buffers value is decreasing nearly proportional
- database-pages value is slightly increasing
- once load is finished:
- dirty pages are fully flushed
- modified-db-pages value is going to zero
- free-buffers value is remaining the same
- database-pages value is remaining the same too
- I still may accept "modified-db-pages" is just a marker, and once it set to zero it doesn't mean it'll free any buffers, etc. Why not, even the increased value of database-pages is not completely matching the gap, BUT! During my workload mostly the same pages are modified all the time! So, whatever happening it should become stable with time, no?.. However, if I repeat the same read+write load 2 or 3 times again - I'm out of free buffers!
- On my feeling, there is something wrong going with buffer management generally and probably garbage is not removed on time (or something going wrong with counters?)
How do you explain it?..
Honestly, today's the most big I/O problem for any database will be a random read . We have tons of solution to optimize log writes and any writes generally, but there is nothing to optimize random read except to keep in in the database cache! otherwise you have to really read data from the storage and it's the most long I/O operation you may request just because the storage box has exactly the same problem! :-))
Now:
- innodb buffer is out of free buffers
- getting free pages by removing some data from the "read cache" is the most worse idea here...
- it brings new random reads and killing global TPS level (5ms read is killing comparing to 0.2ms writes)
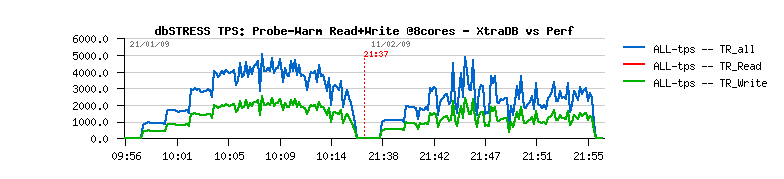
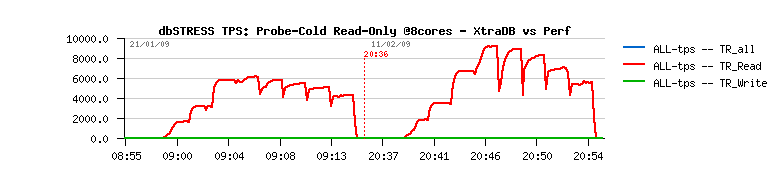
As you may see from graphs, stable 5,000 TPS vs ~avg 3,000 TPS is a huge difference!
Probably we may try an option here saying "I prefer to flush harder and keep my cache worm"? (what is innodb_max_dirty_pages have to do normally, but it's not a case)... - and again, there is seems to be something to do with a "priority" of pages to be removed...
Any ideas?..
InnoDB Concurrency Management |
Due high number of locks, having a concurrency limit within InnoDB is a good thing (see: http://dimitrik.free.fr/db_STRESS_BMK_2008.html#note_5231 )On the same time all InnoDB concurrency implementations are only taking care about "internal contentions" and forgetting about "external" factors:
- the default concurrency model is pretty well explained here: http://www.mysqlperformanceblog.com/2006/06/05/innodb-thread-concurrency/
- Perf version avoiding mutexes and based on self-sleeps-timers (Mikael may explain it in details much more better then anyone :-))
- but all models anyway seems to do not take care about waits for external events
- from my observations, any thread being "active" is not removed from "active list" when it's doing physical read from disk!
- that's why active and waiting on read thread are breaking performance level and blocking other threads to work...
- it's clearly seen on read-only workload with a "cold" buffer cache
- on the same time with innodb thread concurrency = 0 there is no performance "jumps"
Probably I need to give here more details about performance "jumps" :-)
Let's take an example:
- Let's say we have already 16 concurrent sessions running and reading from the database; over a time most of the data is sitting in the buffer pool (probably it's a very optimistic case, but let's keep it), and our innodb thread concurrency = 16
- Now 16 new concurrent sessions arriving and starting to read too; buffer pool is plenty free yet, so new sessions have enough space to cache their data;
- What may we expect in this situation: - Avg response time may increase due high initial resp.times for the new sessions - TPS level should stay at least the same as all "old" sessions are reading from cache and should not get any penalty from the "new" ones
- Instead TPS level is dramatically dropping down... (The same situation is observed with XtraDB as well original InnoDB plugin.) - and only with time it's increasing and reaching expecting level...
- NOTE: it's not happening if concurrency = 0 (but there are other problems with 0 :-))
- I'm pretty sure if thread starting disk read() will be placed off from the active list - it should improve global performance a lot!
What do you think?..
Example of COLD Read-Only Test: XtraDB vs Perf version |
Test 1600 Users |
1600 users test is more likely a "weakness test":
- number of concurrent sessions is growing with time
- each session is sleepping 1 sec. between transactions
- ideally all 1600 users should get their processing time
- on read-only workload it's ok with limited innodb concurrency (1600TPS reached at the end)
- on read+write the load is twice higher and it's quite hard to obtain 3200TPS at the end
- however, some engines are performing here better comparing to other...
- XtraDB seems to be the most stable here!
- Perf version is loosing for the moment...
- Concurrency management is still needed to be improved
- As read-only workload performs even better at 16 cores with Perf version, I've tried to see if having more cores may help here: as you may see it's even worse...
Well, there is still a room for improvement! and let's take it as a challenge :-)
Test 1600 Users Read+Write (RW=1): InnoDB default @8cores |
Test 1600 Users Read+Write (RW=1): XtraDB @8cores |
Test 1600 Users Read+Write (RW=1): Perf version @8cores |
Test 1600 Users Read+Write (RW=1): Perf version @16cores |
All Test Details |
Here you may find more detailed information about all previously described tests.Some notes:
- see InnoDB CPU Usage: Perf version having the smaller Sys% CPU usage!
- Perf version has less spin locks
- InnoDB Log Writes/sec is quite impressive in some cases (and give you a real idea what you have to expect from your storage once innodb_flush_log_at_trx_commit will be set to 1 :-))
- 24 cores is seems to be too much for the moment :-)
- redo logs are placed into the separated storage LUN, so you may easily see the level of I/O activity on the data and redo logs.
STATs Tests 12G Pool, 8 cores, tx=2 |
STATs Tests 12G Pool, 8 cores, tx=2
- [2009-02-12 21:40] TEST dbSTRESS RW=0 Stress MySQL 5.1.30-Perf
- [2009-02-12 22:01] TEST dbSTRESS RW=1 Stress MySQL 5.1.30-Perf
- [2009-02-12 22:21] TEST dbSTRESS RW=10 Stress MySQL 5.1.30-Perf
- [2009-02-12 22:41] TEST dbSTRESS RW=1000 Stress MySQL 5.1.30-Perf
- [2009-02-13 08:28] TEST dbSTRESS RW=0 Stress MySQL 5.1.30-XtraDB
- [2009-02-13 08:48] TEST dbSTRESS RW=1 Stress MySQL 5.1.30-XtraDB
- [2009-02-13 09:09] TEST dbSTRESS RW=10 Stress MySQL 5.1.30-XtraDB
- [2009-02-13 09:29] TEST dbSTRESS RW=1000 Stress MySQL 5.1.30-XtraDB
- [2009-02-13 13:02] TEST dbSTRESS RW=0 Stress MySQL 5.1.30-plugin
- [2009-02-13 13:22] TEST dbSTRESS RW=1 Stress MySQL 5.1.30-plugin
- [2009-02-13 13:42] TEST dbSTRESS RW=10 Stress MySQL 5.1.30-plugin
- [2009-02-13 14:03] TEST dbSTRESS RW=1000 Stress MySQL 5.1.30-plugin
- [2009-02-14 16:49] TEST dbSTRESS RW=0 1600usr Test MySQL 5.1.30-Perf
- [2009-02-14 17:12] TEST dbSTRESS RW=1 1600usr Test MySQL 5.1.30-Perf
- [2009-02-14 17:34] TEST dbSTRESS RW=10 1600usr Test MySQL 5.1.30-Perf
STATs Tests 6G Pool, 8 cores, tx=2 |
STATs Tests 6G Pool, 8 cores, tx=2
- [2009-02-13 00:26] TEST dbSTRESS RW=0 Stress MySQL 5.1.30-Perf
- [2009-02-13 01:07] TEST dbSTRESS RW=10 Stress MySQL 5.1.30-Perf
- [2009-02-13 10:50] TEST dbSTRESS RW=0 Stress MySQL 5.1.30-XtraDB
- [2009-02-13 11:31] TEST dbSTRESS RW=10 Stress MySQL 5.1.30-XtraDB
- [2009-02-13 15:15] TEST dbSTRESS RW=0 Stress MySQL 5.1.30-plugin
- [2009-02-13 15:56] TEST dbSTRESS RW=10 Stress MySQL 5.1.30-plugin
STATs Tests with 16/24 cores, and concurrency= 16/32 |
STATs Tests with 16 cores
- [2009-02-13 18:06] TEST dbSTRESS RW=0 Stress 16cores MySQL 5.1.30-Perf
- [2009-02-13 18:26] TEST dbSTRESS RW=1 Stress 16cores MySQL 5.1.30-Perf
- [2009-02-13 18:46] TEST dbSTRESS RW=10 Stress 16cores MySQL 5.1.30-Perf
- [2009-02-13 19:07] TEST dbSTRESS RW=1000 Stress 16cores MySQL 5.1.30-Perf
- [2009-02-13 20:16] TEST dbSTRESS RW=0 Stress 16cores conc=32 MySQL 5.1.30-Perf
- [2009-02-13 20:36] TEST dbSTRESS RW=1 Stress 16cores conc=32 MySQL 5.1.30-Perf
- [2009-02-13 20:56] TEST dbSTRESS RW=10 Stress 16cores conc=32 MySQL 5.1.30-Perf
- [2009-02-13 21:17] TEST dbSTRESS RW=1000 Stress 16cores conc=32 MySQL 5.1.30-Perf
- [2009-02-13 22:26] TEST dbSTRESS RW=0 Stress 24cores conc=32 MySQL 5.1.30-Perf
- [2009-02-13 22:46] TEST dbSTRESS RW=1 Stress 24cores conc=32 MySQL 5.1.30-Perf
- [2009-02-13 23:06] TEST dbSTRESS RW=10 Stress 24cores conc=32 MySQL 5.1.30-Perf
- [2009-02-13 23:27] TEST dbSTRESS RW=1000 Stress 24cores conc=32 MySQL 5.1.30-Perf
SUMMARY |
Results:Positive:
- NOTE: XtraDB was already better comparing to default InnoDB plugin (see: http://dimitrik.free.fr/db_STRESS_BMK_XtraDB_Percona_2009.html#note_5316 )
- Perf version outpass XtraDB by 50% on read-only workload at 8 cores!
- Perf version outpass XtraDB by 20% on read+write workload at 8 cores!
- On 16 cores Perf version continues to increase performance while XtraDB and default InnoDB are dramatically dropping down! (x2-3 times slower)
- On 16 cores and read-only workload Perf version is twice(!) better comparing to XtraDB on 8 cores!
Negative:
- Perf version is not keeping workload on Test 1600 users (while it's less a problem for XtraDB and InnoDB) - enabling default concurrency management (available via my.conf option) may be used as a workaround in this case for the moment...
Need to investigate:
- Free buffers impact is quite severe - need to investigate why cached pages are removed prior (or instead) to flush dirty pages (or probably flushing is not going fast enough?? - on the same time storage is not used fully yet)..
- Concurrency model should be improved to keep 1600 users at least as well as default InnoDB engine.
- Concurrent throughput may be improved a lot if active thread starting a read() from disk will remove itself before from the "active list" and back to the queue - read operation takes much more time comparing to reading from cache, and it may unlock another thread waiting for CPU time.