| Read-Only @8cores |

| Read-Only @16cores |
| Read-Only @32cores |
|
by Dimitri SSC Team, 2009 Sun Microsystems Inc. |
| Benchmark Information |
Customer Name(s): SSC TeamNDA: no
Contact Information:
- dimitri (at) sun.comDates: May.2009
Keywords: PostgreSQL 8.3.7, PostgreSQL 8.4, MySQL, dbSTRESS
| Hardware Configuration |
Server(s):
- M5000 8CPU SPARC64-VII (quad-core bi-thread) 2400Mhz, 64GB RAM, 2x FC-port 4GbitStorage:
- ST6140 2x LUN (500GB RAID1 8HD), each LUN connected by its own fiber channel to the host
| Software Configuration |
System:
- Solaris 10 update6
- UFSApplication(s):
- PostgreSQL 8.3.7
- PostgreSQL 8.4 beta1
- db_STRESS (injector)
| Abstract |
Overview: During my recent MySQL testing I was curious to see how well performing PostgreSQL on the same workload. Two years on the same test case PostgreSQL was two times faster comparing to MySQL. Now, for my big surprise, it was two time slower then MySQL 5.4. Of course MySQL 5.4 made a huge step in performance improvement, but there were several signs for me - something goes wrong with PostgreSQL... So I've planned to retest it again an go more in depth to understand observed performance difference.Goal(s):
- Understand why PostgreSQL was slower vs MySQL 5.4
- Improve whenever possible PostgreSQL performance
- Evaluate PostgreSQL performance on 8/ 16/ 32 cores @dbSTRESS workload
Result(s): see summary :-)
| Special THANKS!!! |
My SPECIAL THANKS to Simon Riggs (don't hesitate to visit http://2ndquadrant.com if you meet any problem with PostgreSQL! :-)), Scott Carey , Merlin Moncure , Kevin Grittner , Greg Smith (check http://www.westnet.com/~gsmith/content/postgresql/ it may already contain an answer :-)), and many many others from pgsql-performance mail list for their patience and valuable help in improving PostgreSQL performance. Here are links to discussions:Discussions @PgSQL-Performance :
As well some other useful links :
- Checkpoints and the Background Writer
- Tuning PostgreSQL Wiki
- PostgreSQL & DTrace
- PostgreSQL Monitoring & Stats
| Benchmark details |
My intention is to replay exactly the same tests as in my previous report but on the newest M5000 (quad core) server. So I'll skip all previously made explanations about db_STRESS tests and scenario and go directly to the action.NOTE: All PostgreSQL binaries are compiled with GCC 4.3.2 in 64bit, with CCFLAGS="-O3".
NOTE: Initially I kept the same buffer pool = 12GB as MySQL. As PostgreSQL is delegating its read cache to the filesystem too it'll be more than enough (and as you may see from workload graphs there is practically no disk access during Read-Only tests).
NOTE: most of tests were run with a second thread enabled on each CPU core. To put attention on this point I add a mention about number of core threads on used labels. For example 8cores become 8cores(2) (or cores=8(2) for ex.) if both threads were activated on each core. Otherwise 8cores remaining only 8 cores were active with only one thread. Also, when test is "executed on N cores" it means PostgreSQL is running within a processor set of N cores, so it cannot use more than N cores for its processing and nobody else may use its cores from its processor set.
PostgreSQL 8.4 config @
| First impressions |
If on Read+Write workload we may discuss about differences on transactions integrity between PostgreSQL and MySQL and it may be long (even if InnoDB nowdays gives the same security level). So I've concentrated my analyze first on the Read-Only workload.Observations :
- Generally 8.4 version is more performant than 8.3.7, good point for development team!
- On all my test workloads PostgreSQL delivering a very stable performance !
- Curiously on 8 cores 8.4 is running slower comparing to 8.3.7, strange...
- Since 16 cores 8.4 is way faster than 8.3.7 !
- PostgreSQL 8.3.7 is scaling badly on my test: small performance gain (20%) on move from 8 to 16 cores, and no gain at all on move to 32 cores...
- PostgreSQL 8.4 is scaling much more better: true performance gain (~100%) on move from 8 to 16 cores, and there is still a gain of ~40% on move to 32 cores!
To be honest , I should not consider too much my results on 32 cores as injector processes are running on the same server and may bring some background effects on the database engine. But injectors are using less than 20% CPU and as PostgreSQL is still continuing to improve performance here I present them anyway: specially it gives a good example of performance improvement done within 8.4 version, as well it presents the best result reached by PostgreSQL on this server - 11.000 TPS on the Read-Only workload.
| Read-Only @8cores |
| Read-Only @16cores |
| Read-Only @32cores |
| So, WHY PostgrSQL is slower than MySQL 5.4 ?... |
But! Even on fully used 32 cores 8.4 is still delivering only 11.000 max TPS, while MySQL 5.4 showing 17.500 TPS with InnoDB on 16 cores! (Again, to be honest , we have to keep in mind that MySQL will not do better on 32 cores as its current scalability is limited to 16 for the moment. But on the same time even we may expect two times better PostgreSQL performance on two times more CPU cores it's still hard to justify a use of 64 cores server to do the same thing as MySQL is delivering on 16 cores). So, that's why it's important anyway what is going wrong here if any...
| The Main Problem |
From my point of view the main problem here is a query execution time comparing to MySQL. As you may see from the benchmark description there are 2 SELECT queries executed during each Read-Only transaction. The first select is running very fast in most cases. However the second one is usually taking more an more time with growing workload.SELECT-2 execution time:
- MySQL 5.4 : 0.44ms
- PostgreSQL 8.4 : 1.5ms
- PostgreSQL 8.3.7 : 2.5ms
Even if this query is executed extremely fast, it's still 2-3 times slower comparing to MySQL!
| Response times difference between 8.3 and 8.4 |
Due this twice better response time PostgreSQL 8.4 is outpassing 8.3.7 I think. And it's still unclear what was a scalability limit for 8.3.7 on 16 and 32 cores, because with a stable response time it should deliver a much more higher performance. But as you see, response time is growing too, and before to look about any scalability improvement it'll be better to see first if there is any way to run this query faster!
| Query Execution Plan |
Query SELECT-2 :select S.REF as stref, S.NAME as stnm, H.HORDER as hord, H.BEGIN_DATE as hbeg,
H.END_DATE as hend, H.NOTE as hnote
from HISTORY H, STAT S
where S.REF = H.REF_STAT
and H.REF_OBJECT = '0000000001'
order by H.HORDER ;Initial query execution plan :
 Sort  (cost=4411.42..4417.24 rows=2329 width=176) (actual time=1.501..1.505 rows=20 loops=1)

     Sort Key: h.horder

     Sort Method:  quicksort  Memory: 30kB

     ->  Hash Join  (cost=33.50..4281.16 rows=2329 width=176) (actual time=1.333..1.365 rows=20 loops=1)

           Hash Cond: (h.ref_stat = s.ref)

           ->  Index Scan using history_ref_idx on history h  (cost=0.00..4215.64 rows=2329 width=135) (actual time=0.029..0.038 rows=20 loops=1)

                 Index Cond: (ref_object = '0000000001'::bpchar)

           ->  Hash  (cost=21.00..21.00 rows=1000 width=45) (actual time=1.208..1.208 rows=1000 loops=1)

                 ->  Seq Scan on stat s  (cost=0.00..21.00 rows=1000 width=45) (actual time=0.006..0.317 rows=1000 loops=1)
 Total runtime: 1.698 ms
(10 rows)
Few comments :
- Within a current configuration this query is running fully in RAM and its execution time depends only on PostgreSQL internals
- CHAR keys are used in database schema to reflect an alphanumeric code needs
- VARCHAR is not used because the code length is supposed to be fixed for all objects in database
- HISTORY table contains 200M rows
- SELECT-2 query result should give 20 rows
- don't know why a planner estimate it should retrieve 23029 rows from HISTORY table
- ANALYZE with statistics_target = 1000 is reducing this estimate to 244 rows, but changing nothing on plan or execution time
| Possible Plan optimizations |
Current plan :
- execution time : 1.5ms
- with removed "order by" clause : 1.19ms
- select count(*) instead of columns and with removed "order by" : 0.98ms
Option : Disable Seq Scan
- result: planner replaces seq. scan by index scan in this case
- execution time: 1.53ms, it takes even more time on execution
Option : Prepare statement
- replacing a query by: prepare history_stat(char(10)) as ... and H.REF_OBJECT = $1 ...
- then execute as: execute history_stat('0000000001');
- execution time: 0.98ms
- NOTE: but "prepare" statement itself took 16ms, so if we suppose a query body may be absolutely random, we cannot accept this option.. (but will test it anyway to evaluate the gain)
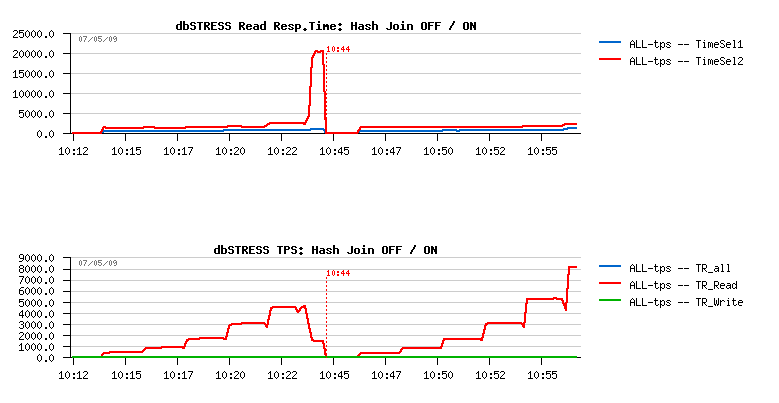
Option : Disable Hash Join
- result: planner replaced hash join is replaced by merge join
- execution time: 0.84ms !
- NOTE: curiously planner is expecting to execute this query in 0.29ms - so it's supposed from its logic to be faster, so why this plan is not used from the beginning???...
 Sort  (cost=4562.83..4568.66 rows=2329 width=176) (actual time=0.237..0.237 rows=20 loops=1)

     Sort Key: h.horder

     Sort Method:  quicksort  Memory: 30kB

     ->  Merge Join  (cost=4345.89..4432.58 rows=2329 width=176) (actual time=0.065..0.216 rows=20 loops=1)

           Merge Cond: (s.ref = h.ref_stat)

           ->  Index Scan using stat_ref_idx on stat s  (cost=0.00..49.25 rows=1000 width=45) (actual time=0.018..0.089 rows=193 loops=1)

           ->  Sort  (cost=4345.89..4351.72 rows=2329 width=135) (actual time=0.042..0.043 rows=20 loops=1)

                 Sort Key: h.ref_stat

                 Sort Method:  quicksort  Memory: 30kB

                 ->  Index Scan using history_ref_idx on history h  (cost=0.00..4215.64 rows=2329 width=135) (actual time=0.012..0.025 rows=20 loops=1)

                       Index Cond: (ref_object = '0000000001'::bpchar)
 Total runtime: 0.288 ms
(12 rows)
Seems disabling hash join is the most trivial option to test (still need to understand what is the most optimal way to force planner to use it), but for testing even using a global hashjoin disabled is enough.
Curiously there was no gain on throughput, and even worse - after 32 concurrent sessions the response time is jumped up which is killed at once database performance (as you may see on the graph below)...
| My feeling |
Seems to me:
- there is a some kind of "internal cost" per query in PostgreSQL
- this cost was reduced in 8.4 version, but it's still present
- of course 1ms is a very small value, but for very fast queries it'll be important!
- of course if each your query is doing at least one I/O read it become much less important
- on the same time, once you optimized your platform to do less or very few I/O - you'll still be limited by this kind of cost...
| And I was near to finish my report... |
I was near to finish my report here, but few things were still questioning my mind :
- Why 8.4 was slower comparing to 8.3.7 on 8 cores?...
- On my previous tests on the old M8000 server with CPU frequency 2200Mhz the MAX Read-Only result on 8.3.7 was better than now on 2400Mhz CPUs (6.500 TPS vs current 6.000 TPS)... What is wrong here?...
Comparing various workload graphs, I discovered that response time was better in some cases then other...
Moving step by step back in my investigations and removing option by option I finally found the only thing which may bring some unexpected changes: default_statistics_target !... - playing with this parameter and trying to obtain the most optimal execution plan I left 8.3.7 database with tables analyzed with target 1000 and continued my tests. While the first results on 8 cores were obtained with a default target - 20 !!!
Let's check now :
- set default_statistics_target = 1000; analyze ...
- response time on 8.3.7 : 3ms
- response time on 8.4 : 2.7ms
- set default_statistics_target = 5; analyze ...
- response time on 8.3.7 : 1.3ms
- response time on 8.4 : 1.2ms
Bingo!!! :-))
So on 8cores 8.4 was slower comparing to 8.3.7 just because the default value of default_statistics_target on 8.4 is 100 while it's 20 on 8.3.7!!! Who may imagine it'll make a negative difference???...
Let's replay the same tests once more but with default_statistics_target = 5 and tables re-analyzed, and compare them again! :-))
Observations :
- version 8.3.7 has now similar results as 8.4 - the difference is gone !!!
- most of the results are improved by ~20% !!!
| Improving Read+Write workload stability |
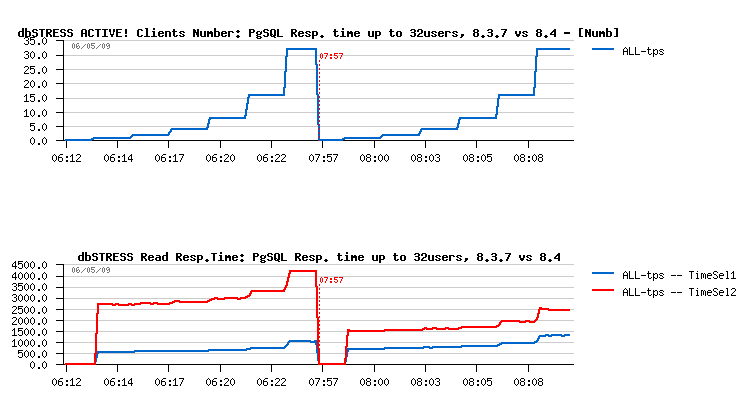
Now, once SELECT time was greatly improved, another issue should be fixed - current performance on the Read+Write workload is not very stable. Checkpoint is involved currently every 5 minutes and seems an important volume of data should to be flushed within a short period of time. So aggressive write "waves" are resulting in TPS "waves" and should be avoided whenever possible in production environment (for ex.)
| Example of Read+Write TPS |
| Possible solutions |
The most classic solution to reduce checkpoint impact on performance is simply to reduce checkpoint timeout - it will involve checkpoint more often, and as during a shorter period there will be less modified data - less pages will be needed to flush, so checkpoint itself will be shorter. Of course it'll not completely remove a checkpoint impact, but it'll be shorter and lighter.But PostgreSQL has some more interesting otions :-)
- you may adapt background writer setting to be less or more aggressive
- since 8.3 there is an excellent checkpoint_completion_target option!
In short the idea is instead to flush all modified data at once on checkpoint, the database engine receiving a time credit to finish the whole required data flushing. The checkpoint_completion_target is set from 0.0 to 1.0 and represents the time ratio you leave to your database server to finish checkpoint before the next checkpoint arrives. For ex. with checkpoint_completion_target=0.8 and checkpoint interval 5min it means you leave 4min for your database to finish its checkpoint completely. Is there any danger for data - absolutely no, as all changes on marked for checkpoint and not yet flushed pages are still kept in WAL, so you don't loose then in case of crash..
You may find a lot of more details from PostgreSQL documentation as well an excellent Checkpoints and the Background Writer guide written by Greg Smith.
| Tested configurations |
Being curious, I've tested several parameter configurations to see the impact of the each one. At the end I've tested the same workload scenarios but with using PREPARE/EXECUTE statements to clarify the last hidden points. Each test config was labeled to be identified, and here is the mean of each label:Few notes about labeling
pgsql-8.4 :
- initial setting
- shared_buffers = 12000MB
- checkpoint_timeout = 5min
- default_statistics_target = 100 (default)
pgsql-8.4-ana5 :
- default_statistics_target = 5
- all other the same
pgsql-8.4-chp30 :
- default_statistics_target = 5
- checkpoint_timeout = 30s
- all other the same
pgsql-8.4-buf256 :
- default_statistics_target = 5
- checkpoint_timeout = 30s
- shared_buffers = 256MB
- all other the same
pgsql-8.4-buf1024 :
- default_statistics_target = 5
- checkpoint_timeout = 30s
- checkpoint_completion_target = 0.8
- shared_buffers = 1024MB
- bgwriter_lru_maxpages = 1000
- bgwriter_lru_multiplier = 4.0
- all other the same
pgsql-8.4-buf4096 :
- default_statistics_target = 5
- checkpoint_timeout = 120s
- checkpoint_completion_target = 0.8
- shared_buffers = 4096MB
- temp_buffers = 20MB
- bgwriter_lru_maxpages = 1000
- bgwriter_lru_multiplier = 4.0
- all other the same
pgsql-8.4-prep :
- all the same as pgsql-8.4-buf4096
- but with prepared statements!
| Observations |
Buffer pool size - supposed to impact directly checkpoint time as a bigger buffer pool will contain more pages to scan. On the same time I observed also an important impact on Read-Only workload. Despite it, but performance was better with a 4GB buffer rather suggested 256-512MB.. Finally knowing initially observed TPS limit on Read-Only, I tried to find the most optimal value for both Read-Only and Read+Write workloads. And 4096MB gave me the best result.Checkpoint interval - 2min was the most reasonable (30s was too short, and 5min was too much) - I keep here in mind a recovery time needed to be planned in case of the system or hardware crash. So 30s (the smallest possible with PG) is too stressful for database, but 5min is too much as potention recovery (it may be way longer than 5 minutes). And 2 minutes was just enough to satisfy both.
checkpoint_completion_target - 0.8 was the most optimal value to keep stable writing and good performance level.
PREPARE/EXECUTE statements - is the most optimal way, of course, to speed-up your queries. I did not use it intentionally as I wanted to test a database in condition supposing there may be any kind of query, automatically generated by application for example, etc. But at the end I've tested also a prepared statements to evaluate a planer cost impact. However you have to keep in mind:
- PREPARE statement has a cost (16ms in my case), so if you use it only once per session - it will be faster to execute a 2ms query as it, without preparing
- there is an interesting solution proposed by Dimitri Fontaine to bypass this limit and reuse already prepared by other sessions statements: README.html and pre-prepare repository
- Prepared statement is no more sensible to the default or any other analyze target as those data are only used during prepare phase, and no more used during query execution!
- in my case prepared statements were executed faster (normal), but still not as fast as it's doing MySQL/InnoDB...
Read-Only @16cores, PostgreSQL 8.4
Read+Write @8cores, PostgreSQL 8.4
Read+Write @16cores, PostgreSQL 8.4
| Scalability issue |
Scalability issue is remaining a question without answer for the moment... If on the Read+Write workload it may be easily delegated to the limitations of the storage box, on the Read-Only workload there is no really any limitations coming from a hardware. All needed data are kept in memory, no disk access, no network..Comments & Observations :
- the MAX troughput scalability between 8 and 16 cores is near linear
- on the same time 16 concurrent sessions are running only slighter faster on 16 cores comparing to 8 (!)
- then 32 sessions are running even slower on 32 cores than on 16 (!)
- supposing some possible timer/scheduling synchronization issues I also retest it on 24cores, and 32 sessions are running faster that time than on 16cores (so need to investigate yet), but even on isolated 24cores the result is only slightly better, far from expecting 50% improvement...
- DTrace tracing did not bring in evidence any hot locks for the moment..
- Seems to me a complete profiling will help here, but it'll be next time and with a more big server :-)
Scalability @Read-Only Workload, config pgsql-8.4beta1-prep
DTrace on wait locks
Here is a DTrace output on looking for any lock waits during a 10sec interval:# lwlock_wait_8.4.d `pgrep -n postgres`
Lock Id Mode Count FirstBufMappingLock Exclusive 1
FirstLockMgrLock Exclusive 1
BufFreelistLock Exclusive 3 FirstBufMappingLock Shared 4
FirstLockMgrLock Shared 4
Lock Id Mode Combined Time (ns)
FirstLockMgrLock Exclusive 803700
BufFreelistLock Exclusive 3001600
FirstLockMgrLock Shared 4586600 FirstBufMappingLock Exclusive 6283900 FirstBufMappingLock Shared 21792900#
| All Wrokload Results |
Following are results for all tested workloads, PostgreSQL versions, number of cores, and other configuration options. As usually,
- X-axis represents a number of concurrent sessions (users)
- Y-axis represents a TPS level
| Final Results for PostgreSQL 8.3.7 |
db_STRESS PostgreSQL 8.3.7 Results
| Final Results for PostgreSQL 8.4beta1 |
db_STRESS PostgreSQL 8.4beta1 Results
| PostgreSQL Scalability @db_STRESS |
PostgreSQL Scalability @db_STRESS Results
| Workload STATs |
Here you may find all main graphs reflecting system and application activity during most of tested workloads...Used Abbreviations :
- RW=0 -- Read Only Workload
- RW=1 -- Read+Write Workload
- RW=10 -- 10 Read transactions per single Write
- cores=C(T) -- tested on C cores, and each core has T threads activated
- COLD -- means "cold cache" - workload is started just after database server is started up
| Workload STATs #1 |
Workload STATs
- dbSTRESS RW=0 pgsql-8.3.7 cores=8(2) COLD
- dbSTRESS RW=0 pgsql-8.3.7 cores=8(2)
- dbSTRESS RW=1 pgsql-8.3.7 cores=8(2)
- dbSTRESS RW=10 pgsql-8.3.7 cores=8(2)
- dbSTRESS RW=0 pgsql-8.4beta1 cores=8(2) COLD
- dbSTRESS RW=0 pgsql-8.4beta1 cores=8(2)
- dbSTRESS RW=1 pgsql-8.4beta1 cores=8(2)
- dbSTRESS RW=10 pgsql-8.4beta1 cores=8(2)
- dbSTRESS RW=0 pgsql-8.3.7 cores=16(2) COLD
- dbSTRESS RW=0 pgsql-8.3.7 cores=16(2)
- dbSTRESS RW=1 pgsql-8.3.7 cores=16(2)
- dbSTRESS RW=10 pgsql-8.3.7 cores=16(2)
- dbSTRESS RW=0 pgsql-8.4beta1 cores=16(2) COLD
- dbSTRESS RW=0 pgsql-8.4beta1 cores=16(2)
- dbSTRESS RW=1 pgsql-8.4beta1 cores=16(2)
- dbSTRESS RW=10 pgsql-8.4beta1 cores=16(2)
- dbSTRESS RW=0 pgsql-8.3.7 cores=32(2) COLD
- dbSTRESS RW=0 pgsql-8.3.7 cores=32(2)
- dbSTRESS RW=1 pgsql-8.3.7 cores=32(2)
- dbSTRESS RW=10 pgsql-8.3.7 cores=32(2)
- dbSTRESS RW=0 pgsql-8.4beta1 cores=32(2) COLD
- dbSTRESS RW=0 pgsql-8.4beta1 cores=32(2)
- dbSTRESS RW=1 pgsql-8.4beta1 cores=32(2)
- dbSTRESS RW=10 pgsql-8.4beta1 cores=32(2)
| Workload STATs #2 |
Workload STATs #2
- dbSTRESS RW=0 pgsql-8.3.7-ana5 cores=8(2)
- dbSTRESS RW=1 pgsql-8.3.7-ana5 cores=8(2)
- dbSTRESS RW=10 pgsql-8.3.7-ana5 cores=8(2)
- dbSTRESS RW=0 pgsql-8.4beta1-ana5 cores=8(2)
- dbSTRESS RW=1 pgsql-8.4beta1-ana5 cores=8(2)
- dbSTRESS RW=10 pgsql-8.4beta1-ana5 cores=8(2)
- dbSTRESS RW=0 pgsql-8.3.7-ana5 cores=16(2)
- dbSTRESS RW=1 pgsql-8.3.7-ana5 cores=16(2)
- dbSTRESS RW=10 pgsql-8.3.7-ana5 cores=16(2)
- dbSTRESS RW=0 pgsql-8.4beta1-ana5 cores=16(2)
- dbSTRESS RW=1 pgsql-8.4beta1-ana5 cores=16(2)
- dbSTRESS RW=10 pgsql-8.4beta1-ana5 cores=16(2)
- dbSTRESS RW=0 pgsql-8.3.7-ana5 cores=32(2)
- dbSTRESS RW=1 pgsql-8.3.7-ana5 cores=32(2)
- dbSTRESS RW=10 pgsql-8.3.7-ana5 cores=32(2)
- dbSTRESS RW=0 pgsql-8.4beta1-ana5 cores=32(2)
- dbSTRESS RW=1 pgsql-8.4beta1-ana5 cores=32(2)
- dbSTRESS RW=10 pgsql-8.4beta1-ana5 cores=32(2)
- dbSTRESS RW=0 pgsql-8.3.7-chp30 cores=8(2)
- dbSTRESS RW=1 pgsql-8.3.7-chp30 cores=8(2)
- dbSTRESS RW=10 pgsql-8.3.7-chp30 cores=8(2)
- dbSTRESS RW=0 pgsql-8.4beta1-chp30 cores=8(2)
- dbSTRESS RW=1 pgsql-8.4beta1-chp30 cores=8(2)
- dbSTRESS RW=10 pgsql-8.4beta1-chp30 cores=8(2)
- dbSTRESS RW=0 pgsql-8.3.7-chp30 cores=16(2)
- dbSTRESS RW=1 pgsql-8.3.7-chp30 cores=16(2)
- dbSTRESS RW=10 pgsql-8.3.7-chp30 cores=16(2)
- dbSTRESS RW=0 pgsql-8.4beta1-chp30 cores=16(2)
- dbSTRESS RW=1 pgsql-8.4beta1-chp30 cores=16(2)
- dbSTRESS RW=10 pgsql-8.4beta1-chp30 cores=16(2)
- dbSTRESS RW=0 pgsql-8.3.7-chp30 cores=32(2)
- dbSTRESS RW=1 pgsql-8.3.7-chp30 cores=32(2)
- dbSTRESS RW=10 pgsql-8.3.7-chp30 cores=32(2)
- dbSTRESS RW=0 pgsql-8.4beta1-chp30 cores=32(2)
- dbSTRESS RW=1 pgsql-8.4beta1-chp30 cores=32(2)
- dbSTRESS RW=10 pgsql-8.4beta1-chp30 cores=32(2)
- dbSTRESS RW=0 pgsql-8.3.7-buf256 cores=8(2)
- dbSTRESS RW=1 pgsql-8.3.7-buf256 cores=8(2)
- dbSTRESS RW=10 pgsql-8.3.7-buf256 cores=8(2)
- dbSTRESS RW=0 pgsql-8.4beta1-buf256 cores=8(2)
- dbSTRESS RW=1 pgsql-8.4beta1-buf256 cores=8(2)
- dbSTRESS RW=10 pgsql-8.4beta1-buf256 cores=8(2)
- dbSTRESS RW=0 pgsql-8.3.7-buf256 cores=16(2)
- dbSTRESS RW=1 pgsql-8.3.7-buf256 cores=16(2)
- dbSTRESS RW=10 pgsql-8.3.7-buf256 cores=16(2)
- dbSTRESS RW=0 pgsql-8.4beta1-buf256 cores=16(2)
- dbSTRESS RW=1 pgsql-8.4beta1-buf256 cores=16(2)
- dbSTRESS RW=10 pgsql-8.4beta1-buf256 cores=16(2)
- dbSTRESS RW=0 pgsql-8.3.7-buf256 cores=32(2)
- dbSTRESS RW=1 pgsql-8.3.7-buf256 cores=32(2)
- dbSTRESS RW=10 pgsql-8.3.7-buf256 cores=32(2)
- dbSTRESS RW=0 pgsql-8.4beta1-buf256 cores=32(2)
- dbSTRESS RW=1 pgsql-8.4beta1-buf256 cores=32(2)
- dbSTRESS RW=10 pgsql-8.4beta1-buf256 cores=32(2)
- dbSTRESS RW=0 pgsql-8.3.7-buf4096 cores=8(2)
- dbSTRESS RW=1 pgsql-8.3.7-buf4096 cores=8(2)
- dbSTRESS RW=10 pgsql-8.3.7-buf4096 cores=8(2)
- dbSTRESS RW=0 pgsql-8.4beta1-buf4096 cores=8(2)
- dbSTRESS RW=1 pgsql-8.4beta1-buf4096 cores=8(2)
- dbSTRESS RW=10 pgsql-8.4beta1-buf4096 cores=8(2)
- dbSTRESS RW=0 pgsql-8.3.7-buf4096 cores=16(2)
- dbSTRESS RW=1 pgsql-8.3.7-buf4096 cores=16(2)
- dbSTRESS RW=10 pgsql-8.3.7-buf4096 cores=16(2)
- dbSTRESS RW=0 pgsql-8.4beta1-buf4096 cores=16(2)
- dbSTRESS RW=1 pgsql-8.4beta1-buf4096 cores=16(2)
- dbSTRESS RW=10 pgsql-8.4beta1-buf4096 cores=16(2)
- dbSTRESS RW=0 pgsql-8.3.7-buf4096 cores=32(2)
- dbSTRESS RW=1 pgsql-8.3.7-buf4096 cores=32(2)
- dbSTRESS RW=10 pgsql-8.3.7-buf4096 cores=32(2)
- dbSTRESS RW=0 pgsql-8.4beta1-buf4096 cores=32(2)
- dbSTRESS RW=1 pgsql-8.4beta1-buf4096 cores=32(2)
- dbSTRESS RW=10 pgsql-8.4beta1-buf4096 cores=32(2)
- dbSTRESS RW=0 pgsql-8.3.7-buf4096 cores=24(2)
- dbSTRESS RW=1 pgsql-8.3.7-buf4096 cores=24(2)
- dbSTRESS RW=10 pgsql-8.3.7-buf4096 cores=24(2)
- dbSTRESS RW=0 pgsql-8.4beta1-buf4096 cores=24(2)
- dbSTRESS RW=1 pgsql-8.4beta1-buf4096 cores=24(2)
- dbSTRESS RW=10 pgsql-8.4beta1-buf4096 cores=24(2)
- dbSTRESS RW=0 pgsql-8.3.7-prep cores=8(2)
- dbSTRESS RW=1 pgsql-8.3.7-prep cores=8(2)
- dbSTRESS RW=10 pgsql-8.3.7-prep cores=8(2)
- dbSTRESS RW=0 pgsql-8.4beta1-prep cores=8(2)
- dbSTRESS RW=1 pgsql-8.4beta1-prep cores=8(2)
- dbSTRESS RW=10 pgsql-8.4beta1-prep cores=8(2)
- dbSTRESS RW=0 pgsql-8.3.7-prep cores=16(2)
- dbSTRESS RW=1 pgsql-8.3.7-prep cores=16(2)
- dbSTRESS RW=10 pgsql-8.3.7-prep cores=16(2)
- dbSTRESS RW=0 pgsql-8.4beta1-prep cores=16(2)
- dbSTRESS RW=1 pgsql-8.4beta1-prep cores=16(2)
- dbSTRESS RW=10 pgsql-8.4beta1-prep cores=16(2)
- dbSTRESS RW=0 pgsql-8.3.7-prep cores=32(2)
- dbSTRESS RW=1 pgsql-8.3.7-prep cores=32(2)
- dbSTRESS RW=10 pgsql-8.3.7-prep cores=32(2)
- dbSTRESS RW=0 pgsql-8.4beta1-prep cores=32(2)
- dbSTRESS RW=1 pgsql-8.4beta1-prep cores=32(2)
- dbSTRESS RW=10 pgsql-8.4beta1-prep cores=32(2)
- dbSTRESS RW=0 pgsql-8.3.7-prep cores=24(2)
- dbSTRESS RW=1 pgsql-8.3.7-prep cores=24(2)
- dbSTRESS RW=10 pgsql-8.3.7-prep cores=24(2)
- dbSTRESS RW=0 pgsql-8.4beta1-prep cores=24(2)
- dbSTRESS RW=1 pgsql-8.4beta1-prep cores=24(2)
- dbSTRESS RW=10 pgsql-8.4beta1-prep cores=24(2)
| SUMMARY |
Final notes :
- Performance is greatly improved comparing to my previous tests! So, globally I'm very happy with obtained results - they are honest and demonstrating the current maximal PostgreSQL performance on db_STRESS benchmark!
- Several performance impacts were discovered, used or tests:
- target analyze impact -- if you're not using prepared queries and your queries are running very fast - take care about target analyze! also, keep in mind it may be set different per table!
- hash join impact -- sometimes using hash join may be slower..
- prepared statement benefit -- for sure the best way to run your queries with a minimal cost!
- checkpoint completion target -- excellent way to lower checkpoint impact!
- buffer pool impact -- it's not always true to delegate data caching to the file system! as you may see from my graphs, results with a 4096MB pool are way better comparing to 256MB, and still better comparing to 1024MB :-)
But finally, why PostgreSQL is slower comparing to MySQL on db_STRESS ?...
- the main reason for me is the internal cost to execute a single SELECT-2 query (SELECT-1 takes a comparable time on both database engines)
- more lower is the total query execution, more important the part of this cost become..
- on MySQL the SELECT-2 execution time is 0.44ms (0.65ms with transfer cost during the test)
- on PG the same query even when it's prepared runs in 0.98ms (1.15ms with transfer cost during the test)
- even if MySQL is not scaling very well yet, on 16 concurrent sessions it's already reaching 12.500 TPS (Read-Only workload), while PostgreSQL is reaching only 9.000 TPS... And again, if PG continued to scale it should be less a problem, but there is a very small gain on move from 16 to 24 cores...
Look on the following tables (observed on 16cores):
Response Time(ms) 1 2 4 8 16 PostgreSQL 8.4 1.20 1.20 1.20 1.25 1.40 MySQL 5.4 0.65 0.70 0.70 0.80 0.90
Read-Only TPS 1 2 4 8 16 PostgreSQL 8.4 650 1,300 2,600 5,000 9,000 MySQL 5.4 1,000 2,000 4,000 7,500 12,500
Currently observed the max stable troughput on :
Read-Only TPS PostgreSQL 8.4 PostgreSQL 8.4 prep MySQL 5.4 MySQL 5.Perf build5 8 cores 4,600 6,700 14,000 14,000 16 cores 8,500 12,500 17,500 18,000
Read+Write TPS PostgreSQL 8.4 PostgreSQL 8.4 prep MySQL 5.4 MySQL 5.Perf build5 8 cores 6,000 7,300 7,000 10,000 16 cores 8,500 11,500 7,000 12,000
Next to investigate :
- profile a single session and understand where the time is lost
- profile PostgreSQL on a bigger server (64cores?) and see where is a scalability bottleneck