Created: 2009-11-25
Last modified: 2009-12-14
MySQL Performance: Breaking limits with XtraDB!
by Dimitri
SSC Team, 2009
Sun Microsystems Inc.
|
Ces informations sont données ŕ titre indicatif et n'engagent pas Sun Microsystems.
Table of contents
Customer Name(s): SSC Team
NDA: ...
Contact Information:
- Dimitri (at) sun.com
Dates: Nov - Dec.2009
Keywords: MySQL 5.4, XtraDB-8, InnoDB plugin-1.0.4, show mutex status, rollback segments, partitions, purge thread
Server(s):
- X4450 4CPU quad-core Intel, 16GB RAM
Storage:
- ST6140, x2 LUNs RAID1 (/DATA and /LOG)
System:
- Solaris 10 update7
- UFS
Application(s):
- MySQL 5.4
- MySQL 5-perf-b5
- InnoDB plugin-1.0.4
- XtraDB-8
Overview: This testing was inspired by Yasufumi's post about tuning for heavy writing workloads - mainly because initially I did not observed the same things. And also I was very curious to analyze currently present hot lock contentions in InnoDB with an improved feature coming with plugin-1.0.4 - "SHOW MUTEX STATUS" presenting now lock wait stats in compact and easy for monitoring form!
Goal(s): For this testing I don't have my usual M5000 SPARC server, but less powerful x4450 server with Intel CPUs (16 cores only). So I cannot expect to reach the highest possible absolute performance with MySQL, but rather highest possible performance for the testing workload on this machine :-)
Result(s):
- SHOW MUTEX STATUS feature is absolutely great for analyzing!
- XtraDB rocks! :-)
All details about dbSTRESS benchmark you may find here: http://dimitrik.free.fr/db_STRESS.html
During this testing I'm concentrating mainly on the Read+Write workload (Read-Only is already working pretty good and on the current server is limited by H/W capacity :-))
dbSTRESS scenario :
- Tested Workload: Read+Write (RW=1)
- Think time: 0 sec
- Concurrent sessions: 32
- Test duration: 1 hour (or more)
- Database size: 10M of OBJECTs (200M HISTORY records)
H/W configuration :
- x4450 server is running both database server and injector locally (I want to avoid any network issues), as well database and injector are sharing the same 16 cores
- FX class scheduler is used for MySQL and demonstrated a great improvement of performance stability!
# priocntl -s -c FX -m 59 -p 59 -t 1000 -i uid UID_of_mysqld
- Storage array: ST6140 - split into 2 RAID1 LUNs, one keeps /DATA, another /LOG, and write cache on controller helps a lot!
Additionally to the classic system monitoring (CPU, I/O, Processes, loopback packets/sec, etc.), I've used few more stats giving me a very important details about a tested workload:
dbSTRESS - stats telling me about the current TPS level and response times observed by injectors:
- Read response times (SEL1, SEL2)
- Write response times (DEL, INS, UPD)
- TPS level (All, Reads, Writes)
innodbSTAT - all main stats about InnoDB engine (based on "show innodb status"):
- Buffer pool state (free, dirty, modified pages)
- Checkpoint age (MB)
- Log, Files, Pages I/O operations/sec
- Lock wait/spin /sec
- Session queue
- History list length (if information is available)
- etc.
innodbMUTEX - monitoring of InnoDB mutexes (based on improved "show mutex status" output, available since plugin-1.0.4):
- Waits/sec on a given mutex (src.file:line)
- Waits delta on a given mutex (src.file:line)
- Waits total on a given mutex (src.file:line)
I would say things are changing since InnoDB plugin-1.0.4 - improved output of "show mutex status" clarifying many things! It'll be also great to replace source_file_name:line by a kind of common name to be reused in further investigations (as InnoDB code will be improved continuously, the line numbers for the same mutexes may vary from one InnoDB version to another). As well it'll be great to have also the amount of time spent on each mutex (of course it may require additional CPU time, so it may be integrated as a my.conf option for ex.)
All monitoring commands are integrated within dim_STAT and making analyzing of workload very easy :-)
|
MySQL Configuration parameters
|
Here is the contents of my "base" my.conf used during following testing:
[mysqld]
 max_connections=2000
 key_buffer_size=200M
 low_priority_updates=1
 sort_buffer_size = 2097152
 table_open_cache = 8000

# files
 innodb_file_per_table
 innodb_log_group_home_dir=/LOG/redologs
 innodb_log_file_size=1024M
 innodb_log_files_in_group=3

# buffers
 innodb_buffer_pool_size=8000M
 innodb_additional_mem_pool_size=20M
 innodb_log_buffer_size=8M

# tune
 innodb_checksums=0
 innodb_doublewrite=0
 innodb_support_xa=0
 innodb_thread_concurrency=16
 innodb_flush_log_at_trx_commit=2
 innodb_flush_method= O_DIRECT
 innodb_max_dirty_pages_pct=50

# perf special
 innodb_thread_concurrency=16
 innodb_adaptive_flushing = 1
 innodb_read_io_threads = 16
 innodb_write_io_threads = 16
 innodb_io_capacity = 2000
Few comments :
- This config file representing the "base line" settings (which are remaining the same if no other setting was specified)
- Data and redo logs are separated and placed on different storage LUNs (/DATA and /LOG)
- Redo log size of 1MB was used (and 3 log files (important for performance))
- Buffer pool was reduced to 8000M as I was surprised to discover that during some tests MySQL started to swap! :-) (and since then during each test RAM usage was explicitly monitored too :-))
First of all I've executed a probe test on this platform - I did not have any idea what kind of performance I may expect from a such small server (well, everything is relative :-)). Then I was interested not as much on the absolute TPS numbers as on the ratio between different engines.. Similar results were previously posted on my blog and compared MySQL 5.4 with XtraDB-8 and InnoDB-plugin-1.0.4 - but discussing with Yasufumi I realized I did not test the right XtraDB version: they day it was announced the published sources were not up-to-date... So now, I'm sure to test a true XtraDB-8 code! :-)
So far, the probe test is executed using a "similar" my.conf for all engines (for XtraDB and plugin-1.0.4 it's just simply the same)
Engines used in probe test :
- MySQL Perf-b5 (and old perf build, used just as reference)
- MySQL 5.4 patched with a separated purge thread
- InnoDB plugin-1.0.4 (compiled within mysql-5.1.39)
- XtraDB-8 (compiled within mysql-5.1.39)
I've made 2 tests :
- one with innodb_flush_log_at_trx_commit=2
- and another with innodb_flush_log_at_trx_commit=1
The first test is labeled as "RW-Long,tx2" (tx2 is used as abbreviation from innodb_flush_log_at_trx_commit=2). This test running in partially-safe transaction conditions (as InnoDB is not flushing data on every commit, but just write them to the filesystem and flush (fsync) them once per second). As this test is not fully redolog-I/O-bound it leaves some room for other parts of the InnoDB code to "express" their bottlenecks :-) BTW, until your OS is safe enough and used H/W is stable and uses a power protection - it'll still be very safe! :-) This test is also running with innodb_thread_concurrency=16 to reduce internal concurrency contention.
The second test is labeled as "RW-Long,tx1" and running in fully-safe transaction conditions (InnoDB is flushing (fsync) redolog on every commit). This test is fully redolog-I/O-bound and cache on the controller of the storage array helps a lot here! But on the same times writes are still remaining serialized and even processing very fast still limiting a lot overall database performance. This test is running with innodb_thread_concurrency=0 as due I/O-bound we're yet far to see any internal concurrency contention.
During each test I've also monitored MUTEX waits (whenever such information was available).
|
Read+Write Long test with innodb_flush_log_at_trx_commit=2
|
 |
|
Observations :
- MySQL 5.4 with a separated purge thread demonstrating the most stable processing
- InnoDB plugin-1.0.4 out-passing MySQL 5.4 now
- XtraDB-8 out-passing InnoDB plugin, and slightly out-passing the Perf build5!
- Major mutex waits for InnoDB plugin are on rollback segments and on redo logs..
- Major mutex waits for XtraDB are on dictionary, rollback segments and redo logs..
|
|
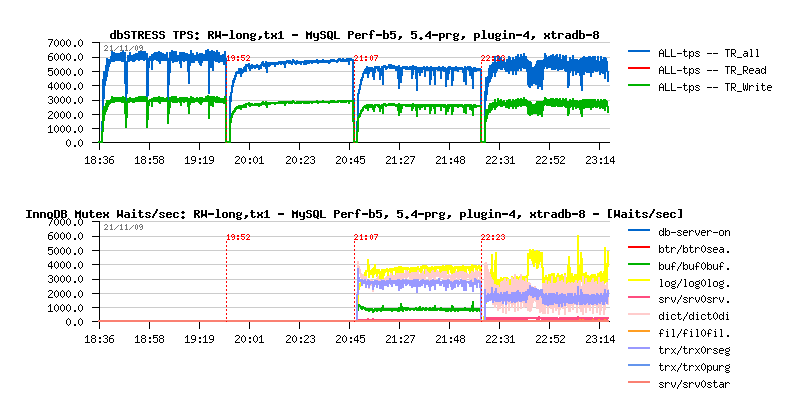
Read+Write Long test with innodb_flush_log_at_trx_commit=1
|
 |
|
Observations :
- MySQL 5.4 with a separated purge thread demonstrating the most stable processing
- XtraDB-8 out-passing InnoDB plugin
- MySQL 5.4 out-passing XtraDB-8
- Perf build5 demonstrating the highest performance
- Major mutex waits for InnoDB plugin are on redo logs, dictionary, rollback segments and buffers(!)..
- Major mutex waits for XtraDB are on redo logs, dictionary and rollback segments..
NOTE: there is no waits on buffers because XtraDB has already a buffer mutex split implemented!
|
|
Breaking Limits with XtraDB
|
All further testing I'm continuing with XtraDB.
Why?
- Because it has already all ongoing improvements integrated! :-)
- It even has a separated purge thread feature implemented! (even it was not announced in the list of features for XtraDB-8, you may find a configuration parameter innodb_use_purge_thread (0/1))
- It already implements buffer mutex split (and that's why we did not observe buffer lock waits!)
- It already implements extended rollback segments!
- And it already implements some fixes for dictionary locks!
So, until all these features are not shipped "officially" - it's very easy to validate their impact on your workload - and more cases will be tested, better MySQL/InnoDB will be! Don't wait! :-)
Let see now more closely on lock waits observed on XtraDB during the probe test...
|
Read+Write Long test on XtraDB
|
 |
|
|
As you can see, the major lock waits are on the dictionary, rollback segments and redo logs. As there is no timing information, it's hard to say exactly which lock the most waited.. So my next step will be to evaluate impact of having several rollback segments. I also give a priority to this option as it's more "generic" - if it brings performance boost it'll help to improve overall performance of your database, and not just a particular case of one table, etc.
Setting up additional rollback segments :
- First of all you have to set innodb_extra_rsegments to a desired value (in my case innodb_extra_rsegments=64)
- Then, IMPORTANT! - the rollback segments are created only on the InnoDB instance initialization, so to make them available you have to completely re-create your InnoDB instance (means drop all InnoDB files, restart MySQL, wait while InnoDB will finish its initialization, then recreate all your databases again and reload all your data)... - This point is the most painful on my opinion.. The most optimal will be to have rollback segments in the external file rather in the system datafile - and probably in this case it may require only MySQL restart (similar when you want to change the size of your redo logs - you just drop them and then they recreated again on MySQL start-up)
But well, let's see first if there is any gain, and then, if any - a better way to implement it :-)
|
|
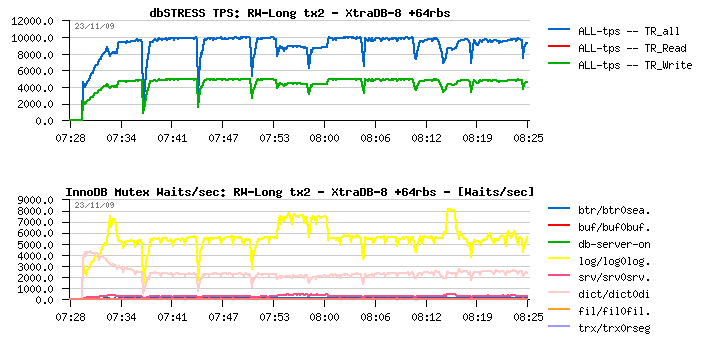
Read+Write Long test on XtraDB +64rbs
|
 |
|
|
Wow, 25% improvement !! (10.000 TPS vs 8.000 previously!) - it's a very valuable option!! and it makes sense to implement it "officially" and do it more easy configurable way :-)
On the same time, I don't see what kind of negative effects may be introduced by having more rollback segments.. Do you?.. - If no, the default number may just be reconsidered and be set to 32 or 64, etc, and in this way such a performance boost may be simply guaranteed :-)
Observations :
- As you may see, there is no more waits on rollback segments - they are completely gone!
- The main waits are now on redo logs - but I don't think there is any way for the moment to improve them :-) and I would say once it become the only waits you have you may consider your database is really optimized :-)
- So far, we still have waits on the dictionary lock - and to understand what kind of the lock we're waiting you have to read the source code.. - Hope in the next version the name of the lock will be given instead of the source filename:line pair - it'll simplify analyzing and finally name things (like Oracle latches). This particular RW-lock is created within a dictionary code and protecting index tree during concurrent operations
- Having the index lock so hot just give us a sign there is one or several indexes are accessing and modified very aggressively (and in my case it's the HISTORY table index)
Resolving hot index lock :
- Write a patch for InnoDB code (not easy... :-))
- Don't use your table/index so aggressively :-))
- But seriously - you may reduce index lock contention by dividing your table into several ones, and the most "transparent" way to do it is to use PARTITIONS !! :-)
|
Even if there are many articles explaining performance gains by using partitions in MySQL, there are still few explaining that they may be used as solution for lowering index lock contention! :-)) (The last one was a great post by Yasufumi).
On the same time, until now, there was no "easy" way to know you have any contention on the index lock! :-))
So, how partitions may help here?..
The most common way to reduce contention on a given lock is to split one lock to several locks (and you split as well the data it's protecting) - if the index lock code should be rewritten one day it may probably go this way ;-) But there is no restriction to reach the same result with partitions! - What will change if you split your table in, say, 3 partitions? - it's likely you have 3 tables now (and 3 indexes instead of one!) - so if your workload remaining the same and your table access widely distributed - you should divide your index lock contention by 3 (as it'll be redistributed to "3 indexes" now)!
Now, how apply it in practice?..
There is a widely spread common opinion that you absolutely need to have a primary or unique key within a table to be used as partition's key and it should be absolutely a numeric value... - all these statements are only partially true - there is still KEY PARTITION mode which doesn't limited to numeric values and doesn't require any primary/unique key on your table! Key partition in my case will be used on the REF_OBJECT column (char) of the HISTORY table.
The order of actions :
- create table with partitions
- and only then(!) add indexes (if any)
Finally:
-- ============================================================
--   Table : HISTORY  +partitions
-- ============================================================

drop table HISTORY;

create table HISTORY
(
 REF_OBJECT          CHAR(10)              not null,
 HORDER              INT                   not null,
 REF_STAT            CHAR(3)               not null,
 BEGIN_DATE          CHAR(12)              not null,
 END_DATE            CHAR(12)                      ,
 NOTE                CHAR(100)

) ENGINE=InnoDB  partition by KEY( REF_OBJECT ) partitions 3;

-- ============================================================
-- INDEX
-- ============================================================

create index history_ref_idx on HISTORY( ref_object, horder );
But let's see the results now...
|
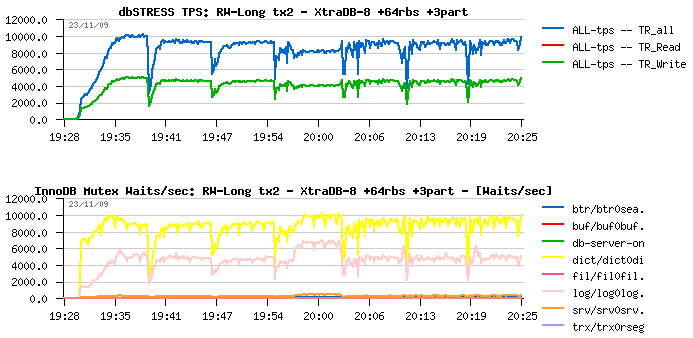
Read+Write Long test on XtraDB +64rbs +3partitions
|
 |
|
|
Hmm... Interesting, no? :-)
Results :
- No performance improvement at all.. (it's even slightly decreased!)
- Even much more higher contention on redo log and dictionary locks!...
- And even worse: dictionary lock waits are out-passing redo log waits!...
What's going wrong here?..
| IMPORTANT - Looking on a such picture and driving only by the result (e.g. TPS observation) we may definitively reject a such kind of "optimization" and completely miss the point! And what is usually happens in many cases! |
But now let's look more in details on these locks.. (to get graphs more compacted I've grouped lock waits by first 12 letters in the file name - let's see the detailed graph now! :-))
|
|
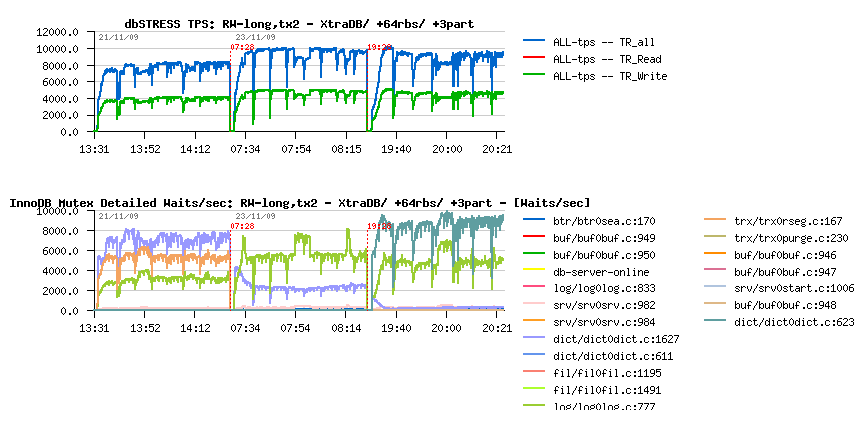
Read+Write Long test on XtraDB +64rbs +3partitions (In Details)
|
 |
|
The presented graph is showing all 3 described cases together on the same time:
- XtraDB-8 default (as seen on the beginning)
- XtraDB-8 default +64 rollback segments
- XtraDB-8 default +64 rollback segments +3 partitions
As you may see :
- Initially major waits are around redo log, rollback segments and index locks
- Then (with +64rbs) rollback segment waits are gone, log waits become higher, but index locks become lowered
- And then, when 3 partitions are used, the index lock is gone! but the new lock is coming in game! which we even did not see before!!!
The new lock contention is corresponding to the RW-lock on SYNC_DICT_OPERATION, and we are very lucky here because XtraDB has already implemented the solution to resolve this issue! And all we need is to restart MySQL with innodb_stats_update_need_lock=0 and it's fixed! :-)
Let's see the result now...
|
|
Read+Write Long test on XtraDB +64rbs +3partitions +stats_lock=0
|
 |
|
Observations :
- 11.000 TPS now!!! 10% improvement again (and overall 37.5% performance improvement!!)
- The only waits we have now are on redo logs - and for the moment we hit the max possible optimization to be obtained via database configuration and tuning
- And probably once there will be a solution to lower waits on log locks we'll discover another hot contention :-))
| NOTE : as "official" InnoDB plugin code doesn't have currently such a feature implemented yet you cannot obtain a similar gain by using KEY PARTITION! (And innodb_stats_update_need_lock setting should be very seriously investigated!) |
|
You may see from the TPS graphs of all presented tests with XtraDB there is yet missing TPS stability - periodical performance drops are happening due hard purge work and having a separated purge thread feature need to be implemented to resolve it.. Curiously, adoption of this solution on the InnoDB-plugin-1.0.4 code giving a lower TPS throughput comparing to the default code (while on MySQL 5.4 performance remained the same + it gave the expected TPS stability)...
Percona implemented this feature and XtraDB has now an option: innodb_use_purge_thread=1/0 - let's see the impact now on the same workload.
|
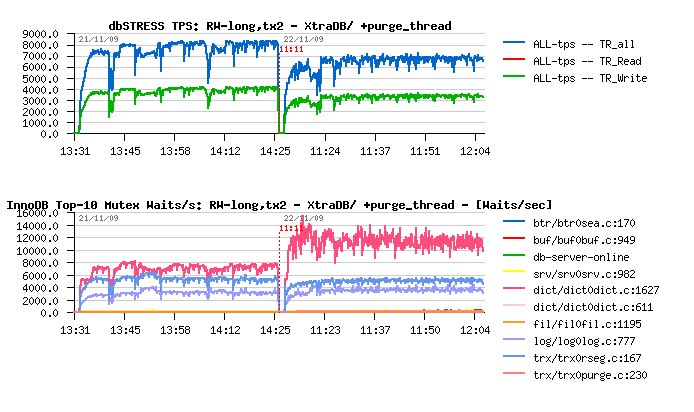
Read+Write Long test on XtraDB & Purge Thread
|
 |
|
Two tests are presented on the current graph:
- XtraDB-8 initial configuration
- XtraDB-8 initial + purge_thread (innodb_use_purge_thread=1)
Observations :
- Significant drop on performance
- Very significant jump on index lock waits!!
Seems separating purge processing freeing some other resources and it largely increasing concurrency on other places.. As well I'm not really happy of "stability" it brings on TPS.. Need to investigate more here.
But what if apply now all previously demonstrated stuff?.. (64 rollback segments & 3 partitions)
|
|
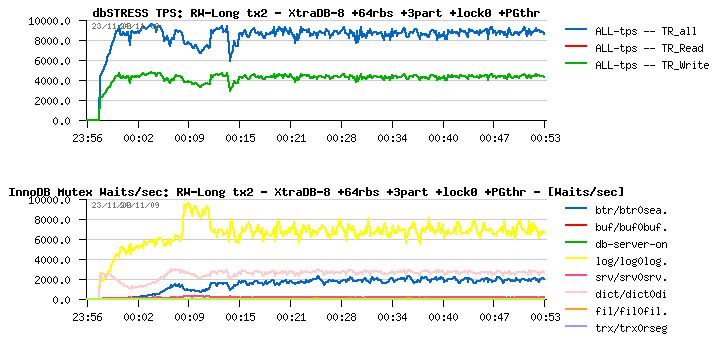
Read+Write Long test on XtraDB & Purge Thread +64rbs +3part +stat_lock=0
|
 |
|
Observations :
- Significant improvement in performance comparing to the previous test (~9.000 TPS vs 7.000 TPS)
- Still lower performance comparing to the best result (11.000 TPS) without purge thread
- Better TPS stability is a very positive point!
- History list length not growing anymore and become very low! (not presented on this graphs, see Annex)
- Once again a new lock waits coming in game: this time it's a B-Tree lock used in index hash table!
The easy way to resolve B-Tree lock waits is to disable adaptive index hashing with innodb_adaptive_hash_index=0 - but how much it'll help here?... ;-)
|
|
Read+Write Long test on XtraDB & Purge Thread +64rbs +3part +stat_lock=0 hash=0
|
 |
|
Observations :
- Setting innodb_adaptive_hash_index=0 removed waits on the B-Tree lock, great :-)
- But on the same time it reduced performance level as adaptive hashing seems to work faster during the current test rather normal index operations :-)
Just to say that resolving lock waits is not always an absolute goal, it depends also on your workload characterizations! :-))
Need to investigate more here...
|
Main points :
- New compact "SHOW MUTEX STATUS" feature in InnoDB-plugin is absolutely great for understanding lock contention internals
- It still need to be improved: not only a number of waits should be presented, but also a time amount spent within
- As well it'll be great to name locks rather use file:line naming..
- XtraDB is absolutely excellent to validate new features/ideas for your workload - please, test it without hesitation, it may only help for a whole MySQL/InnoDB development!
- Having more rollback segments seems to be a MUST! - specially that a part of the code for it was already implemented initially within InnoDB..
- Using KEY PARTITIONS may be very helpful in many cases - however, take care about your buffer pool usage, and avoid to create too many partitions!
- Feature with innodb_stats_update_need_lock setting should be validated and adopted asap! (if not presenting any important risks for InnoDB functionality)
- Investigation with a purge thread continues... :-)
In several days it'll be an anniversary of XtraDB - 1 year! :-) Many things changed during this time and many improvements were initiated by XtraDB... And it's really great to celebrate a such event being once again the most advanced and most performance-ahead InnoDB engine implementation available for today! Kudos Percona! :-)
In following chapters you may find detailed STATs about all presented tests.
Few words about used abbreviations :
- tx1 -- means tested with innodb_flush_log_at_trx_commit=1
- tx2 -- means tested with innodb_flush_log_at_trx_commit=2
- ccr=N -- means tested with innodb_thread_concurrency=N
- +64rbs -- means additional 64 rollback segments were used
- +3part -- means 3 KEY partitions were used
- +purge_thd -- means separated purge thread was used
- +stat_lock0 -- means tested with innodb_stats_update_need_lock=0
- +hash0 -- means tested with innodb_adaptive_hash_index=0
Hope I did not missed anything else :-)
Probe Tests STATs 2
|
XtraDB Performance testing STATs
|
XtraDB Performance testing STATs