by Dimitri |
1. PREFACE |
Started as a simple database engines comparison, this benchmark quickly out-passed initial test perimeter and was transformed into more general database scalability study. This is the Part-I.Following benchmark results covering mixed subjects, combining:
- MySQL MyISAM and InnoDB
- PostgreSQL
- Oracle 10g
- ZFS (Sol10 11/06)
- UFS buffered/forcedirectio
- T2000
- etcThis study was full of re-bound event and crazy surprises. I'm presenting all events here as they happened in chronological order, finding by finding, with all fixed and potential problems. Final results are very positive, but I always was most interested to know *how* people reaching the best possible performance level (being on the same initial conditions as others) - rather just a final numbers... Hope information presented in this document will be also useful for others and, if it'll wake up any new ideas - I'll be even more happy! :)
Have a fun reading! Any feedback - welcome!
Rgds,
-Dimitri
2. Benchmark Platform |
Initially we simple bet: will T2000 (1200Mhz UST1 8cores) be able to keep the same workload (database) as V490 (4CPU US4+ 1800Mhz (bi-cores)), or not?.. The only real way to know is to test by ourselves :)) As there was no V490 server around, V890 with 4CPU disabled was ok. Then, to avoid any storage speculations, each server got connected 2x SE3510 boxes. One SE3510 configured in RAID5 and another one in RAID1...
2.1. Platform Overview |
System details: 1) V890 US4+ (64GB RAM)
- Solaris10
- 2 HBA (2Gbit)
- Gbit NIC2) T2000 UST1 8cores 32GB RAM
- Solaris 10
- 2 HBA (2Gbit)
- Gbit NIC3) T2000 UST1 8cores 32GB RAM
- Solaris 10
- Gbit NIC4) 4x SE3510 (73GB 12HD)
- primary controller used (2Gbit port)
- two SE3510 connected to V890, and two other to T2000 (#2)
- 2 LUNs: RAID1 (6HD) and RAID5 (6HD)
SysINFO: T2000 @
3. Benchmark Overview |
3.1. db_STRESS Benchmark |
See for detailed benchmark description here: http://dimitrik.free.fr/db_STRESS.html
3.2. Benchmark Scenario |
Stress Test:
- think time: 0 sec
- RW: 0, 1, 10, 1000
- injectors: 1, 2, 4, 8, 16, 32, 64, 128, 2561600usr Test:
- think time: 1 sec
- RW: 0, 1, 10
- injectors: 50, 100, 200, 400, 600, 800, 1000, 1200, 1400, 1600Additional variations:
- Engine: MyISAM, InnoDB, PostgreSQL, Oracle 10g
- Storage: RAID5, RAID1
- Optionally: UFS Direct I/O = ON/OFF
- Tuning: any interesting database specific tuning not changing test sense :))
4. MySQL Benchmark |
Just few points here before going further:- Interesting parameters to check:
- thread_concurrency= ?? (post-note: very sensible for MyISAM)
- innodb_thread_concurrency= ?? (post-note: very important for InnoDB)
- innodb_file_io_threads= ?? (post-note: did not help)
- innodb_flush_method= O_DIRECT (and avoid flush call, post-note: did not help)
- innodb_flush_log_at_tx_commit= 0 (mixed with UFS Direct I/O = ON may be still acceptable)
- tx isolation = READ-COMMITTED (post-note: did not help)
- innodb_locks_unsafe_for_binlog (post-note: deprecated)- Absolutely to test MyISAM databases at least once with UFS Direct=ON to see its true writing capacity
4.1. dbSTRESS: First Observations on MySQL5 |
Probe tests with dbSTRESS put me face to some strange scalability issues:
- from the beginning performance increasing with growing workload as expected
- then, after some load level throughput is dramatically slow down...
- CPU is not fully used at all
- no other bottleneck on the system (I/O, network)
- MySQL process jumping in lock waits (seen via Solaris)
- then, with slowing down workload, performance back to normal once critical level is passed...What is abnormal here? well, database expected to scale with growing workload should not jump to 3x times throughput degradation... It may slow down little bit probably, have higher response time, but still keep workload! And we don't see it with MySQL5 here...
Seeking MySQL mail-lists, I've found information about recent fixes in v5.0.32 and higher. On that moment there were only sources of v5.0.36 available for download. So, I've compiled them with Sun Studio 11 with right options (as advised on Sun publications). And it seems to work even better than special 'Cool Staff' v.5.0.22 compiled for T2000...
Well, let's see...
4.2. Test dbSTRESS #1 - MySQL V5.0.36 64bit |
Conditions:
- V890 4CPU US4+ 1800Mhz
- T2000 UST1 8cores 1200Mhz
- Engines: MyISAM, InnoDB
- UFS Direct=OFF
- innodb_flush_log_at_trx_commit=1 (alias: tx)Test execution order:
- MyISAM @V890
- MyISAM @T2000
- InnoDB @V890
- InnoDB @T2000NOTE: I was MUST to add mysql.server restart after each test as sometime database server became frozen and not accepting new connections anymore... As test scenario is executed automatically and I'm human and need to sleep - I prefer to loose one test rather all scenario :))
SysINFO: V890 @STATs dbSTRESS #1
SysINFO: T2000 @
4.3. Test dbSTRESS #2 - MySQL V5.0.36 64bit |
Conditions:
- V890 4CPU US4+ 1800Mhz
- T2000 UST1 8cores 1200Mhz
- Engines: MyISAM, InnoDB
- Direct=ON
- tx=0Test execution order:
- MyISAM @V890
- MyISAM @T2000
- InnoDB @V890
- InnoDB @T2000NOTE: seems to be the best MySQL result here
SysINFO: V890 @STATs dbSTRESS #2 Bon
SysINFO: T2000 @
mysql5.conf @
4.4. Test dbSTRESS #1 - MySQL V4.1.22 64bit |
Conditions:
- V890 4CPU US4+ 1800Mhz
- T2000 UST1 8cores 1200Mhz
- Engines: MyISAM, InnoDB
- Direct=OFF
- tx=1Test execution order:
- MyISAM @V890
- MyISAM @T2000
- InnoDB @V890
- InnoDB @T2000
mysql4.conf @STATs dbSTRESS #1 mysql4
4.5. Investigation on MySQL Scalability... |
Some points:
- MySQL seems to be very sensible on thread *concurrency parameter(s)!
- *concurrency=32 gives probably most optimal throughput on low load, but breaking on high load (even read!)
- *concurrency=8 is more stable on V4 (1400tps), but gives only 800tps on V5 (but very stable :))
- *concurrency=16
- V4: growing until 2500tps on 128usr, slow down to 1400tps on 256usr
- V5: stable with 1300tpsNOTE: probably the most optimal solution here should be to have an external 'connection pool' front-end process which accepts incoming connections likely MySQL server, but opening only, let's say, 128 *real* connections on database server - in way to keep MySQL server still working and maybe just slow down general response time little bit...
NOTE-2: seems the same scalability issue was already observed in other benchmark: http://tweakers.net/reviews/649/6
STATs Test Concurrency=8STATs Test Concurrency=16
Test on V890 with 8CPU (16 cores)STATs Test Concurrency=8 bon
Finally, as last probe, I've executed the same tests on the same V890 but with all 8CPU now. I even not presenting any graphs here, because having twice number of CPU did not change anything on MySQL performance... Both for V5 and V4...
4.6. Execution Plans |
SELECT-2mysql> explain SELECT S.REF AS sref, -> S.NAME AS snm, -> Z.REF AS zref, -> Z.NAME AS znm, -> O.NAME AS onm, -> O.CREATE_DATE AS ocd, -> O.NOTE AS onote -> FROM OBJECT O, -> SECTION S, -> ZONE Z -> WHERE S.REF = O.REF_SECTION -> AND Z.REF = S.REF_ZONE -> AND O.REF = '0000000001'; +----+-------------+-------+-------+-----------------+-----------------+---------+-------+------+-------+ | id | select_type | table | type | possible_keys | key | key_len | ref | rows | Extra | +----+-------------+-------+-------+-----------------+-----------------+---------+-------+------+-------+ | 1 | SIMPLE | O | const | object_ref_idx | object_ref_idx | 10 | const | 1 | | | 1 | SIMPLE | S | const | section_ref_idx | section_ref_idx | 2 | const | 1 | | | 1 | SIMPLE | Z | const | zone_ref_idx | zone_ref_idx | 2 | const | 1 | | +----+-------------+-------+-------+-----------------+-----------------+---------+-------+------+-------+ 3 rows in set (0.44 sec) mysql>
mysql> explain SELECT S.REF AS stref, -> S.NAME AS stnm, -> H.HORDER AS hord, -> H.BEGIN_DATE AS hbeg, -> H.END_DATE AS hend, -> H.NOTE AS hnote -> FROM HISTORY H, -> STAT S -> WHERE S.REF = H.REF_STAT -> AND H.REF_OBJECT = '0000000008' -> ORDER BY H.HORDER; +----+-------------+-------+--------+-----------------+-----------------+---------+-------------------------+------+-------------+ | id | select_type | table | type | possible_keys | key | key_len | ref | rows | Extra | +----+-------------+-------+--------+-----------------+-----------------+---------+-------------------------+------+-------------+ | 1 | SIMPLE | H | ref | history_ref_idx | history_ref_idx | 10 | const | 23 | Using where | | 1 | SIMPLE | S | eq_ref | stat_ref_idx | stat_ref_idx | 3 | db_RAID5_10M.H.REF_STAT | 1 | | +----+-------------+-------+--------+-----------------+-----------------+---------+-------------------------+------+-------------+ 2 rows in set (0.12 sec) mysql>
5. PostgreSQL Benchmark |
It was a long time I did not run any test on PostgreSQL, and it was a good occasion to replay the same test scenario on the latest PgSQL-v8.2.3. As well I was encouraged by the same benchmark article (http://tweakers.net/reviews/649/6) to see by myself how well PostgreSQL scalability is...
5.1. PostgreSQL: Initial Observations |
Initial high network traffic was observed due CURSOR usage in db_STRESS code. Of course fetch row by row is not an optimal way to get SELECT results as fast as possible :) Specially if we want to compare apples to apples - CURSOR was not used for MySQL test implementation. So, I just modified my code to work without CURSOR and network traffic became reasonable...Sync Method choice is quite interesting in PostgreSQL. After trying all of them I sticked with 'open_datasync' as with the most optimal...
High I/O activity really impressed me - at least I was ready to believe all transactions are *really* committed seeing number of disk write I/O operations out-passed or equal to reported by db_STRESS WRITE transactions! To get even more high throughput on my storage I disabled cache mirror between 2 controllers (as we use only one fiber channel it changes nothing on security, but gives a significant speed-up due lower I/O latency)
Deadlocks appearance really killed me... Despite me, but I was far to imagine that 64 concurrent sessions randomly selecting object ID will still have a big chance to access to the *same* ID on the *same* time!... Well, as my goal was not to make things even worse with artificial locking - I've just adapted db_STRESS Injector to increase ID dispersing and ensure each session staying in its own ID list enclosure. If before the it was only: 'ID = random() % MAX_OBJECT_ID + 1', I added following: 'ID= ID - ID % Numb_of_sessions + Session_ID'. However, few questions are still open:
- why do I have deadlocks here? every SQL statement is auto-committed, so cannot lock itself anything else rather currently updated/deleted/inserted row. I've tried to reproduce it manually with several 'plsql' connections - no luck, everything works just fine: session locking row just blocking other and no deadlock happens... Well, I need to get more knowledge in subject to analyze it more in details but next time :))
- NOTE: if I disable INSERT/DELETE in WRITE transaction and do SELECT and UPDATE only - deadlocks disappearing...
- next, why I did not see deadlocks with MySQL?... Is it normal or wrong? Anyway, accessing same data concurrently may slow down or speed-up performance as well, but how to know? just by testing :)
Well, to stay honest till the end, after all these improvement on I/O level and integrating Anti-DeadLock solution, I tried to rerun, of course, previous MySQL tests at least the most hard "Stress RW=1". And yes, there is a difference - MySQL performance level became even worse!... And as it was already bad - I don't want to enforce it, let's keep previously obtained results for MySQL and go ahead with PostgreSQL! :)
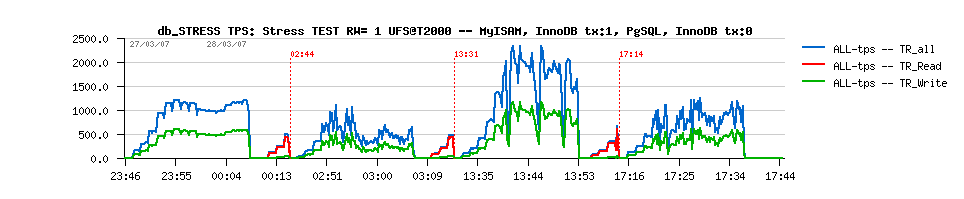
Anyway, following are some RW=1 activity snapshots from various probe tests...
Various Investigation Stress-Test RW=1 STATs
- ReTest: PgSQL +SE3510 speedup
- ReTest: MySQL5 same cond. tx=1 +warm UFS$
- ReTest: MySQL5 tx=0
- ReTest: MySQL4 +warm UFS$
- ReTest: MySQL5 concurrency=32 tx=0 @T2000
- ReTest: PgSQL fsync=fdatasync
- ReTest: PgSQL fsync=open_sync
- ReTest: PgSQL fsync=OFF Direct=OFF
- ReTest: MySQL5 tx=0 concurrency=32 Direct=ON
- ReTest: MySQL5 tx=0 concurrency=16 Direct=ON
- ReTest PgSQL-FF
5.2. Test dbSTRESS PgSQL v8.2.3_32bit |
Conditions:
- V890 4CPU US4+ 1800Mhz
- T2000 UST1 8cores 1200Mhz
- Volumes: 1M, 10M objects
- Direct=OFF
- fsync=ON
- wal_sync_method=open_datasync
- autovacuum=OFF
STATs dbSTRESS PgSQL (bon)
5.3. Test dbSTRESS PgSQL-FF v8.2.3_32bit |
Well, initially I wanted to test the same PostgreSQL version but compiled with Sun compiler and generatin 64bit binaries (Sun Studio 11). However, 64bit version showed me 7 errors in 'make check' test and probably hide some potential errors. So I decided to stay with 32bit binaries, but at least well optimized for SPARC platform. All check tests finished well so far, and as database gave impression to run really faster, to differentiate it from the previous one I just called it 'pgsql-FF' (Fast & Furious) - at least I hope so :))IMPORTANT! previous tests went so well that I discovered another bottleneck on V890 server - its supposed Gbit network card became a simple 100Mbit interface! It's too late to repair it now, but need keep in mind - while V890 is sticking on some performance level need to check network load first! :)
Conditions:
- PostgreSQL: v8.2.3 32bit FF (Fast & Furious :))
- V890 4CPU US4+ 1800Mhz
- T2000 UST1 8cores 1200Mhz
- Volumes: 1M, 10M objects
- Direct=OFF
- fsync=ON
- wal_sync_method=open_datasync
- autovacuum=OFF
STATs dbSTRESS PgSQL-FF @T2000STATs dbSTRESS PgSQL-FF @V890
postgresql.conf @STATs dbSTRESS PgSQL-FF @T2000
5.4. Test dbSTRESS PgSQL-FF v8.2.3_32bit +Autovacuum @T2000 |
Conditions:
- PostgreSQL: v8.2.3 32bit FF
- T2000 UST1 8cores 1200Mhz
- Volumes: 10M objects
- Direct=OFF
- fsync=ON
- wal_sync_method=open_datasync
- autovacuum=ON
STATs dbSTRESS PgSQL-FF +Autovacuum @T2000
5.5. Test dbSTRESS PgSQL-dev v8.2 |
Seeing in mail-lists there is sometime a significant performance difference between current and development release - I also compiled a pgsql8.2-dev and run final tests with it. I don't present any data here because there was no significant difference in results. Just vacuum processing gave me an impression to run faster, but probably just because I was too tired? :)
5.6. Execution Plans |
Notes:
- SELECT queries were quite CPU intensive on server side (probably there is something to do)
- I also tried some tests with 'enable_hashjoin=off' and it was not better
- probably more optimal plan may be forced...
SELECT-2b_PGSQL_R5_1M=# explain analyze SELECT S.REF AS sref, db_PGSQL_R5_1M-# S.NAME AS snm, db_PGSQL_R5_1M-# Z.REF AS zref, db_PGSQL_R5_1M-# Z.NAME AS znm, db_PGSQL_R5_1M-# O.NAME AS onm, db_PGSQL_R5_1M-# O.CREATE_DATE AS ocd, db_PGSQL_R5_1M-# O.NOTE AS onote db_PGSQL_R5_1M-# FROM OBJECT O, db_PGSQL_R5_1M-# SECTION S, db_PGSQL_R5_1M-# ZONE Z db_PGSQL_R5_1M-# WHERE S.REF = O.REF_SECTION db_PGSQL_R5_1M-# AND Z.REF = S.REF_ZONE db_PGSQL_R5_1M-# AND O.REF = '0000000001'; QUERY PLAN ----------------------------------------------------------------------------------------------------------------------------------------------- Nested Loop (cost=8.43..12.22 rows=1 width=254) (actual time=0.546..0.633 rows=1 loops=1) -> Hash Join (cost=8.43..11.82 rows=1 width=210) (actual time=0.474..0.558 rows=1 loops=1) Hash Cond: (s.ref = o.ref_section) -> Seq Scan on section s (cost=0.00..3.00 rows=100 width=56) (actual time=0.057..0.099 rows=100 loops=1) -> Hash (cost=8.42..8.42 rows=1 width=160) (actual time=0.184..0.184 rows=1 loops=1) -> Index Scan using object_ref_idx on "object" o (cost=0.00..8.42 rows=1 width=160) (actual time=0.175..0.177 rows=1 loops=1) Index Cond: (ref = '0000000001'::bpchar) -> Index Scan using zone_ref_idx on "zone" z (cost=0.00..0.39 rows=1 width=50) (actual time=0.066..0.067 rows=1 loops=1) Index Cond: (z.ref = s.ref_zone) Total runtime: 3.038 ms (10 rows) db_PGSQL_R5_1M=#
db_PGSQL_R5_1M=# explain analyze SELECT S.REF AS stref, db_PGSQL_R5_1M-# S.NAME AS stnm, db_PGSQL_R5_1M-# H.HORDER AS hord, db_PGSQL_R5_1M-# H.BEGIN_DATE AS hbeg, db_PGSQL_R5_1M-# H.END_DATE AS hend, db_PGSQL_R5_1M-# H.NOTE AS hnote db_PGSQL_R5_1M-# FROM HISTORY H, db_PGSQL_R5_1M-# STAT S db_PGSQL_R5_1M-# WHERE S.REF = H.REF_STAT db_PGSQL_R5_1M-# AND H.REF_OBJECT = '0000000008' db_PGSQL_R5_1M-# ORDER BY H.HORDER; QUERY PLAN -------------------------------------------------------------------------------------------------------------------------------------------------- Sort (cost=10258.57..10268.72 rows=4060 width=191) (actual time=122.266..122.269 rows=20 loops=1) Sort Key: h.horder -> Hash Join (cost=34.50..10015.23 rows=4060 width=191) (actual time=9.184..122.089 rows=20 loops=1) Hash Cond: (h.ref_stat = s.ref) -> Index Scan using history_ref_idx on history h (cost=0.00..9924.75 rows=4101 width=147) (actual time=6.897..119.760 rows=20 loops=1) Index Cond: (ref_object = '0000000008'::bpchar) -> Hash (cost=22.00..22.00 rows=1000 width=51) (actual time=2.209..2.209 rows=1000 loops=1) -> Seq Scan on stat s (cost=0.00..22.00 rows=1000 width=51) (actual time=0.057..1.067 rows=1000 loops=1) Total runtime: 122.374 ms (9 rows) db_PGSQL_R5_1M=#
6. Oracle Benchmark |
Speaking about databases, may we miss Oracle?.. No! :)))
But may we speak about?... No! :((([skip] Oracle results are removed due Oracle license restrictions [/skip]
7. SUMMARY-1 : db_STRESS@UFS |
Why these graphs instead of final table with avg TPS grouped by test, etc. Well, as you may see on graphs - database performance is rarely staying on the same activity even generating workload is. So, saying just we have 1500 TPS in avg is only part of truth if TPS level jumping all the time between 1000 and 2000...
7.1. Stress Test |
db_STRESS Conditions:
- Database volume: 10M objects (200M history), 60GB avg.
- Think time: 0 sec
- Transactions: READ + WRITE (RW=1)
- Progressively growing load: from 1 session to 256 (x2 step, eg: 1, 2, 4, 8 ... 256, 128, 64, 32)
PgSQL Results @
7.2. 1600 users Test |
db_STRESS Conditions:
- Database volume: 10M objects (200M history), 60GB avg.
- Think time: 1 sec
- Transactions: READ + WRITE (RW=1)
- Progressively growing load: from 50 session to 100, 200, 400 ... 1600, then decreasing
PgSQL Results @
7.3. Deadlock Mystery |
I rarely met any mystery in computer science related topics, but even if I met some - with a time usually me or others finished to find a rational explanation for all mystery events...
So, what about these deadlocks coming from atomic auto-committed transactions?
Let's analyze point by point:
- First of all, even my randomization of references is quite good (I even done some additional test just to check it), there is still a high probability one of 256 concurrent sessions will choose the same reference as another one (in range between 1 and 10.000.000 !)...
- Now, what will happens if there are 2 users coming on the same time with the same reference ID in WRITE transaction: DELETE will pass for both (but only one will really delete one row), INSERT also will pass for both AND they will insert TWO(!) rows into the database! then UPDATE will pass also, just second will wait little bit for lock probably...
- And now important: row retrieving order is not guaranteed in DELETE and UPDATE operation (there is no ORDER BY clause for them)
- Having now 2 rows with the same reference in the database, what will happens now if once more again 2 users come back as before: DELETE operation may deadlock just because the user1 retrieved first row (row-1) first and user2 retrieved first the second row (row-2); then user2 wants to delete row-1 and user1 wants row-2; and we have deadlock! :)
- Other scenario: more than 2 users coming on the same time with the same reference ID and there is only one single row yet having this ID in the database; in this case users will made a wait queue locking each other, but no deadlock yet; then the most lucky will leave this queue trying to execute UPDATE while less lucky user will start only its first DELETE, and(!) between them there will be others successfully executed their INSERT (means more then one row again) - and UPDATE entering into deadlock with DELETE!...
- This situation may be easily resolved by:
- putting DELETE+INSERT into the same single transaction
- use SELECT ... ORDER BY ... FOR UPDATE within DELETE and UPDATE transactions
- or just keep UNIQUE constraint on the reference index and ignore INSERT duplications
- BUT for the moment I prefer to keep it as it to simplify database servers compare...
- Probably in next db_STRESS version I'll just more options covering this issue :))
8. FINAL SUMMARY: db_STRESS@UFS - Apples to Apples |
Due some further findings as well once have clear idea about deadlock origin, I've decided to replay ALL tests within the same test conditions and using the same injector code. The results are quite surprising, specially for MySQL...
8.1. ReTEST db_STRESS @UFS on T2000 |
Quite interesting results:Note:
- well, if you have a habit to meet customers having some performance problems one day, you may find they all have at least on thing in common: all of them generally claim they did not change NOTHING! :))
- but next joke is I'm in the same situation with myself, and I'm SURE I changed nothing :))
- but numbers are not really the same as I've seen before:
- MySQL5 tx=1: lost 50% of its previous performance level
- MySQL5 tx=0: lost 40% in performance, seems Anti-DeadLock feature removed some part of locking in InnoDB and processing became more stable, but still with significant slow down on the top level of workload...
- PostgreSQL: lost 20% in performance
- Oracle: at least this one is still the same as before
- tx is an 'innodb_flush_log_at_trx_commit' MySQL configuration parameter (possible values are: 0, 1, 2; see mysql doc for more details)
- tx=0 means log flush for each commit
- tx=1 means single grouped log flush for all commits every 1 second (and there are real customers using this setting in production!) what's important: all commit requests will be confirmed to all transactions to in that point while data were still not flushed to disk, so there is a price to pay to loose transactions within the last second...
- PostreSQL also has a feature with commit regrouping, but will never confirm commit to any transaction before real flush. Of course, this approach is very professional, no doubt! But probably for customers agreed to loose some transactions per crash there may be additional option? ;)
Also: even read-only performance level (RW=0) is quite curious comparing MySQL vs PostgreSQL:
- until 64 concurrent users MySQL is far out-passing PostgreSQL
- then PostgreSQL still continues to increase throughput then stick on higher level and keep it until the end of test, while MySQL just follows down decreasing performance level...
- analyze with 'plockstat' showing a high internal locking contention on MySQL (self-related to its engine, as all other possible external locking (like multi-threaded malloc, LWP scheduling, etc.) were already fixed before...
UFS Test: apples to apples |
TPS Stress TEST @UFS (without Oracle)
UFS Test: Detailed STATs |
db_STRESS @UFS STATs - MySQL5 MyISAM @T2000
db_STRESS @UFS STATs - MySQL5 InnoDB tx=1 @T2000db_STRESS @UFS STATs - MySQL5 MyISAM @T2000
db_STRESS @UFS STATs - MySQL5 InnoDB tx=0 @T2000db_STRESS @UFS STATs - MySQL5 InnoDB tx=1 @T2000
db_STRESS @UFS STATs - PostgreSQL @T2000db_STRESS @UFS STATs - MySQL5 InnoDB tx=0 @T2000
db_STRESS @UFS STATs - PostgreSQL @T2000
9. Suspended Questions: More lights... |
Few questions were still suspended or unclear at the end of tests, and before to free used hardware for another project, I got a time to run some additional tests to get more lights on following topics:
- How much performance may increase if I split DATA and REDO/LOG on two different SE3510 boxes?
- Why UFS Direct I/O option did not help Oracle?
- May I get any speed-up with Direct I/O on PostgreSQL?
- etc.
Well, time was limited, so there in no full answers :))
9.1. Some Oracle points |
First of all let's see if there is any performance gain is still possible with Oracle:
- db_STRESS response time is already quite stable on all WRITE operations
- Only SEL2 response time is increased with growing load - it happens due growing CPU usage on Injector host
- Injector uses CPU so much because Oracle client implementation is relatively heavy (DECLARE, BIND, OPEN, FETCH, ... - too much instructions to get data, and it already uses fetch arrays). But is there a real problem to have heavier client code? In case of hundreds/thousands remote desktops - no; in case of application server - probably yes, but all you'll need is just to put a more powerful server, that's all (as me - my Injector is simply missing power to overload Oracle)...
- But we still may decrease SEL2 time by increasing WRITE times, let's see :)
Test 2xSE3510: So, I'm going just to split DATA and REDO files into 2 different storage boxes:
- I/O load is more comfortable
- TPS level is still limited by InjectorTest 2xSE3510 and REDO-direct: Same configuration, just REDO filesystem is mounted in Direct mode:
- full disaster! it simply killed inserts!...
- I'm happy it's not a production system :))
- and I don't have time anymore to understand why...Test 2xSE3510 and DATA-direct: Only DATA filesystem is mounted in Direct mode:
- wow, we out-passed previous Oracle result!
- TPS level now is limited by both Oracle and Injector CPU usage
- I think we reached the max performance level now! :))
9.2. Some PostgreSQL points |
Same here, let's see first if there is still possible any performance gain:
- db_STRESS response time is less or more stable on all READ operations
- WRITE response times are increasing with growing load - I suppose single LOG writer limitation
- As well general writing may be under performed as there is only one data writer process (by design)
- Should we switch to Direct IO here? as I already saw before, PostgreSQL TPS result depends a lot of filesystem cache (as I compiled only 32bit version successfully, buffers size is limited to 4G). So probably switching only LOG filesystem alone may help little bit (BTW, QFS filesystem should be excellent here as it can combine on the same time Buffered-READ and Direct-WRITE!)
- Another point interested me as well - by default LOG block size in PgSQL is equal to 8K. Will LOG writer work faster if it'll use 1K blocks?...
- Also, commit_delay option is very interesting...
Test 2xSE3510: Same here, I'm going just to split DATA and LOG files into 2 different storage boxes:
- I/O load is more comfortable, service time on LOG is correct
- CPU is not yet fully used on both servers, run queue is low...
- seems TPS level is only limited by PostgreSQL I/O design here...Test 2xSE3510 and LOG-direct: Same configuration, just LOG filesystem is mounted in Direct mode:
- TPS result is better!Test 2xSE3510 and LOG-blocksize=1K: Same configuration, LOG filesystem is mounted in Direct mode:
- Well, no gain here... :)
- Storage/System protocol seems to eat possible latency gain :)Test 2xSE3510 and commit_delay=1ms: Same configuration, DATA + LOG buffered:
- parameters: commit_delay= 1000, commit_siblings= 50
- Well, no gain here, performance is even worse...
- The main point here is even if COMMIT is delayed, TRANSACTION waiting for it will still wait (not like tx=0 in MySQL)...
- Knowing we have customers restoring night data snapshot in case of database crash during the day - why not create an exception here and allow delayed COMMIT without delaying TRANSACTION?...
PostgreSQL Additional Tests STATs
9.3. RAID1 or RAID5? |
There was no significant difference for all database vendors initially, and as I have quite limited time to run all benchmark cases - I've limited my tests mostly to RAID5...