MySQL Performance : 8.0 and UTF8 impact
The world is moving to UTF8, MySQL 8.0 has utf8mb4 charset as default now, but, to be honest, I was pretty surprised how sensible the "charset" related topic could be.. -- in fact you may easily
hit huge performance overhead just by using an "odd" config settings around your client/server charset and collation. While to avoid any potential charset mismatch between client and server, MySQL
has from a long time an excellent option : "skip-character-set-client-handshake" which is forcing any client connection to be "aligned" with server settings ! (for more details see the ref. manual :
https://dev.mysql.com/doc/refman/8.0/en/server-options.html#option_mysqld_character-set-client-handshake) -- this option is NOT set by default (to leave you a freedom in choose of charsets used on
client and server sides). However, in my sense, it's still better to align clients according to the server settings to avoid any potential client misconfig..
As well if you wish to use UTF8, please use "utf8mb4" as first of all it's the most complete for any kind of characters (and probably the only one which makes sense as of today), and second --
its related code was yet more improved in MySQL 8.0 for better efficiency. How much more efficient ? -- let's see from the following test results.
but first of all, the related config setup :
character_set_server=utf8mb4
collation_server=utf8mb4_0900_ai_ci
skip-character-set-client-handshake
sort_buffer_size=512K
NOTE: mind to use a bigger sort buffer for UTF8
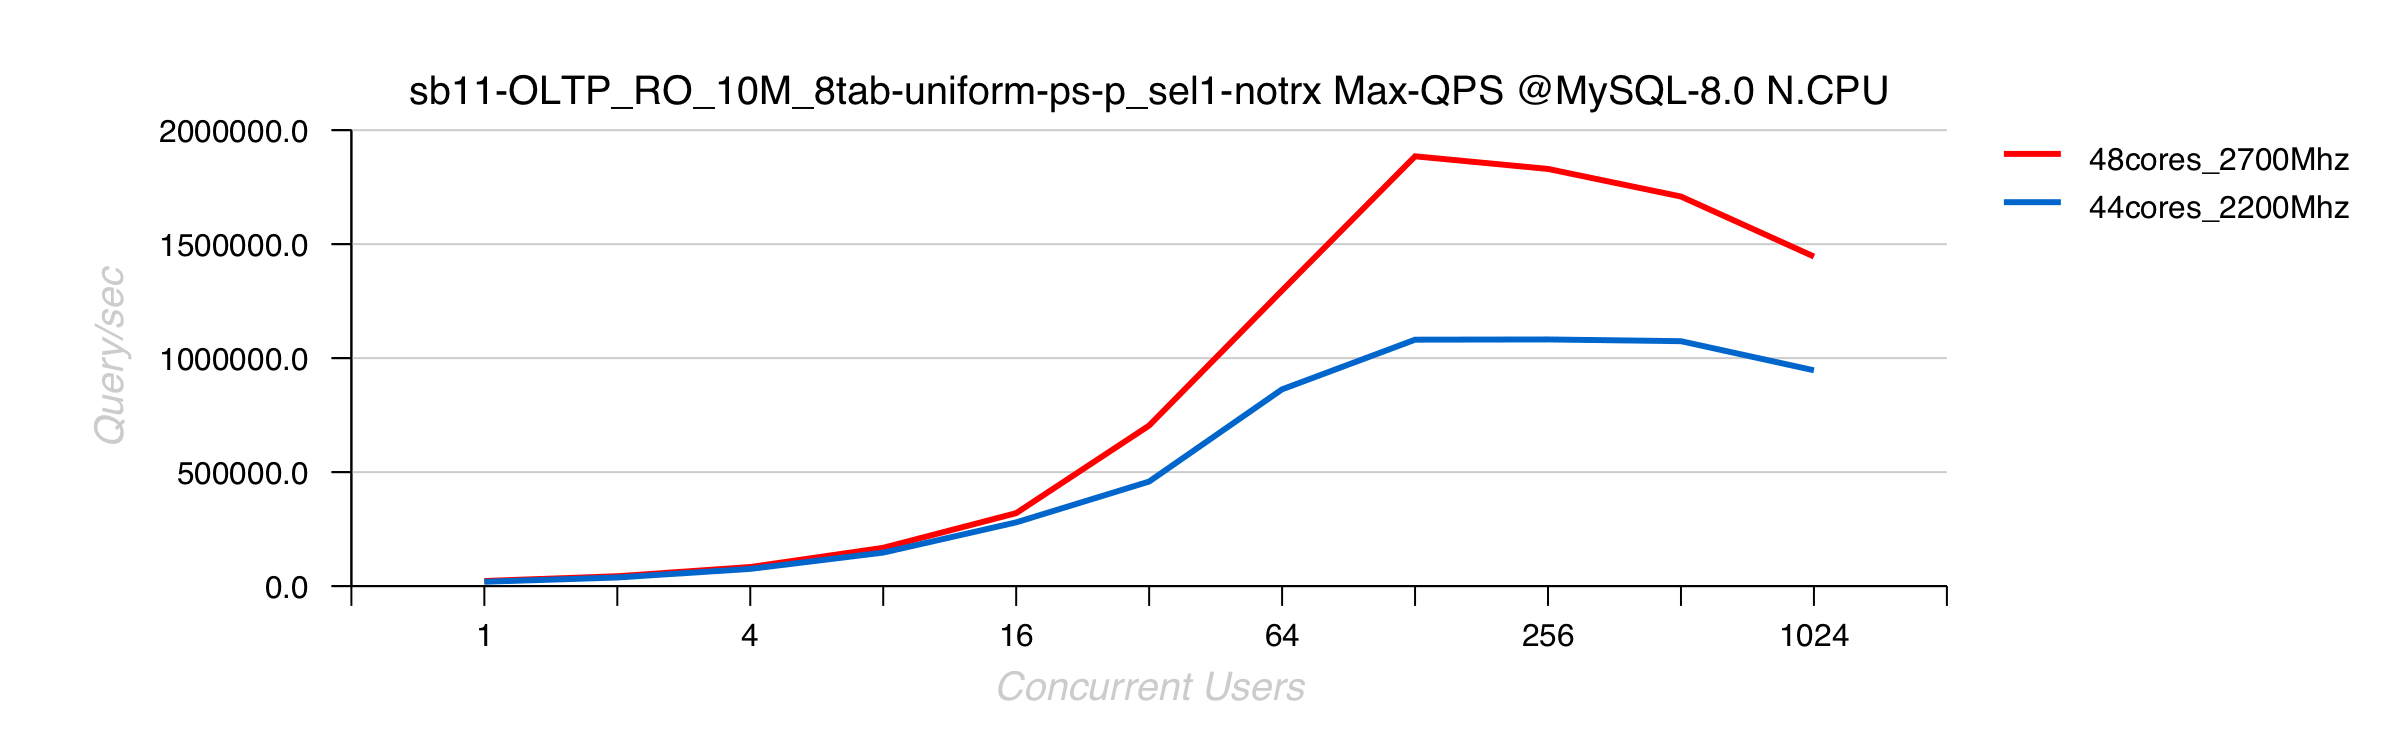
The results are obtained with on the same 2S Skylake as in the previously published RO tests with latin1 and with the same test workloads (just that for latin1 you
need to change character_set_server= latin1 and collation_server= latin1_swedish_ci)
So far, here we are :