« MySQL Performance: Analyzing Benchmarks, part-1 : MySQL 5.6 and MariaDB 5.5 | Main | Speaking at MySQL Tech Tours @Paris »
Thursday, 28 February, 2013
MySQL Performance: Analyzing Benchmarks, part-2 : MDL contentions and PFS overhead in MySQL 5.6
Following the previous post, this article is focused on performance problems reported by Mark Callaghan during MySQL 5.6 GA testings, which was initially about MDL contentions, and then also Performance Schema (PFS) overhead observed within the same OLTP Read-Only workload..
Let's split these 2 problems in 2 parts, and start with MDL related
contentions first.
MDL in MySQL 5.5 and 5.6
What is MDL?.. - I'm strongly inviting you to read Dmitry Lenev's comments within the same bug report to get familiar with MDL feature and its implementation design (http://bugs.mysql.com/bug.php?id=66473)
Quoting Dmitry Lenev:
"First of all I would like to emphasize that MDL was added to solve some problems with correctness of isolation between normal transactions and DDL, like infamous MySQL bug #989. It is not a replacement for the Table Definition Cache and its mutexes/locks are not a replacement for LOCK_open (though it has allowed to reduce the size of some of LOCK_open's critical sections).
So it should be expected that this new synchronization mechanism introduces some extra overhead compared to 5.1. Especially in the case with just 1 connection since in this case the new synchronization layer just adds a pure overhead...."
And then continue with MySQL 5.5 documentation
(while I think that this chapter should be extended with details given
by Dmitry Lenev in the bug report) and there are several real-life
examples pretty well explained in Ovais article.
In
short:
- MDL is must to have feature in MySQL!
- but from performance point of view it represents a pure additional overhead..
Let's get a more close look on this MDL related performance overhead:
- so, first of all additional code is executed on every MDL access
-
then additional synchronization code is used during MDL operation
(read: potential contentions)
- every MDL_lock data are protected by RW-lock
- all MDL_lock entities are living in a HASH
- any acces to a HASH requiring MDL_map mutex lock..
- so, as long as your queries are taking time, or bringing many rows, or living inside of transactions with several queries -- you may even not remark any "contention" related MDL overhead (specially if you're hitting more hot locks like it was in MySQL 5.5)..
- however, as soon as you're running very short and very fast queries, you're starting to hit MDL_map mutex contention on every query! (e.g. on every table access)
- and what is fun: until you're having only one table "hot", contentions ratio between MDL_map mutex and MDL_lock rw-lock will be less or more equal (we're not keeping both on the same time, while every concurrent session will need to acquire a lock on the same MDL_lock for every query (as they are all accessing the same "hot" table))..
- but if you're having several(!) "hot" tables, then MDL_map lock becomes a real problem, as it'll be a single point entry to many MDL_lock entities (as there are several "hot" tables)...
And it's exactly what Mark observed when reported initially in his bug report - using Sysbench OLTP RO Point-Selects scenario with 8 tables bombarded by many concurrent users..
NOTE: of course, this contention became visible in MySQL 5.6 only since all other contentions were already lowered ;-)
But well, this bug was reported in Aug.2012 and fixed in Sep.2012 (Dmitry Lenev) by introducing of a new configuration option: metadata_locks_hash_instances. Which is giving a possibility to split initial single hash entry (protected by a single MDL_map mutex) into several ones - "hash instances" (8 by default), each one protected now by its own MDL_map mutex. The choice of which hash instance should be used for a given "object" (here: table) was delegated to my_hash_sort_bin() function and based on the "object" name. In short for the given bug report case:
my_hash_sort_bin( "db_name.table_name" ) % metadata_locks_hash_instances ==> index of hash instance to use
And I was able to test this solution, confirm obtained performance improvements, and even present the results during MySQL Connect conference ;-))
So, what happened wrong since then, if Mark re-opened again the same bug in Feb.2013?.. - for out big surprise, according Mark's test results the bug was still here... While Mark used only 8 tables in his test and there was already 8 hash instances in MySQL 5.6 GA configured even by default..
Thanks to PFS (yes, Performance Schema again), we were able to understand the real source of the problem.. - and I'd say it was tragical and comical on the same time ;-)) -- for some unknown reason the famous my_hash_sort_bin() function gave very closer keys for different table names Mark used in his test... - As a result, always the same hash instance was used for all tables, likely there was only one single hash instance as it was before... Lack of luck? ;-) -- another hash function taken from InnoDB code worked just perfectly with Mark's table names.. (while my_hash_sort_bin() did not get any trouble to dispatch my table names ind different hash instances too ;-))... So, don't know how much InnoDB hash function will be better for a "final" solution, because hash key is hash key -- even completely different table names may still come with pretty close key numbers (and Dmitry is working on yet more improved solution).. But for a time being, if you're hitting MDL_map mutex contention, just think to increase the default metadata_locks_hash_instances=8 value to something more big (like 256 worked better for Mark).
Now, how to know that you're hitting a non-equilibrated access to your hash instances?
A simple PFS query (yes, again Performance Schema! ;-)) gives you the answer :
mysql> select event_name, count_star from events_waits_summary_by_instance
         where event_name like '%mdl%mutex%';
+-------------------------------------+------------+
| event_name                          | count_star |
+-------------------------------------+------------+
| wait/synch/mutex/sql/MDL_map::mutex |    2840960 |
| wait/synch/mutex/sql/MDL_map::mutex |    2767663 |
| wait/synch/mutex/sql/MDL_map::mutex |    2777470 |
| wait/synch/mutex/sql/MDL_map::mutex |    2835248 |
| wait/synch/mutex/sql/MDL_map::mutex |    2850254 |
| wait/synch/mutex/sql/MDL_map::mutex |    2766048 |
| wait/synch/mutex/sql/MDL_map::mutex |    2796438 |
| wait/synch/mutex/sql/MDL_map::mutex |    3004758 |
+-------------------------------------+------------+
8 rows in set (0.00 sec)
And as you can see from the output, it was pretty ok for me with my 8
tables and default 8 hash instances ;-)
(if the difference between
counter values is bigger, think to increase the
metadata_locks_hash_instances setting, but be sure first that MDL_map
mutex contention is present and remains significant, otherwise
increasing a number of metadata_locks_hash_instances will not give you
any visible improvement)..
Let's see now how big may be the
impact of such a lock contention.
For the following test I've
used a "true" 12cores server, which seems to be very similar to Mark's
server:
- 12cores-HT 2.9Ghz, 96GB RAM
- OEL6.2
- MySQL 5.6 GA
- Sysbench 0.4.13 OLTP_RO Point-Selects scenario with 8 tables
Let's start with a small number of concurrent users (8-32):
Impact MDL hash instances = 8 vs 1 :
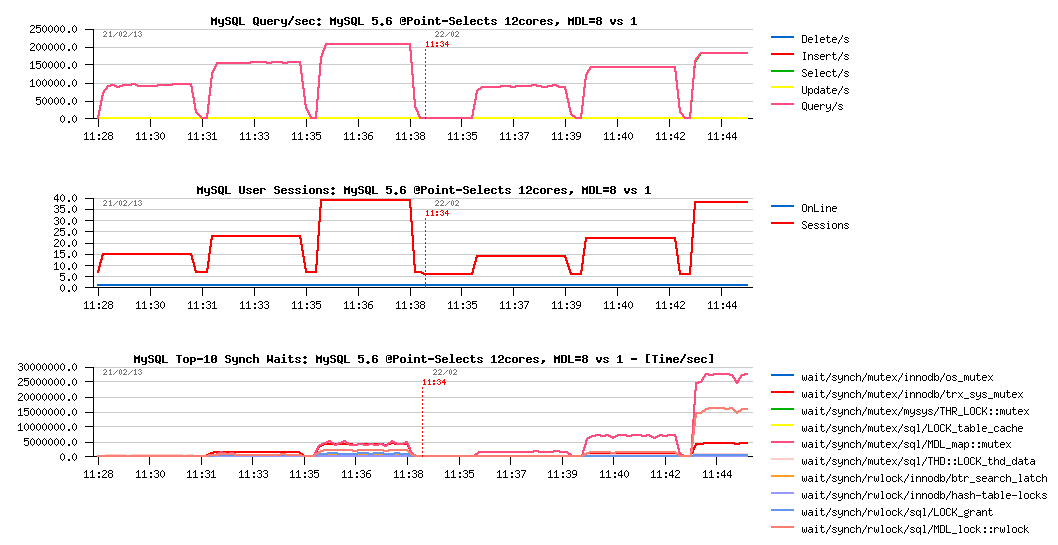
Observations :
- So, the left part of graphs representing the results with metadata_locks_hash_instances=8, while the right with metadata_locks_hash_instances=1 (like it was initially, and showing what Mark should observe in his tests last year and this year once again ;-))
- as you can see, the real impact in performance is only seen since 32 concurrent users (~210K QPS vs 185K QPS)
- and the difference in MDL mutex wait times reported by PFS (yes, again ;-)) is simply spectacular..
And as we're speaking about monitoring, and if you're still have some doubts in PFS power, let me show you something.. - the following graphs are corresponding to the same workload, but now with the same QPS levels you'll also see lock waits reported by InnoDB and waits events/sec (not time!) reported by PFS:
Monitoring on MDL hash instances = 8 vs 1 :
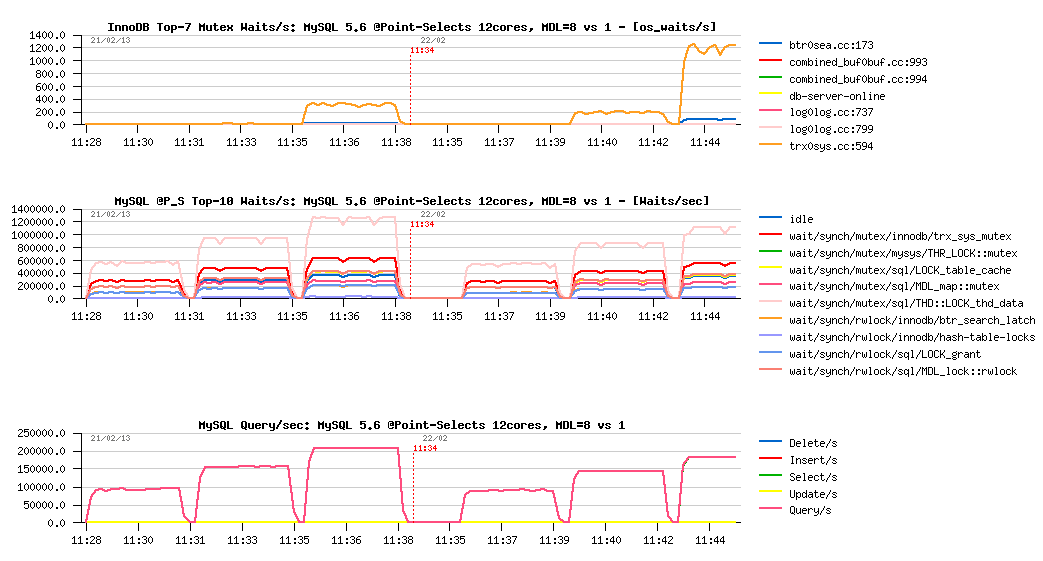
Observations :
- from the InnoDB lock waits report you may see that the number of waits/sec on trx_sys mutex decreased when metadata_locks_hash_instances setting was changed from 1 to 8, right?..
- however, only PFS gives you the right answer on the graph before (with time waited per second) -- you can see that in both test cases the waited time on trx_sys mutex remained exactly the same!
- and looking on the graph above with PFS reported waits/sec you may see that trx_sys mutex is more often involved when metadata_locks_hash_instances=8 is used (which is as expected, as we're obtaining a higher QPS)..
- BTW, from the same graph you may see that instrumentation code on locks is executed several millions times/sec, so, of course, impossible to have it with zero overhead..
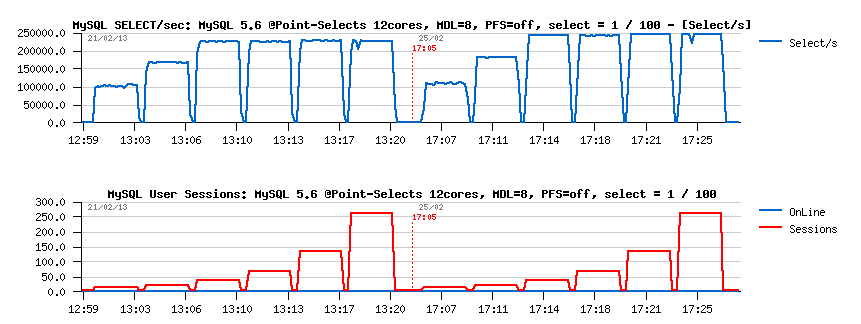
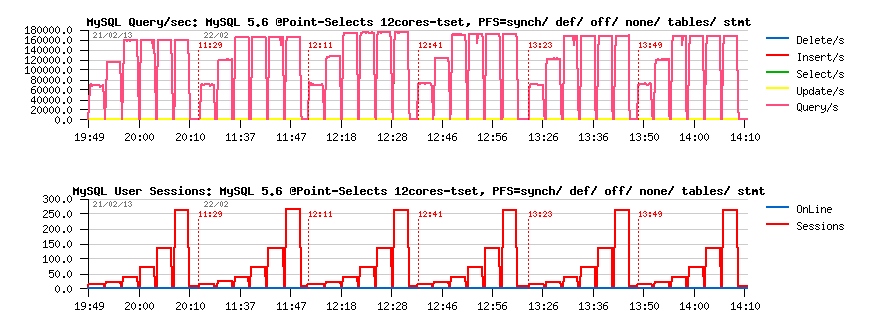
Let's get a full picture now of the same test, but with 8 to 256 concurrent users now:
MySQL 5.6 Point-Selects @12cores, MDL hash instances = 8 vs 1 :
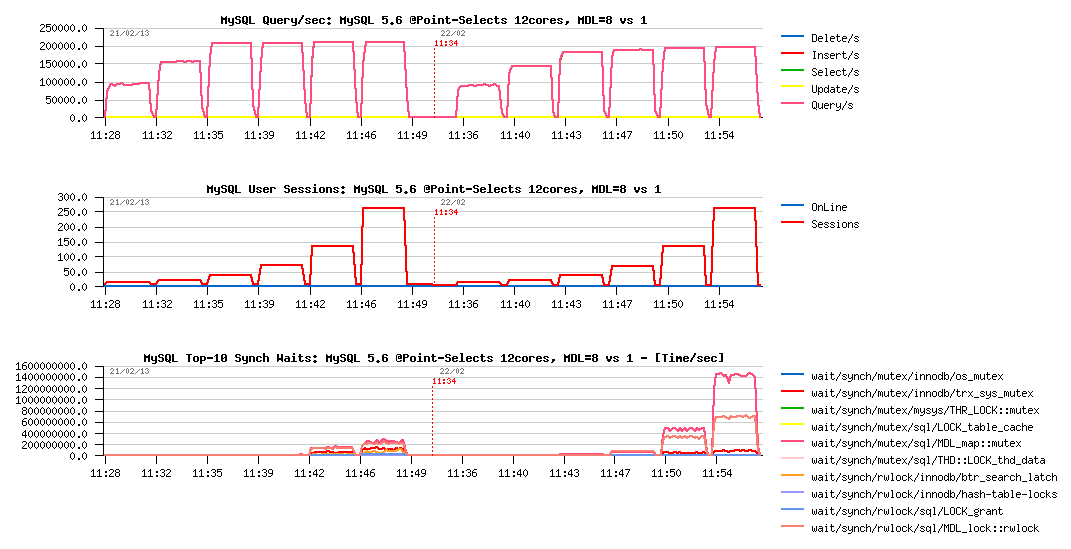
Observations :
- despite high contention on MDL_map mutex with metadata_locks_hash_instances=1, it's still reaching 200K QPS at the end of the test..
- however, metadata_locks_hash_instances=8 is giving us stable 210K QPS since 16 and up to 256 concurrent users
What will be the "final" result now if I'll disable PFS? (and as the discussion about 5.6 vs 5.5 performance also in the air currently, let's include MySQL 5.5 results on the same graph too):
Comparing MySQL 5.6 MDL hi= 8 / 1, MySQL 5.5, PFS=off :
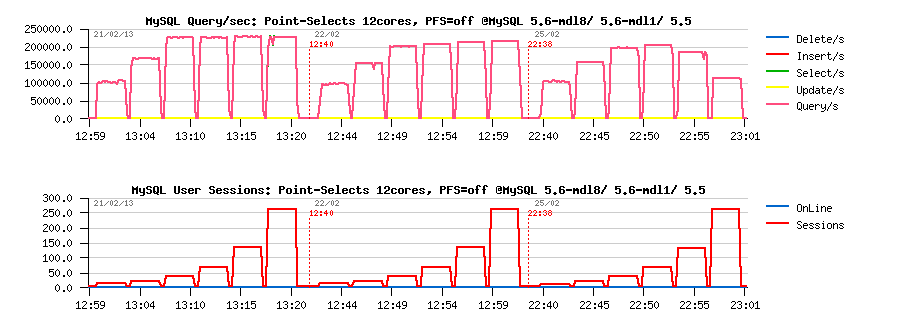
Observations :
- so far, MySQL 5.6 with metadata_locks_hash_instances=8 reaching 230K QPS
- with metadata_locks_hash_instances=1 - 220K QPS
- and MySQL 5.5 is getting 205K QPS..
- interesting that MySQL 5.6 with metadata_locks_hash_instances=8 results become already better than MySQL 5.5 since 16 concurrent user sessions..
- as well we may note 9% PFS overhead between PFS=off and PFS=synch setting (synch: when all synch event instrumentation is enabled (mutexes, rw-locks, etc. - in fact the most "heavy" instrumentation))
And to finish with MDL, let's see how far we may go by lowering MDL locks even more... - to do this all we need is just to keep in mind that within a transaction MDL lock for the same table is acquired only once (and not for every query as in auto-commit)..
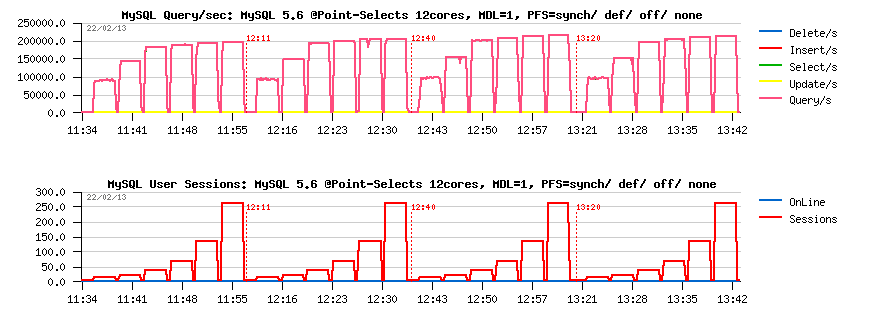
So, I'll just change Sysbench option to execute 100 Point-Selects queries within a single transaction (instead of one query in auto-commit).. - and here is the result:
Going further with MDL :
Observations :
- as you can see, instead of 230K QPS before we're getting 250K QPS now!
- and probably it's the max for this server, as it also lowered trx_sys mutex contention as well, and the hottest wait time moved to GRANT lock.. pretty fun ;-)
Hope everything is clear so far with MDL locking, and let's get a look now on PFS overhead..
PFS Overhead in MySQL 5.6
Before even start to discuss about, let me bring your attention to the article I've intentionally published last year about the Game of contentions - this show you by example that there is no "pre-defined" PFS overhead.. - as soon as you're hitting internal lock contentions within MySQL server code or InnoDB engine, you cannot say that PFS overhead will remain on some expected level.. - All depends which levels of instrumentation you've enabled, and which level of MySQL code you're touching..
Last year I've observed not more than 5% overhead on various test workloads when PFS was enabled by defaults (like it's today in MySLQ 5.6 GA). However, MySQL 5.6 performance was yet more improved since then, means PFS instrumentation code is executed yet more often too.. - so, when you're reaching a peak QPS level, and your performance is limited by internal MySQL contentions, then PFS overhead will be the most visible.. However, you may always go step by step, and enable PFS instrumentation according your needs.
On the tested workload Mark reported 10% overhead between PFS=off and PFS=def (default) configs.. Let's see what I'm obtaining on my server on the same tests.
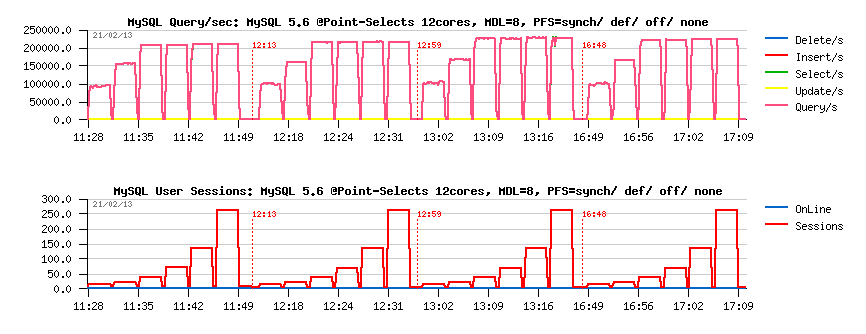
let's get a look on "initial" PFS overhead (before the fix with hash instances, like metadata_locks_hash_instances=1):
PFS overhead, MDL hash instances =1 :
Observations :
- the first test is executed with PFS=synch (mutexes, rw-locks, plus all "default") : 200K QPS
- then with PFS=def (just default instrumentation enabled) : 205K QPS
- then PFS=off : 220K QPS
- then with PFS=none (PFS is enabled, but all instrumentation disabled) : 215K QPS
- so, the difference in QPS levels is: 200K -vs- 205K -vs- 220K -vs- 215K
-
and regression comparing to PFS=off:
- PFS=synch : 10%
- PFS=def : 7%
- PFS=none : 2%
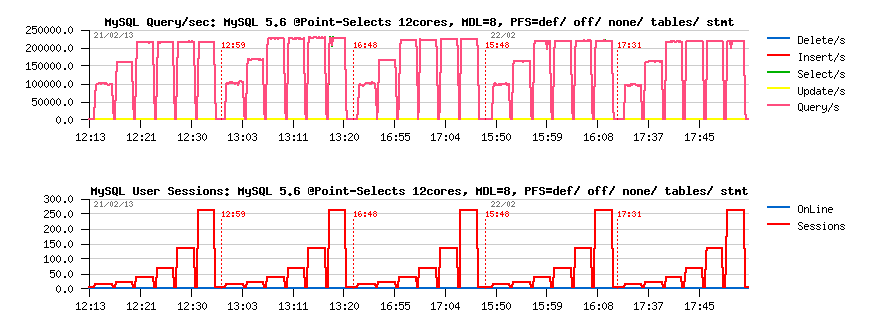
What is changing when MDL lock contention is lowered (with metadata_locks_hash_instances=8)
PFS overhead, MDL hash instances =8 :
Observations :
- here PFS=off performance is 230K QPS
-
so, the overhead vs PFS=off:
- PFS=synch : 9.5% (210K QPS)
- PFS=def : 4.5% (220K QPS)
- PFS=none: 2% (225K QPS)
As you can see, PFS regression is decreasing as far as we're fixing internal MySQL code contentions ;-)
And performance level of PFS=def with metadata_locks_hash_instances=8 is equal now to metadata_locks_hash_instances=1 and PFS=off.. - just think about ;-))
However, let's go more in details of the PFS=def overhead. In fact, by default we're enabling tables+I/O related and statements related PFS instrumentations (all can be dynamically disabled/enabled at any moment), but what is the overhead of each one alone?..
PFS=def overhead details, MDL hash instances = 8 :
Observations :
- PFS=off : 230K QPS
-
overhead vs PFS=off:
- PFS=def : 4.5% (220K QPS)
- PFS=none : 2% (225K QPS)
- PFS=tables: 3% (223K QPS)
- PFS=statements : 3% (223K QPS)
So, as you see, you can keep PFS overhead as low as 2% and still have PFS in "enabled" state.. Then enable on demand tables/IO or statements instrumentation for 3% overhead.. (or keep enabled for 3%, or both for 4.5%, etc.) - As you see, you have several options ;-)
NOTE: PFS collecting most of the data "lock free" (most of collected data are saved within user thread local data) -- this is avoiding any potential contentions on instrumentation code itself. But when you're requesting these data via PFS query, these data should be summarized before printed, so such a request will easily monopolize one CPU core on your server during execution (even for a short period), so try to avoid to send several PFS queries on the same time ;-)
However, I did not meet 10% PFS=def overhead reported by Mark.. - let's try replay the same test case on a different server. I'll try to reproduce the same issue by keeping MySQL server running within a 12cores taskset on 32cores server.
Config:
- 32cores-HT 2300Mhz
- OEL 6.2
- MySQL 5.6 GA running within 12cores-HT taskset, metadata_locks_hash_instances=8
-
Sysbench 0.4.13 Point-Selects 8 tables workload
- running within the same 12cores taskset as MySQL server
- running on all 32cores
PFS overhead @12cores-HT taskset, Sysbench on the same 12cores :
Observations :
- PFS=off performance is 178K QPS..
-
overhead vs PFS=off :
- PFS=sync : 11% (160K QPS)
- PFS=def: 6.5% (167K QPS)
- PFS=none : 2% (174K QPS)
- PFS=tables : 4.7% (170K QPS)
- PFS=statements : 4.7% (170 QPS)
PFS overhead @12cores-HT taskset, Sysbench on all 32cores :

Observations :
- PFS=off performance is 220K QPS..
-
overhead vs PFS=off :
- PFS=sync : 10% (200K QPS)
- PFS=def: 6% (207K QPS)
- PFS=none : 2% (215K QPS)
- PFS=tables : 4% (211K QPS)
- PFS=statements : 4.7% (210 QPS)
So far, PFS overhead is slightly bigger on this server for some reasons.. (probably its higher sensibility to cache coherency playing a role here, don't know).. However, the PFS=none overhead is still 2%, while other instrumentations are still remaining available to be enabled dynamically on demand.. So, I still see more potential benefit to keep PFS=on (even as PFS=none), rather simply switch it off ;-) -- And again, all these overheads are known today and can be measured just because PFS instrumentation is dynamic and also configurable on compiler level (you may compile MySQL server without PFS code at all, or just without any mutex/rw-lock instrumentation, etc.) -- pretty different comparing to "static" solutions where stats collections are hard coded and we may just expect that their overhead is small enough.. (as well we're far today from initial 20% PFS overhead and other surprises)..
But well, as said before, PFS overhead is mainly dependent on your HW, your workload, internal MySQL contentions you're hitting, and, of course, on instrumentation level you're enabling.. - nothing coming for free ;-) So, if you're suspecting any unexpected PFS overhead on your workload - just log a bug, create a test case that we're able to reproduce, and we'll work on it ;-)
APPENDIX
PFS=off :
- performance_schema=OFF
PFS=def :
- performance_schema=ON
PFS=sync :
- performance_schema=ON
- performance_schema_instrument='%synch%=on'
PFS=none :
- performance_schema=ON
-
SQL>
- use performance_schema;
- update setup_consumers set enabled = 'no';
- update setup_instruments set enabled = 'no', timed = 'no';
PFS=tables :
- performance_schema=ON
-
SQL>
- update performance_schema.setup_instruments set enabled='NO', timed='NO';
- update performance_schema.setup_instruments set enabled='YES', timed='YES' where name like "wait/%/table/%";
- update performance_schema.setup_instruments set enabled='YES', timed='YES' where name like "wait/io/file%";
- update performance_schema.setup_consumers set enabled='NO';
- update performance_schema.setup_consumers set enabled='YES' where name='global_instrumentation';
- update performance_schema.setup_consumers set enabled='YES' where name='thread_instrumentation';
PFS=statements :
- performance_schema=ON
-
SQL>
- update performance_schema.setup_instruments set enabled='NO', timed='NO';
- update performance_schema.setup_instruments set enabled='YES', timed='YES' where name like "statement/%";
- update performance_schema.setup_consumers set enabled='NO';
- update performance_schema.setup_consumers set enabled='YES' where name='global_instrumentation';
- update performance_schema.setup_consumers set enabled='YES' where name='thread_instrumentation';
- update performance_schema.setup_consumers set enabled='YES' where name='statements_digest';
Rgds,
-Dimitri
blog comments powered by DisqusNote: if you don't see any "comment" dialog above, try to access this page with another web browser, or google for known issues on your browser and DISQUS..