« Solaris | Main | Tools/ IObench »
Thursday, 19 January, 2012
MySQL Performance: Overhead of Optimizer Tracing in MySQL 5.6
Last week I was faced to a strange problem while benchmarking MySQL 5.6:
some of my user sessions become "frozen" periodically and finally my
whole test was not valid..
More in-depth analyze shown that:
- sessions are "frozen" when executing a SELECT statement..
- sessions are not really frozen, but waiting on read!..
- the read seems to be a kind of long read, involving many I/O operations..
- all makes think that query is execution a full table scan (200M rows, 40GB table) and ignoring indexes, so instead of 1ms I have >5min response time..
But the problem is completely "random" - it's not happening all of the
time and not in all users sessions. And every time I'm executing EXPLAIN
for any given "wrong" query - it's always giving me a right execution
plan.. So, seems that something is going wrong on the time when queries
are executed concurrently, and not when I'm trying to analyze them
alone. Which means that I have to catch the execution state exactly on
the time when the execution plan is wrong!..
How to do it?.. -
since MySQL 5.6 there was an Optimizer Tracing feature introduced which
is helping a lot to understand the reason of choices made by optimizer.
There is a good short HOWTO
available on the Forge MySQL. While regarding my stress code, I have to
add the following queries after CONNECT for my user sessions:
   SET OPTIMIZER_TRACE="enabled=on,end_marker=on";
   SET OPTIMIZER_TRACE_MAX_MEM_SIZE=1000000;
And then in case if in the user session the last executed query took more than 60sec, user then executed the following query to save the last query optimizer trace into a file:
SELECT TRACE INTO DUMPFILE '/tmp/trace.$(ID)-$(REF)' FROM INFORMATION_SCHEMA.OPTIMIZER_TRACE;
As it's much more simple to read this trace from a file rather SELECT
output ;-))
So far, all my 32 concurrent users were now running
with Optimizer Trace enabled (currently the trace may be enabled only
from the session itself, there is no any global setting available for
security reasons). And very quickly I was able to get trace files for my
problematic cases! What is great that the trace is containing the whole
SQL query in question, so it was very easy then to replay the same
SELECT query and obtain the optimizer trace when this query is executed
with a right plan. Then simply compare two traces, easy no? ;-)
Skiping
all details, the source of problem is shown by the following lines:
right
execution plan:
...
                  "table_scan": {
                    "rows": 197451683,
                    "cost": 4.24e7
...
wrong execution plan:
...
                  "table_scan": {
                    "rows": 1,
                    "cost": 2.3
...
    So, for some reasons MySQL Optimizer is getting an information from InnoDB that my table containing only one single row instead of 200M rows.. Seems I was very lucky until now to never meet such a problem, but looks like the issue is real, and may happen time to time in InnoDB databases during table statistics updates. To avoid such kind of problems, MySQL 5.6 introduced InnoDB persistent statistics - once enabled, the statistics will be updated only on the next time of ANALYZE TABLE execution! So, if your table is changed frequently and widely, you have to plan regular ANALYZE of all such tables (via cron or MySQL Event Scheduler, depending what is a more simple for you).

And YES! by adding in my conf file:

# innodb pers.stats
  innodb_analyze_is_persistent=1


all my problems were gone! no more broken execution plan anymore!..

The very positive from my observations was:
- less than 10% overall performance degradation once Optimizer Tracing was enabled on all(!) 32 concurrent sessions
- near no degradation at all when InnoDB persistent statistics were enabled
- and finally I was able quickly find the source of my problem! ;-))
But my "problematic" workload was more I/O-centric rather CPU-bound (even CPU was used near 100%)... So, what will be an overhead in the "most worse" case when the workload is more CPU-bound and queries response time is less than 1ms?.. ;-)
Let's get a look on the following graphs representing 3 test cases:
- default configuration as before
- persistent statistics are enabled on InnoDB
- optimizer tracing is enabled within all user sessions
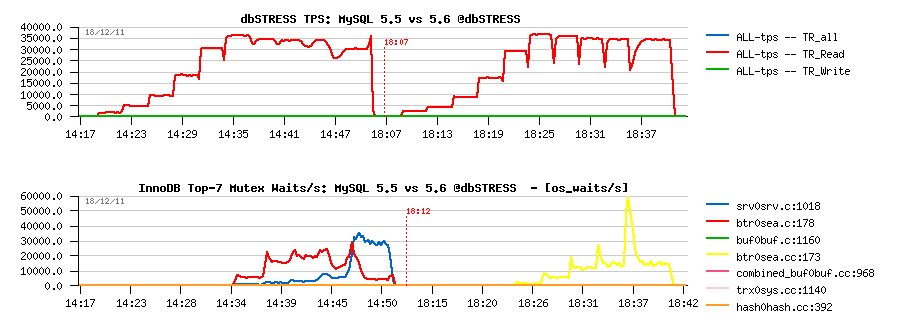
Read-Only Test

Observations :
- default: 35700 TPS
- with persistent stats: 35600 TPS
- with enabled optimizer tracing: 28500 TPS => 20% degradation..
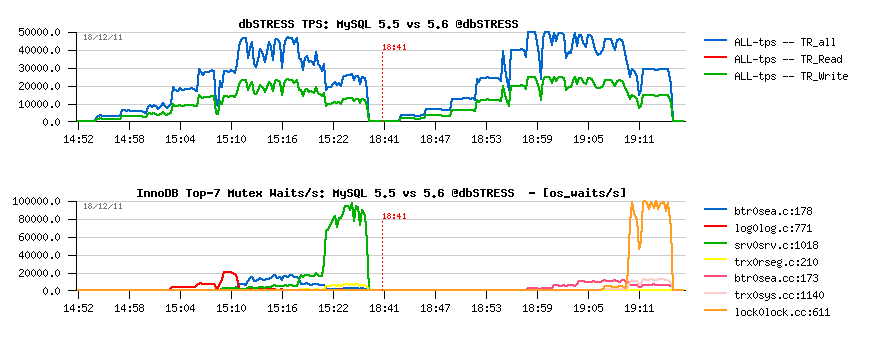
Read+Write Test

Observations :
- default: 48870 TPS
- with persistent stats: 48860 TPS
- with enabled optimizer tracing: 41100 TPS => 16% degradation..
So, keeping in mind these degradation levels, I'm pretty ready today to
add ahead in my code of all perf tools an option to enable Optimizer
Tracing on demand! - such a feature added in to any application using
MySQL may save you days of debugging! Then, even 20% of performance
degradation is nothing comparing to difference in bad response time..
And if I'm tracing only one user session, the global performance
degradation will be less than 1% ;-) while 20% difference on a web
application (for ex.) you may even not see, as the network latency
sometimes may give you even more surprises ;-))
And seems that
Persistent Statistics in InnoDB is the must! It just needs to have a
solution for the most straight forward adoption on the user land..
BTW,
did you try already these features?.. You should ;-)
Any comments and feedbacks are very welcome!..
Rgds,
-Dimitri
Other resources to read:
- MySQL Optimizer tracing: Query Execution Plan descriptions beyond EXPLAIN
- MySQL Optimizer tracing: how to configure it
Wednesday, 21 December, 2011
MySQL Performance: 5.6.4 @dbSTRESS Benchmark
MySQL 5.6.4 milestone is here and I'd like to share some benchmark results I've obtained with it on dbSTRESS workload.First of all, I was curious to observe a single user session performance (I did not look on it for a while, and there were several persons reporting we got a performance degradation in 5.6 comparing to 5.5 and 5.1).. - Seems it's very workload depending, because on dbSTRESS I've obtained the following:
Read-Only :
- 5.1 : 1800 TPS
- 5.5 : 1750 TPS (but sometimes jumps to 2700 TPS)
- 5.6.2: 2600 TPS
- 5.6.4: 2600 TPS
- 5.1: 2700 TPS
- 5.5: 2600 TPS
- 5.6.2 : 3300 TPS
- 5.6.4: 3300-3600 TPS
The results as they are, I'm planning to profile them to analyze in depth (and periodic jumps to 2700 TPS on read-only in 5.5 are looking confusing). However, few points:
- In 5.6.4 it was possible to suspect the effect of the Read-Only transactions optimization feature , but the results on 5.6.2 is the same or quite similar, and it did not have this feature yet..
- Then, to compare apples to apples, I've compiled all binaries without Performance Schema - so P_S improvements made in 5.6 are not playing here, just pure code base..
Also, a quick workload profiling is already showing me that in some parts of code we're spending more time in 5.6 comparing to 5.5, so there is still yet a room for improvement in 5.6, even it's looking better than 5.5 here ;-))
Now, let's see how the things are going on the multi-user workload.
Few words about the test conditions:
- Server: X4140 12cores bi-thread 2900Mhz, 72GB RAM
- Storage: RAID0 on x2 internal disks, there is an SSD also, but too small to host my database :-)
- OS: OEL 6.1 running UEK kernel
- FS: XFS mounted with noatime,nobarrier option
- Workload: growing from 1 to 512 concurrent users, Read-Only, Read+Update, Read+Write (Write= Delete+Insert+Update)
- Comparing 5.5 and 5.6.4
- Buffer Pool is 32GB, 16 instances
- I'm attentionally not using O_DIRECT here as my internal disks will not be able to follow on random reads (and I'm delegating it to the FS cache), while we may still have some expectation for redo and data writes ;-)
- same for redo flushing: innodb_flush_log_at_trx_commit=2 is used
So far..
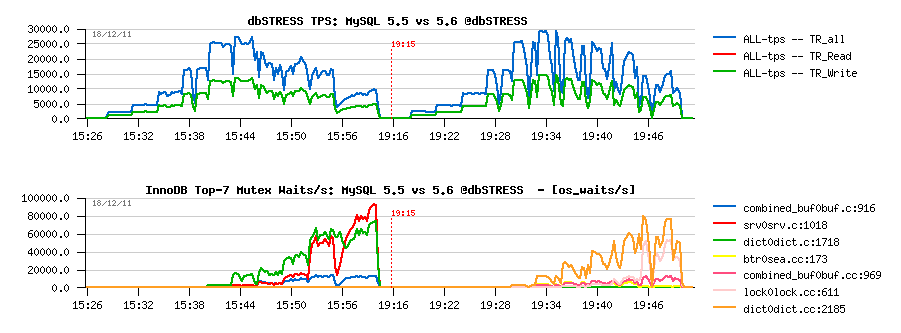
Read-Only Workload
Observations :
- 5.6 is running slightly better here, however keeps the TPS level up to 512 users pretty well
- the main bottleneck is on btr_search_mutex, but it remains stable due limited number of cores on this server (12 cores)
- in 5.5 contention is also combined with kernel_mutex
- NOTE: the trx mutex contention observed before is gone in 5.6 due RO optimization available since 5.6.4! ;-)
- NOTE: it's still need to be fixed for btr_search_mutex - it's abnormal we have this contention while there is no more pages loaded during this period of time into the Buffer Pool. - need to be fixed ;-)
Read+Update Workload
Observations :
- 5.6 is looking better here, and RO optimization feature is slightly helping here too..
- a short presence of contention on the log mutex in 5.5 is signaling here that one moment there was and I/O wait on redo writes in 5.5, but even before it, on the low load, 5.6 is still showing a better performance..
- kernel_mutex + btr_search_mutex waits are the main killers for 5.5
- lock mutex waits are killing 5.6 since 512 concurrent users..
Read+Write Workload
Observations :
- 5.6 is still performing better (while not giving impression of stability..- it's due contentions on my "storage" level ;-))
- index mutex seems to be the main bottleneck here, looks like it's time for me to include also a test with partitions ;-)) but I'd love to see index mutex fixed as well ;-))
Well, not bad at all for this 5.6.4 release, even there are still yet many things to do (like to fix adaptive flushing, etc. ;-))
Then, I was curious if some other stuff may improve performance/stability:
- using small sort and join buffers (32K instead of 2M and 128K respectively) -- no difference..
- using innodb_sync_array_size=32 in 5.6 (instead of default 1) -- no difference..
Next:
-
InnoDB thread concurrency = 24 :
- Read-Only: no difference
- Read+Update: more stable and better performance up to 512 users on 5.6 (due reduced lock mutex contention)
- Read+Write: more stable, but significantly lower performance..
While the impact is very depending on the workload, the feature like that is very welcome here! - the experimental concurrency management in 5.6 should be improved to become production ready. As well having improved Thread Pool extension here will change the things too! ;-)) To be honest, I think even once we'll fix any scalability contentions within MySQL and InnoDB, there will be still a need for a kind of concurrency management (e.g. thread/session pool, resource management) - any HW server + running OS has a limit of a number of tasks it can manage optimally.. - then after this limit you'll always observe a performance decrease ;-)) and the goal fo such a self-manager will be to never out-pass such a limit..
But well, time is pressing, and there was a one feature I wanted to test from a long time - a huge REDO log! (bigger than 4GB).
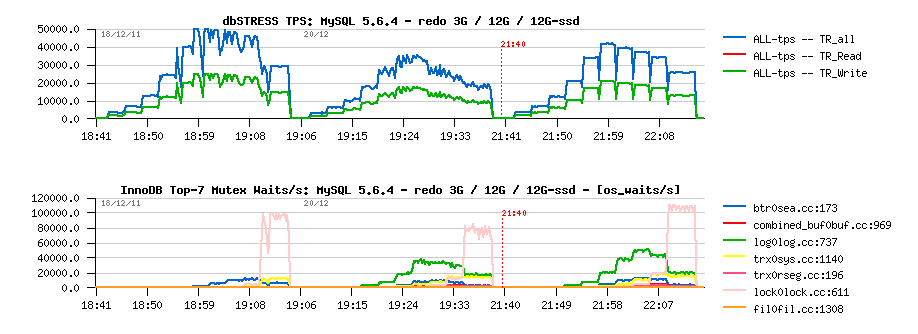
Read+Update with a bigger REDO size
As a start point I've decided to just replace x3 logs of 1GB by x12 logs = 12GB in total. With 12GB of REDO space there is should be always enough of REDO and the only flushing which should be involved in this case is due dirty pages percentage limit (which is supposed to be quite cool ;-))
But for my big surprise the performance was worse:
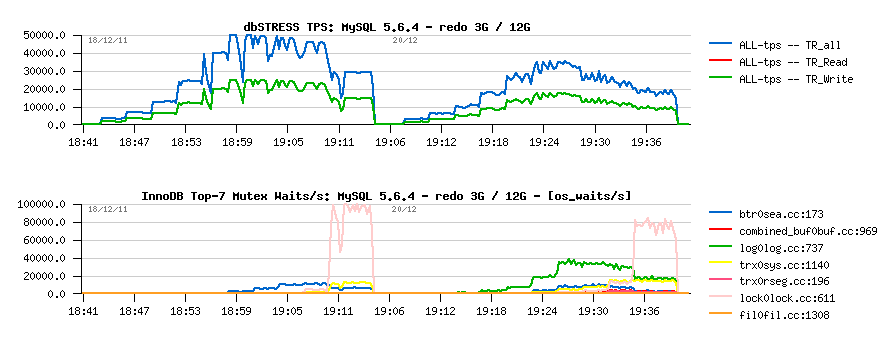
Observations :
- indeed, performance is worse with 12GB REDO vs 3GB..
- such a degradation is explained by log mutex waits..
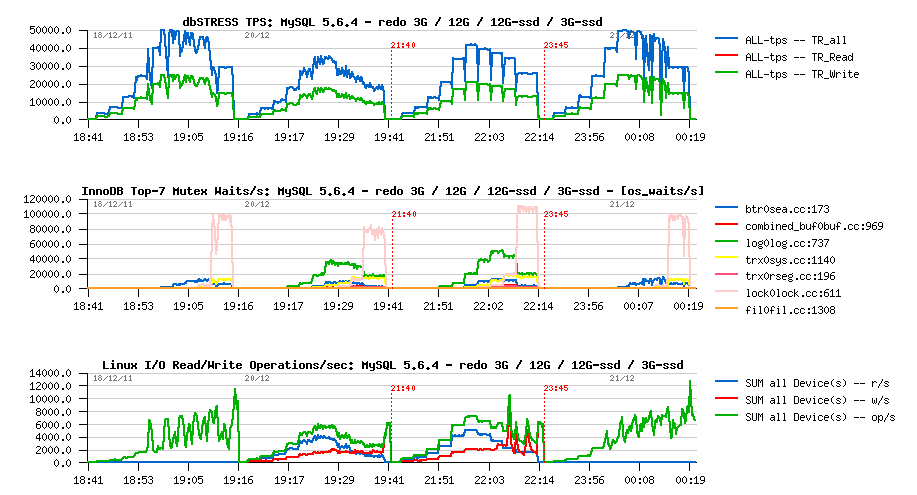
Hmm.. - is my internal storage became a bottleneck now?? - Let's move REDO logs to the SSD storage (it's small, but quite enough to keep REDO logs ;-))
And it's not really better:
Observations :
- well, it looks very stable since REDO was moved to SSD, and performance is better ;-))
- however, TPS level is still lower comparing to the initial results..
- and WHY I still have waits on the log mutex??? is my SSD not fast enough either?? ;-))
Let's get a closer look on the I/O activity now:
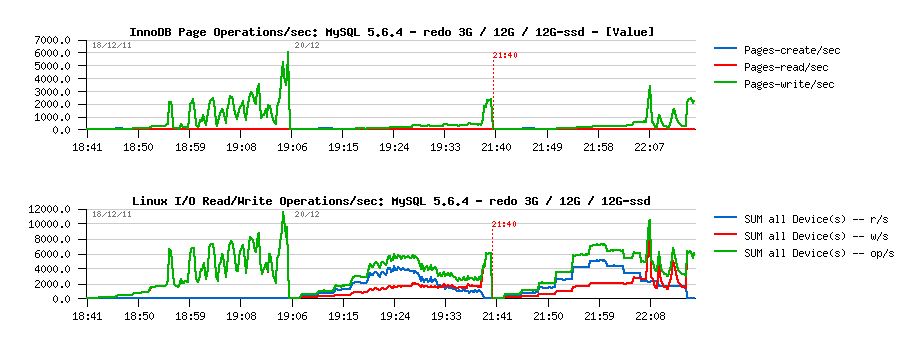
Observations :
- as you can see, InnoDB is reporting no page reads, only writes!
- while from the system I/O stats we can see there were reads present during both last tests (and there is no reads on the initial one)
- why?..
-
the answer is quite simple here:
- the REDO log writes in the current InnoDB code are not aligned to any block size..
- so, most of REDO writes are involving Read-On-Write operation (as the write record is not aligned to FS block size, FS has to read the block first, apply the changes from the record, and then write the modified block to disk)..
- until the REDO size was "small enough", all these reads during Read-On-Write were reading blocks from FS cache ;-))
- now, as REDO was increased to 12GB, once we've finished to write the last log and switching to write to the first one, the first log file will have many blocks already missed in FS cache, so they will be physically read from disk!
- and even SSD is fast, it's not as fast as FS cache sitting in the RAM ;-))
So, here we have an excellent illustration why we have to find a way to write REDO logs with O_DIRECT option (no need to use FS cache for files which are used just for write-only), AND/OR align log writes to the FS block size! (well, in the current design O_DIRECT may have a negative impact as it makes impossible to use a chain: hold_a_lock->write()->release_a_lock->fflush() - with O_DIRECT we'll involve physical write() while holding a lock.. - so such a chain should be redesigned; OR we may simply use a block size aligned writes and involve fadvise() to limit a caching of REDO logs! -- BTW, these points were already discussed with MarkC, VadimTk and all InnoDB team, so it's not something new :-)) but I was surprised to hit this issue so radically :-)) Then, since we're all agree that it should be fixed, it's probably a time to implement it now? ;-))
To go till the end now, let's see if things will be better with 3GB REDO size (as initially), but on SSD:
Observations :
- yes, we reached the same 50,000 TPS as before! ;-)
- no more log mutex waits, as expected..
- however, missing some workload stability..
And with 6GB REDO on SSD?.. -
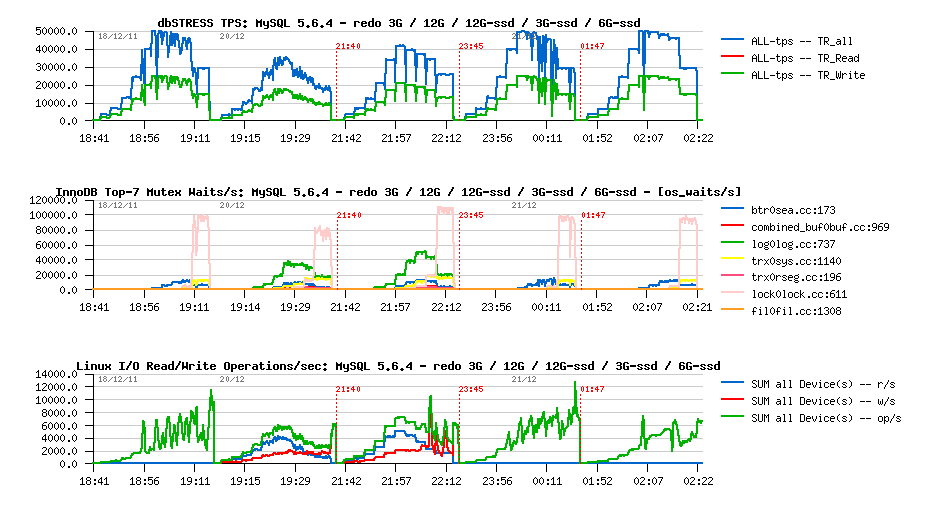
Observations :
- the last result is the most stable from all of we have seen until now :-))
- quite interesting that Checkpoint Age did not out-pass 4.5GB in case with 6GB REDO log..
Seems that improving Adaptive Flushing will be the next step here.. (as well, block size aligned REDO log writes, btr_search_latch and lock mutex contentions ;-))
It's also great to see a growing interest on MySQL 5.6 - db4free.net
is already proposing sandboxes with MySQL 5.6, and I was told that some
other web hosting companies
are actively evaluating MySQL 5.6 adoption now.. Let's see ;-)
Time
for vacations now! ;-))
Some fun stuff..
if you
continued to read until here ;-)) This year is finishing, and there were
many fun events.. - it's a long time now I wanted to share few small
videos from Harmony-2011 Conference (Helsinki, Finland) - it was a
Baltic OUG Conference with MySQL stream, very warm and open mind people,
I really enjoyed it :-)) And here are 2 videos from there:
- Ronald Bradford playing a "Cold War Game" with a Russian guy - HD / MP4
- Opera time @Conference (no words.. just "wow!") - HD / MP4
Happy Holidays! Happy New Year! Happy Vacations! ;-))
Rgds,
-Dimitri
Thursday, 28 October, 2010
MySQL Performance: 5.5 and InnoDB btr_search_latch
This post continues the story started during the previous testing with MySQL 5.5.6 where I've observed a hot contention on the btr_search_latch and was curious to get a more detailed view on this performance issue.. Well, the story is starting here, but you never know what will be at the end.. ;-))
So, I've started with the same initial test workload I've before:
- dbSTRESS injector
- READ transaction: SELECT1 + SELECT2 queries
- WRITE transaction: UPDATE only queries
- think time between transactions: 0 sec.
- Concurrent user sessions: 1, 2, 4, 8, .. 256 users (growing workload)
- TPS and Query response times are collected live during all workloads..
To don't repeat again, there are just 2 links to the last graphs describing the Read-Only (here ) and Read+Write (here ).
What is interesting on these graphs:
- more the load become IO-bound, more the contention on the "btr_search_latch" become hot
- curiously the main performance impact is coming from reading!
- even Read+Write workload is more impacted by reading rather writing.
Seems there were several problems at once.. So, to understand one thing a time I'll try to split the issues and will keep the focus only on the Read-Only workload for the moment..
Specially that it was a great post published by Mark Leith when between other interesting things he also mentioned that the use of the "btr_search_latch" may be completely disabled by setting innodb_adaptive_hash_index off.. - that was a good point and interesting option to try!! :-))
So, let's get a look now on the MySQL 5.5.6 performance on the Read-Only workload once the
innodb_adaptive_hash_index = 0
| MySQL 5.5.6 Read-Only workload + innodb_adaptive_hash_index= 1 / 0 |
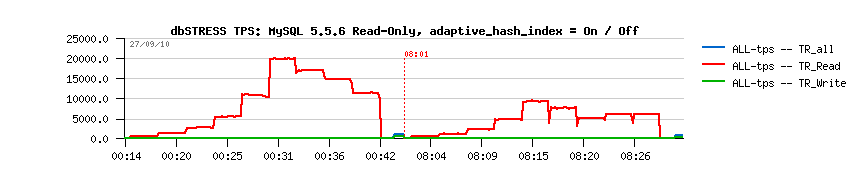
Observations:
- so far, the load is growing from 1 to 256 users step by step (1, 2, 4, 8, 16, 32,.. 256)
- on the left side the TPS level obtained while innodb_adaptive_hash_index = 1
- on the right side: innodb_adaptive_hash_index = 0
- as you can see, since 16 users TPS become lower in the second case, and since 32 users it's as twice as lower comparing to the performance with innodb_adaptive_hash_index = 1 ...
Why?...
Let's get a more detailed view now.. [ Continue reading... ]
The full report is here: http://dimitrik.free.fr/db_STRESS_MySQL_55_and_btr_search_latch_InnoDB_Oct2010.html
Any comments are welcome! ;-)
Sunday, 19 September, 2010
MySQL Performance: 5.5 Notes..
Since 5.5 is announced as Release Candidate now, I'll not compare it with 5.1 anymore - I think there was written enough about the performance gain even since introduction of 5.4 :-)
From the other side, we want to be sure that the final 5.5 will be at least as good as 5.5.4 release, and here the feedback from real users with real workloads will be very precious! So, please, don't keep quiet! :-))
After that, few notes while testing MySQL 5.5 on dbSTRESS and points for discussions..
Buffer Pool and Purge
Last month I've got some time to focus on the Buffer Pool pages management I've observed many months before with older MySQL/InnoDB versions, and now was curious if I'll reproduce the same issue with MySQL 5.5.4 too...
Few words about the tested workload:
- still dbSTRESS ;-)
- but "light" scenario which may be very common for many web servers: there are only SELECT and UPDATE statements generated during the workload (WRITE transactions are selected as UPDATE-only during scenario generation)
- UPDATE queries are not modifying any indexes and not increasing any data in size, so all UPDATE(s) are changing all data in place
- READ transactions are composed of 2 SELECT statements: first id "light", the second is "heavier", but both are joins of two tables by primary or secondary key
- no "think time" between transactions, so every user session is bombarding the database non-stop with SELECT(s) and UPDATE(s)
- 32 users (sessions) are running in parallel
- the response time of all queries is reported live by the workload (SEL1, SEL2, UPD), as well the reached TPS level too
- the READ/WRITE ratio may changed according scenario, I've focused here on RW=0 (Read-only) and RW=1 (Read+Write, one READ per each WRITE, means two SELECT per UPDATE (SEL1 + SEL2 per each UPD))
What I observed before is that even if every UPDATE is changing data in place, there is a continuous decrease of the free space in the buffer pool! - and over a time all the space is used by something else rather useful data, etc.. - means probably "useful data" are leaving the cache and filled by old page images, etc.
So far - yes, I've reproduced the same problem again and with MySQL 5.5.4 - and you may read all details about in the Buffer Pool and Purge report. But to make it short: it's once again about InnoDB purge - if purge is unable to follow your workload activity you may have many problems, and this problem is one of them :-))
I did not really think to publish this report before I have a detailed in depth explanation about everything is going on.. - But several things happened during this time:
- First of all, InnoDB Team came with so promising ideas about improvements in the page management that it made me regretting 5.5 is become RC and no new features may be included until 5.6 now :-))
- And second - sometimes the solution is also coming "by surprise" from somewhere you even not expected ;-))
Let me speak about the Linux kernel :-))
Linux Kernel impact
By some chance there was a change of the Linux kernel on the same server I've used before. By lack of chance I cannot say you what was the old kernel (I may just suppose if was newer than the current one).. - But at least I may say that the current one is: 2.6.32.21-166.fc12.x86_64 :-))
The changes came when moved to this kernel:
- No more problems with Buffer Pool on the same workload up to 128 users! - purge is working just fine :-) (probably related to a better process scheduling on a multi-core machine?)
- Curiously 32 cores configuration shows even slightly better result comparing to 16 cores (NOTE: each core has also 2 threads, so Linux is seeing 64 vcpu) - before on 32 cores the result was always slightly worse..
So my questions here:
- Which Linux do you use in your production and why?..
- Which kernel version you're keeping on your production server and why?..
I think sharing this information will help to focus on the right MySQL issues and combine best practice for every users :-)
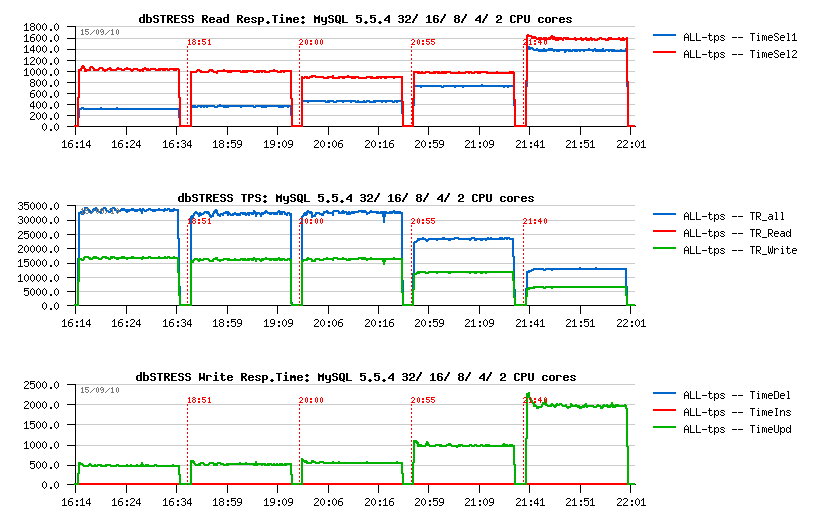
Here is a small graph commenting my observations.
Performance on 32/ 16/ 8/ 4/ 2 cores
Comparing 5.5.4 and 5.5.6: flushing
There were many discussions about dirty pages flushing in 5.5 since UC2010 in April.. - On some workloads the flushing was too aggressive.. On some not aggressive enough..
Well, the 5.5.6 is came with a more "relaxed" (less aggressive) flushing which will depends a lot on your workload. And probably in many cases it'll be just fine..
On dbSTRESS, curiously, if 5.5.4 was too aggressive, then 5.5.6 seems to be too relaxed :-)
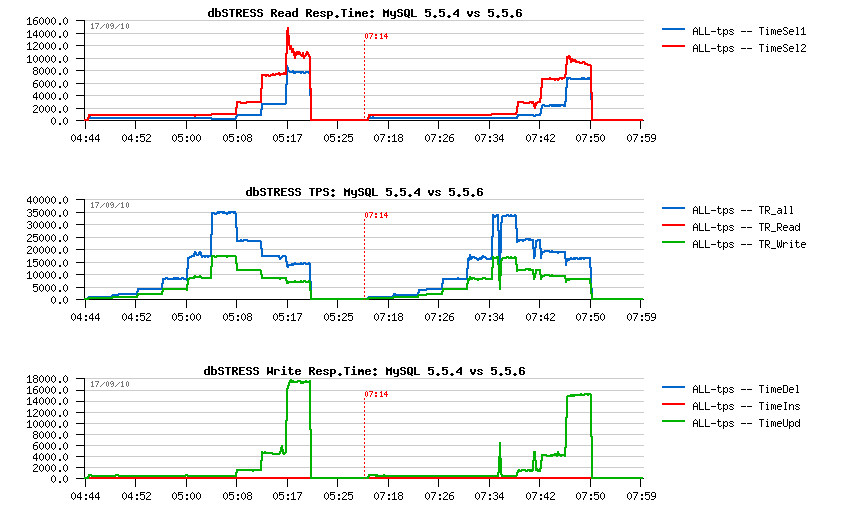
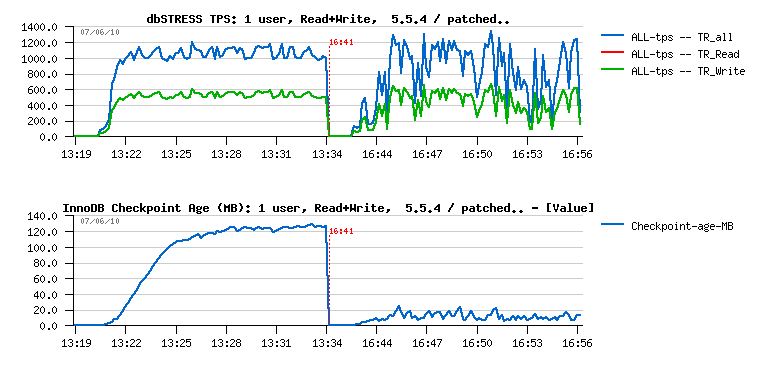
As you can see on the following graph, the 5.5.6 may miss a performance stability on the aggressive workload (like dbSTRESS):
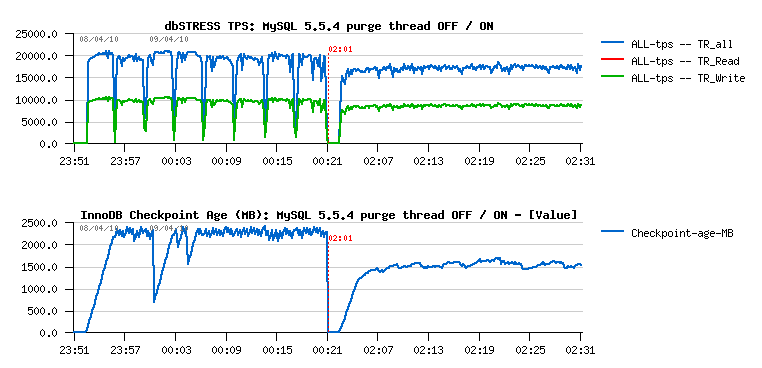
Flushing on 5.5.4 vs 5.5.6:
Observations:
- On the left part is 5.5.4, on the right: 5.5.6
- the 5.5.4 flushing is quite aggressive and even don't leave REDO logs to be filled more than 50% (see on Checkpoint Age courve)
- the 5.5.6 flushing is more relaxed and not flush enough, so the REDO may become out of free space, then a furious flushing is involved and bring a performance drop..
To recognize if you meet such an issue you have to monitor your Checkpoint Age in parallel with your workload activity - and if Checkpoint Age drops are corresponding to your activity drops + I/O write activity spikes = probably you're here ;-)
Again, think to report your problem! - it'll make the final release way better! :-)
Well, it was aggressive, but in memory workload.. - Let's see later what changes when the workload is IO-bound ;-))
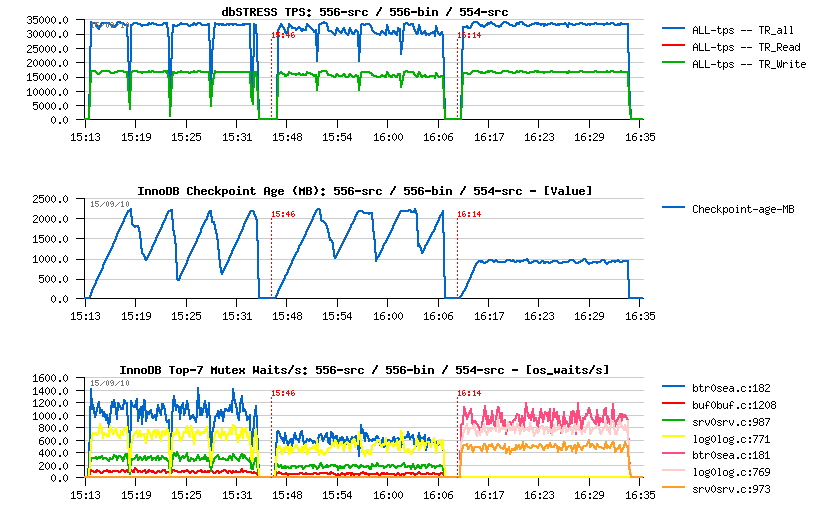
Comparing 5.5.6 vs 5.5.6: compiling
Usually I'm compiling myself my MySQL binaries for testing, but now was curious if there any difference in performance between an "official" binary and compiled from the sources:
- Well, you may still win some 10% in performance by compiling a "light" version :-)
- For ex.: I'm using only "myisam,innodb,partition" engines list, which gives me a small (less 10MB) binary..
- Then in some cases compiling it with "tcmalloc" gives another boost (you may check its impact also by using tcmalloc via LD_PRELOAD)
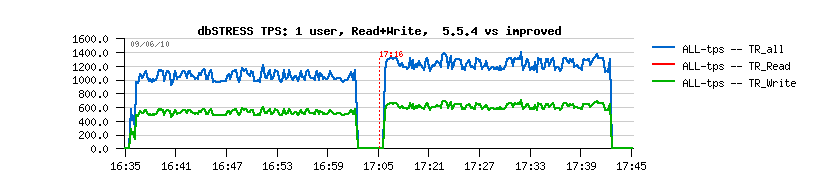
The following graph is representing observed differences:
- from the left to the right: 5.5.6 from sources, 5.5.6 official binary, 5.5.4 from sources
- as you can see, avg TPS level of the 556-src is slightly higher comparing to 556-bin
- on the same time the binary version shows lower depth in performance drops..
5.5.6-src vs 5.5.6-bin:
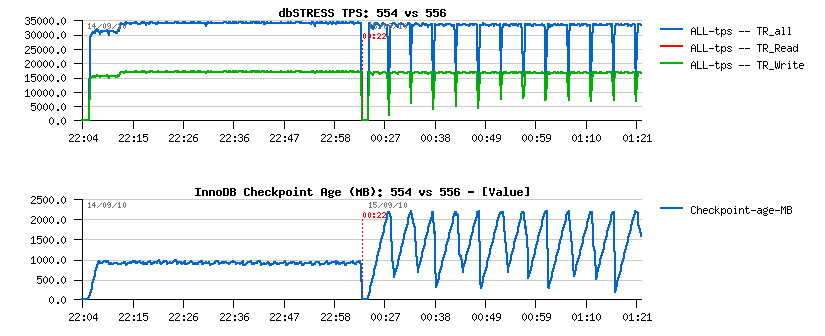
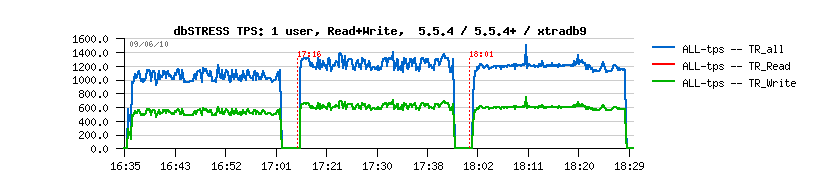
Comparing 5.5.4 and 5.5.6: scalability
What is interesting, that on the same workload 5.5.6 is keeping better the higher workload comparing to 5.5.4
dbSTRESS scenario :
- users: 1, 2, 4, .. 256
- Read/Write ratio: 1
- think time: 0
- WRITE: UPDATE-only
my.conf settings :
- innodb_thread_concurrency=0
- innodb_purge_threads=1
- ...
As you can see from the following graph, 5.5.6 is giving a higher TPS on 64, 128 and 256 users (observed on the better response time as well):
MySQL 5.5.6 scalability:
MySQL 5.5 innodb thread concurrency
From the previous graphs you may see that since 32 concurrent users/sessions there is a continuous drop in performance, and you may say - it's as expected as the innodb_thread_concurrency is set to zero. In the past to fix such an issue the solution was to set the innodb_thread_concurrency to something different from zero - for the 5.5 the most optimal value was 32 until now. The problem here is that everything as usual depends on the workload.. - And in my case, the overhead of innodb concurrency management is out-passed the potential gain! (since all performance improvements made in 5.5 its overhead may become more visible than ever)..
The overhead of the concurrency management in InnoDB is not something new - I've presented 2 output examples few years ago of the top locking on MySQL reported by Solaris "plockstat" (derivate from DTrace) - Lock waits reported by Solaris . You may see that once concurrency setting is not zero, the 'srv_conc_mutex' moving to the first place.. It was on the pre 5.4 era yet, but I don't think the concurrency code changed too much since that. And correct me if I'm wrong, but seems the waits on this mutex are not reported by "mutex status" output as it's created via "os_fast_mutex_init(&srv_conc_mutex);", so not listed in innodb mutexes and that's why I don't see it at all during monitoring (and I think the same for the same reasons it should be invisible for Performance Schema too) - and if it's so, it should be fixed..
Now, looking more in details for the observed performance difference - the following graph is representing a step by step growing dbSTRESS workload from 1 user to 256 (1,2,4..256): - on the left side 5.5.6 is running with innodb_thread_concurrency=0 - on the right side: set to 32 - changing the value of tickets is not helping here as transactions are very short and fast (that's why probably the overhead is seen so well too, don't know)..
MySQL 5.5.6 thread concurrency:
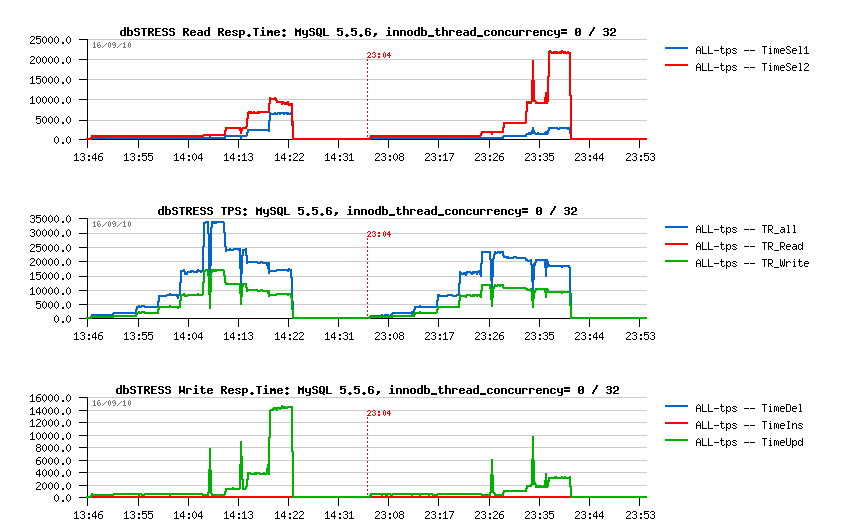
What is interesting:
- there is no difference until the concurrency is low (up to 16 users)
- the benefit is coming since 256 concurrent sessions only on this test..
-
with a growing workload performance is decreasing, but not for the
same reasons in both cases:
- with concurrency=0 it's mainly due growing time of UPDATE statements
- with concurrency=32 it's mainly due growing the second SELECT statements - so yes, it depends on the workload, and we need more visibility on internal waits to give a right advice :-)
Solutions?..
So, for the best performance results you're better to keep active sessions in your database under 32 and then set innodb_thread_concurrency=0. For example you may use an application server connection pool or other 3rd party solutions.. - nd of course having a thread pool inside of MySQL will be the most optimal :-)
Otherwise, if you may have many concurrent user sessions running on the same time you may always try to change innodb_thread_concurrency from its zero default value - this setting is dynamic, so you may quickly check the result without restarting your database server and then compare which setting is better adapted for your workload...
MySQL on I/O-bound workload
Well, until now I've focused my attention mainly on the in-memory workloads - in many cases on IO-bound workload you're simply testing your storage array performance and it doesn't help to improve MySQL performance :-)) However, now I my database is placed on the SSD disks! - how much it'll help in my workload?..
Let's start first with Read-Only workload as it's the most simple one :-)
To make my workload IO-bound I'll just reduce the AntiDEAD setting in dbSTRESS scenario (to avoid deadlock exceptions during the test, dbSTRESS has an AntiDEAD option: it gives an interval of ID to be used by each user/session, and avoids artificial deadlocks during testing). On the same time by this setting you may reduce or increase the quantity of pages which will be covered by randomization algorithm..
So far, reducing AntiDEAD from 2000 (default) to 200 I'm increasing by x10 times the number of pages accessed during the test. Other scenario settings remain the same:
- 1 to 256 users/sessions
- Read-Only transactions
- think time: 0
Then I've executed 3 tests:
- 1.) in-memory workload, AntiDEAD=2000 (as before)
- 2.) IO-bound workload, AnfiDEAD=200, data files are opened with O_DIRECT (not cached by file system)
- 3.) IO-bound workload, AnfiDEAD=200, data files are opened with fdatasync (cached by file system)
The following graphs are representing the observed 3 workloads in the same order:
MySQL 5.5 Read-Only IO-bound workload:
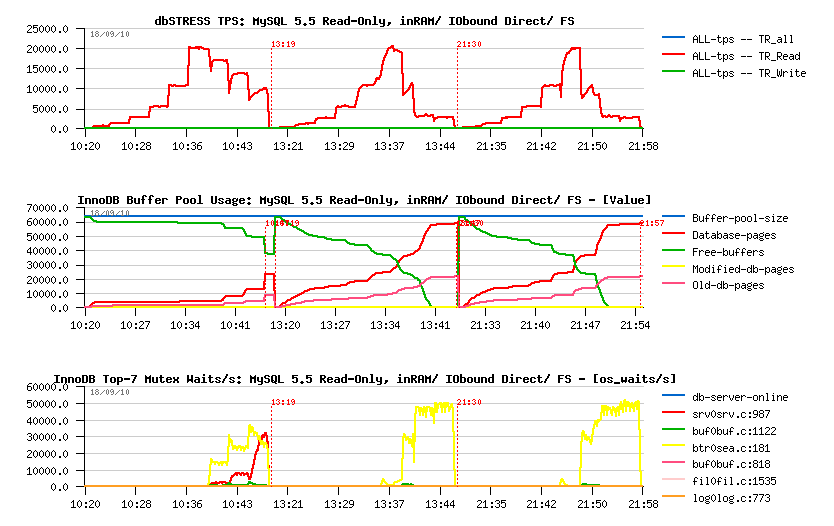
Observations:
- all three workloads reached the max 20K TPS observed initially with in-memory workload
- then with a growing workload, performance decreasing..
- however, the drop in performance is much more deeper on IO-bound workloads..
- is it because of I/O latency to the storage array?.. - not really, because even with a fully cached data by the filesystem the result is still not better ;-)
- interesting that the kernel_mutex that we see in in-memory workload is even not appearing when the workload is IO-bound..
- as well looking on the mutex waits, we may suppose the issue is coming from the btr_search_latch - but the real answer may be found with Performance Schema here ;-)
Seems things a directly depending on the page operations - with a smaller (8G) Buffer Pool performance become even worse and TPS will be limited to 10K only.. With 32G pool it's sligtly better, but in many cases you cannot put your whole database into your Buffer Pool, so there is definitively something to do here..
As you may imagine, Read+Write workload will suffer the same problems once it become IO-bound, but what is interesting that the main issues are READ transactions (as expected)..
MySQL 5.5 Read+Write IO-bound workload:
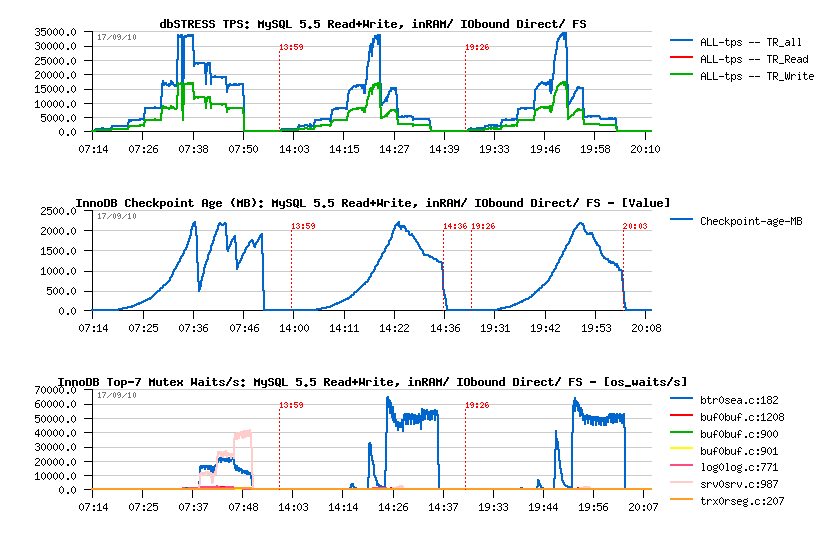
Observations:
- all three workloads reached the max ~35K TPS observed initially with in-memory workload
- similar to Read-Only decreasing performance with a growing workload..
- but what is interesting that during IO-bound workloads performance is decreased mainly due increased response time in SELECT statements! (page reading management?..)
- but from the other side: no furious flushing on the IO-bound workload.. (well, it's better to call it IO-bound reading ;-))
Some ideas...
It's quite curious to see how performance may vary depending on your data and I/O pattern..
Some points to consider:
- your database may be always way bigger than the RAM you have..
- you cannot always use most of the RAM for your database (specially if there are other applications are running on the same server)..
- in many cases file system may read much more faster the data required by the database rather the database read-ahead..
So I think we have to focus on how to speed-up the pages read within InnoDB, because even the Read-Only may look not perfect for the moment..
Well, work continues! :-))
All other details about present materials you may find in the final benchmark report: MySQL 5.5 Notes..
Any comments are welcome! :-)
Monday, 12 July, 2010
MySQL Performance: InnoDB IO Capacity & Flushing
This article was initially inspired by Vadim's post on mysqlperformanceblog.com comparing MySQL 5.5.4 and XtraDB under TPCC-like workload. Vadim's post has opened an interesting discussion about InnoDB I/O capacity feature in general, and particularly - tunning / settings regarding 5.5.4 and XtraDB. However, going more in depth I've discovered more interesting things than I've expected initially :-) and here is a kind of summary of my observations..
The following stuff is mainly covering heavy Read+Write workloads as I/O capacity was added to InnoDB to improve page writes rather reading ;-)
First of all - why I/O capacity in InnoDB?..
InnoDB I/O Capacity
Initially InnoDB was designed to flush in background only 100 pages per second. The value of 100 pages was fixed within a code and was not configurable. So, if you have got a storage subsystem able to execute more than 100 writes/sec you were not limited by the storage anymore, but by InnoDB itself..
Google team introduced the "I/O capacity" feature within their performance patches giving a way to adapt InnoDB I/O activity according to a given storage array capabilities, etc. This value of IO capacity entered also in many other maintenance tasks when database needs to decide how many pages should be flushed in background. This feature changed many things and bring some new problems as well :-))
Supposing you've procured a storage array able easily to execute 1000 random writes/sec, so how you can improve your performance now?..
-
Well, before with a fixed 100 writes value the difference was seen
only during a "furious flushing" period (will talk about later)
-
Now, with a new storage you're able to say you can keep 1000
writes/sec, and set innodb_io_capacity=1000. What it'll change? - on
the time of the Google patch this value was mainly used to size dirty
pages flushing. So every time InnoDB reached the max dirty page
percentage setting it started a flush batch with a number of pages
equal to IO capacity setting (as well in other background flushes too
but with a much smaller impact)..
-
So far, with IO capacity any user was able finally to force InnoDB to
process a more or less aggressive flushing of modified data and better
use the available storage subsystem.. But now - what about
performance?.. ;-)
-
From the performance perspective - less you're doing I/O operations
faster you're going :-)
-
On another hand - you cannot delay I/O operations infinitively because
earlier or later you'll need to write anyway and write a huge amount
of pages will be always harder then flush them little bit but
constantly ;-) - of course, your workload may vary and if you know
that after 5 min of hot activity you'll get 20 min of quiet period -
you may probably delay your writes and flush pages during the quiet
period.. - but usually such a programmable situation is not happening
often :-)
-
So, in production environment you know that to avoid write bursts you
need to flush constantly.. - but how much and since which event?.. ;-)
-
If you're flushing too much you'll make your storage busier and your
overall performance lower..
- But which amount of dirty pages you're really need to flush?.. And is there any danger if you're flushing less?.. ;-)
First - does it really matter how many dirty pages you have in your buffer pool?.. ;-)
All changes are reflected in the redo log, so in case of crash you should recover them (but well, if you're crashing too often you probably need to change your HW or OS vendor ;-)) But supposing you've got a solid HW, stable OS, huge RAM, fast storage and don't afraid to drive fast :-) So where is a real danger?..
Usually when you're optimizing a database performance you're not really looking to reach the highest pick result, but rather a stable performance level.. So the main danger will be always to see performance drops during your workload. And when it happens due really growing load - it's one story, but when it happens due wrong configuration or design problems - it's another story ;-)
So far, there are at least 2 most critical situations you may reach "by design" :-)
-
#1) Your buffer pool is small and out of space - most of pages
are dirty and you absolutely need to flush to make a room for other
data.. - Well, such case normally should not arrive because InnoDB is
self protecting to never out pass 70% of dirty pages percentage, but
if your IO capacity is set too low you're not protected ;-) And once
it happens InnoDB has to flush at any price to avoid a global freeze..
and it'll flush without regarding IO capacity setting - it'll simply
involve a full flush, so it'll be written on the highest write speed
as your storage able to sustain.. - So anyway, it'll not be a total
freeze, but not far from that, as under so aggressive writes your
database server will work very slowly. I'm calling it "furious
flushing" :-))
- #2) But if the buffer pool is big enough then the furious flushing may happen again when you're out of free space in your redo logs.. - Having bigger buffer pool will give you a better performance, and for the same dirty pages percentage you'll be able to keep more dirty pages and dispose a bigger gap of buffer pool space.. BUT the max redo log space is still currently limited to 4GB! - and every redo log record referencing a dirty page cannot be recycled until this dirty page remains unflushed.. So once the amount of your changes reached 7/8 of 4GB, InnoDB has no choice - it'll involve a full flush too to avoid a freeze.. - And again, 4GB means you've created your redo log files with a max allowed size (4GB in total) - but with a smaller size furious flushing will arrive much more earlier ;-)
If you still follow me, you'll see that the main problem is coming from redo logs ;-)
There may also arrive another issue due flushing from LRU, but I think its impact will be much less important (or it may be the next issue to fix? - so I'll ignore it for the moment :-))
But well, let's summarize now and go by example:
-
Let's start with a server configured with a buffer pool=500M and redo
log=128M - this configuration will work.. And you'll have all problems
at once, but not really feel them because every full flash will be
still short ;-) So you'll have a low average performance level but
quite stable.. And still feeling you may better use your HW :-)
-
As you have, say, 16GB of RAM on machine, it'll be pity to use only
500M for your buffer pool :-) And once you'll configure buffer
pool=12000M you'll see a huge performance improvement, but mainly on
read operations.. - On the Read+Write workloads you'll only go faster
due faster cached reads, but writes will not go faster.. - Why? -
you'll be still limited by the size of your redo log :-) 128M is too
short and you'll be constantly doing a full flush..
-
Then when you'll try a 3000M redo log you'll see a real improvement
(50% or more)! - but nothing is free.. - with a bigger redo logs once
you're out of redo space your full flushing will be really furious :-))
- On the same time it'll be cool to keep the reached performance level all the time and without performance drops, no? ;-)
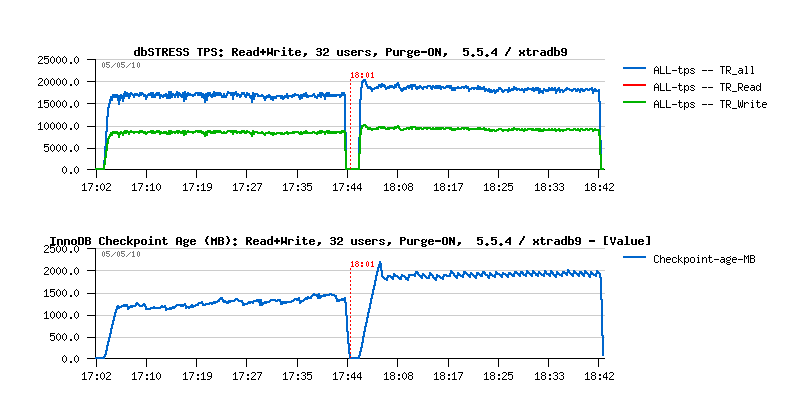
Sorry if I'm repeating myself, but a small picture says more - here is a performance level on dbSTRESS with 128MB redo logs:
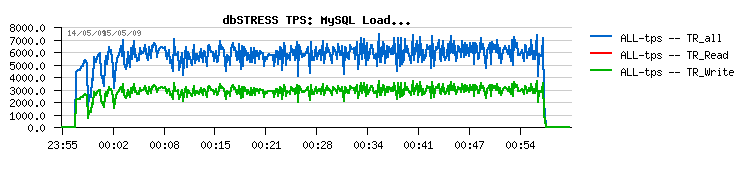
And here is the same workload but with 1024MB redo logs:
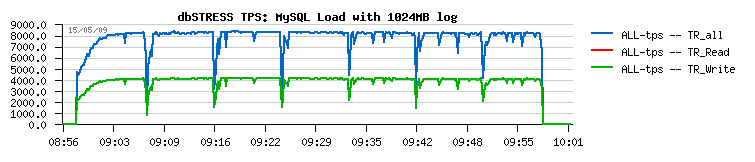
As you see, 8.000 TPS is way better than 6.000 TPS ;-)
BUT - there are huge periodic drops.. And the origin of these drops is out of space in redo logs.
Can it be fixed and how easily ?..
-
You may lower your max dirty page percentage setting and force InnoDB
to flush the modified pages before the redo logs will be out of space,
and IO capacity setting will help you here to adapt your I/O activity
according your workload. BUT - the problem is that there is no direct
dependency between a number of dirty pages and a number of records in
redo logs!.. - So your setting may be still be not low enough to cover
any kind of activity, then by setting max dirty pages percentage too
low you're starting to write too often and slow down your general
performance..
-
The first real solution for this problem was proposed by Percona team
by introducing Adaptive Checkpoint feature. The initial
implementation of Adaptive Checkpoint was released as progressive
flushing: depending on the percentage of redo log occupancy, the dirty
pages flushing was adapted with a relative IO capacity percentage -
less free space is left in redo logs, higher percentage of IO capacity
is used for dirty pages flushing. This solution is still integrated
within Percona's XtraDB and called "reflex".
-
InnoDB then introduced a similar feature which is called Adaptive
Flushing. The solution is based on calculation of estimated speed
of necessary flushing according the dirty pages level and redo log
space occupancy. The estimation obtains finally a number of pages to
flush and this number is compared to the IO capacity setting: the
lower of two values is used then.
- Then, if your workload become really heavy on writes, you'll need a Purge Thread (otherwise either Adaptive Checkpoint or Flushing will not be able to help you because their code will be never reached, so never executed.. - I'll skip details here, but if you want to know why you may read this post ). Just keep in mind that you may need a Purge Thread feature to be sure all things are working right.
So by tuning the IO capacity setting according your workload you may adapt I/O activity on your systems: more or less aggressive writes will be involved on your storage subsystem. As well it's also very useful when your goal is to run several MySQL servers in parallel on the same host (for virtualization or other reasons) and you expect to guaranty a reasonable storage sharing between your MySQL instances. By IO capacity setting you may attribute a sort of quotas for each MySQL server on write activity, etc.
Now, once the preface is finished, let's go back to the Vadim's article :-)
XtraDB & IO capacity
Vadim in his post pointed on a quite curious situation observed on Percona's TPCC-like workload:
-
On the same workload and similar my.conf settings MySQL 5.5.4
performed less stable comparing to XtraDB..
- Further investigations showed that 5.5.4 become more stable with a higher innodb IO capacity setting (and a bigger buffer pool as well)..
So it means that Adaptive Flushing estimation obtains a higher number of pages to flush comparing to the initially used IO capacity setting... So if the IO capacity is configured lower than it should be for a given workload then InnoDB will not flush fast enough to keep a room of free space in the redo logs and will meet a "furious flushing" every time..
To understand if your IO capacity settings is good enough you may just monitor your checkpoint age over a time: if it remains low, stable and not increasing to reach the critical level (ex: stays under 80% of your redo space MB) - it's ok. Otherwise you should increase your IO capacity value.
The problem also that you cannot change it live for the moment.. So if you discover you have to adjust it within your production workload - it may be a real problem if you have to restart your MySQL server.. - except if your familiar with GDB hacking and feel ok to change a global variable of the currently running MySQL process :-) But seems everybody is agree that IO capacity should be a dynamic variable, so I hope we'll see it dynamic very soon :-))
Another helpful features will be also nice to have:
-
A counter of "furious flushing" events (e.g. every time when the full
flush is involved due missing free space in redo logs) - it'll
simplify InnoDB monitoring and give you a needed information about
full flushes without needing to monitor checkpoint age..
- Print a current estimated IO capacity value within InnoDB status output to see if there are gaps between estimated and configured IO capacity values..
Seems it'll be easy to add.
However, my attention here was still mainly focused on the one and the same question I've asked myself after Vadim's article: Why having exactly the same (low) IO capacity settings XtraDB is not meeting the same problems as MySQL 5.5.4 ?...
The real answer as usual is coming from the source code reading ;-) - after scanning and tracing XtraDB code under my workloads I've finally discovered that the default Adaptive Checkpoint setting used currently by XtraDB simply don't use IO capacity setting in its formula - it'll simply write as many pages as it estimated! :-)) So it's normal it does not meet any penalties due lower IO capacity setting :-)) The default mode in XtraDB Adaptive Checkpoint is "estimate", and it's implemented currently to write pages without regarding any IO capacity limits/settings (while previously default "reflex" mode is using IO capacity).. - Well, of course the point about how many writes should be involved by InnoDB and should they be limited or remain free of limits is a subject of long discussions (preferable around a beer :-)) But I afraid there will be as many opinions as people :-)) and the most optimal will be probably leave it as an option on configuration setting:
- #1) - writes are limited by IO capacity
- #2) - writes are free of limits and involved depending on activity
- #3) - writes are limited by IO capacity, but IO capacity is auto-incremented by InnoDB in case of high write requests
And the last option (#3) I'll try to use during the following tests :-)
Well, if it became less or more clear with IO capacity impact, there were still several questions regarding MySQL 5.5.4 which did not stop to run in my head and needed to find their answers..
MySQL 5.5.4 and InnoDB Flushing
When we firstly implemented the Purge Thread feature yet in MySQL 5.4 it did not really bring any performance degradation, but only stability improvements:
MySQL 5.4 default:
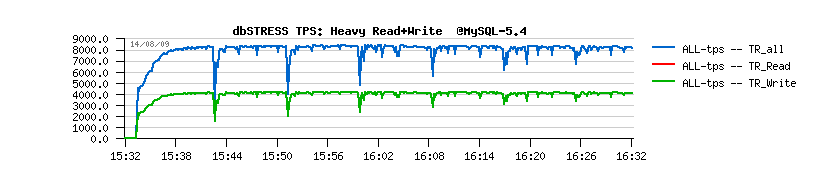
MySQL 5.4 with a Purge Thread:
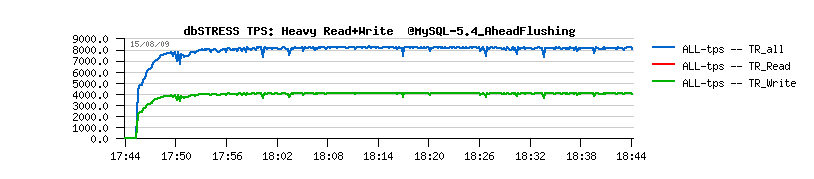
(Ref: MySQL Performance: Final fix for Ahead Flushing & Purge Lag )
Then there are so many changes were introduced within InnoDB code that when the Purge Thread was officially available in MySQL 5.5.4 the things were changed: we started to see decreased performance on the Purge Thread is activated:
(Ref.: Why Purge Thread in InnoDB?.. )
While I can understand there is a performance drop due bigger processing done by InnoDB once it's doing things right ;-)) but looking on the Checkpoint Age graph I still have impression we're probably flushing too much and observed performance gap may still be reduced...
Then, analyzing my tests with XtraDB I was also surprised that this performance drop in 5.5.4 is significantly higher then in XtraDB:
Having 17.000 TPS and 18.000 TPS makes an important difference, specially that having only one purge thread is not yet removing completely a purge lag, and you may need to run two purge threads or have a purge lag fix applied to reach a real stability, but this will also reduce your performance little bit because purging has a big cost! (Ref.: MySQL Performance: Improving Stability for more details)..
And again, looking on Checkpoint Age, there are 2 things coming in mind:
-
Seems we're flushing more than really needed comparing to XtraDB
- Slowly growing Checkpoint Age over a time I don't like at all: it still means there is a danger to not flush enough and meet "furious flushing" (and on more long tests I've observed it by myself, so I'm not presenting other graphs, but just believe me :-))
All these observations make me think there is something wrong in the way we're flushing dirty pages.. But on the same time the code logic in InnoDB don't make me think something was missed.. Which bring me on idea that we simply don't focus on the right direction...
Initially I've started to trace estimation values reported by InnoDB Adaptive Flushing - and it's true, sometimes they were looking too high or too low.. So, I've replaced estimation function by my own formula similar that I've used in 5.4 tests - and it was possible to make InnoDB performing better with a such simple formula, but it make me worry on the same time that such a tunning will be very workload oriented rather universal..
And then getting all things presented above together I've started to look in the root of the problem:
-
Currently what we're trying in Adaptive Flushing is to find a right
number of pages to flush - but is it a right way?...
-
On the same time for some reasons even by flushing an estimated number
of pages we're still not protected to get out of free space in redo
logs and meet the famous "furious flushing"...
-
And then if I monitor my redo log write activity I have only
10-12MB/sec on write activity, which is giving me on x3 of 1GB logs at
least 200 sec before there will be no free space in my redo logs!
- So what I'm doing wrong during these 200 sec to arrive into a bad situation when I don't have a free space anymore?..
Looking on all of these points make me thing that it doesn't really matter how many dirty pages we've estimated to flush.. What is really important - we have just to follow a redo log activity to be sure there is always a free space in redo logs! And all we need is just flush enough to free the tail of the redo logs on the same speed as the redo log is filled :-))
To implement such a solution we have to get a look on how the batch flush function is called within InnoDB:
-
Initially it was buf_flush_batch() function, and since
5.5.4 it's buf_flush_list() function which has only 2
arguments: number of pages to flush and the max age of pages to flush..
-
Curiously that over all history of InnoDB the second argument was
always equal to the MAX possible value (IB_ULONGLONG_MAX) - which
means that when we involve the flush batch there is no guaranty the
most oldest dirty pages will be flushed first! And by flushing an
estimated amount of pages we may still have a tail of redo logs not
freed (well, correct me if I'm wrong, but it's an impression I've
got..)
-
So the idea is simple: instead of IB_ULONGLONG_MAX as max page age
argument give an age based on the redo log tail age ! :-))
- NOTE: going ahead, XtraDB is already using a different value instead of IB_ULONGLONG_MAX within "estimate" option for Adaptive Checkpoint, but on the time I've scanned the XtraDB code I did not really catch this part... - and once my own code worked I was finally able to appreciate the XtraDB solution too! Well done, Percona! ;-))
So far, the Implementation logic looks like this:
-
On every 1sec loop of Master thread the local old/previous LSN is kept
-
On every 10sec the global old LSN is kept and the Redo Log write speed
is recalculated as:
LSN_speed = (LSN_speed + ( LSN_current - LSN_old ) / time_spent ) / 2
-
Then when Adaptive Flushing is involved: if redo log is filled in less
then 10% - do nothing; otherwise the flush batch is involved
-
The flush list function is called as buf_flush_list( IO_capacity,
flush_age ) where:
- IO capacity: is simply all 100% of IO capacity setting
- flush_age: oldest page modification + (LSN_speed + (lsn_curr - lsn_old)) / 2
-
So the Flush Age is always adjusted according the avg redo log
activity observed over a time; then the IO capacity settings is
limiting the number of pages to flush in case there are too much
corresponding to the given age limit..
- Optionally, the IO capacity setting is increased by +100 every time when there was met 10 times the redo log occupancy at 75%..
So what about the TPS results now? ;-)) - I've got even slightly better result comparing to XtraDB, but again - single purge thread is not enough to reach a complete stability, and as mentioned in the previous post , you'll need to have a second purge thread or a purge lag fixed. Solution with a Purge Lag still gives a better result, and by setting innodb_max_purge_lag=400000 we obtaining the following result with XtraDB:
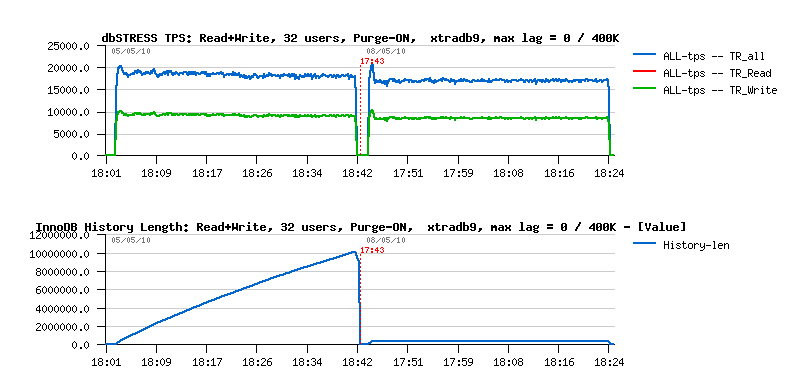
As you see, limiting Purge Lag to 400K is reducing performance (as expected): from ~18.000 TPS we're going to 17.000-17.500 TPS.. However there is a huge changes on the History List length - if before after 40min of activity it grew up to 10M(!!), then now it remains stable at 400K, which is way better for production environment and general workload stability as well..
As before 5.5.4 was worse than XtraDB when the Purge Thread is activated, it was also worse with a Purge Lag limit too.. But now, when the gap is removed, what is the sable result with improved 5.5.4 ?.. ;-))
As you can see, over a time 5.5.4 is now the same or even slightly higher then XtraDB! So the proposed solution seems to work better than current flushing estimation in InnoDB.. - but more testing and also on another workloads will be need to find an optimal way ;-))
I've supposed to finish here, but then entered into another mess...
Single User Performance
To get the final results with a growing number of users I've started a classic workload from 1 to 256 users, and observed absolutely strange things having just a one active user:
As you can see, the proposed (patched) solution brings a total disorder on workload stability when there is not 32 but only one user is running in the database...
Looking on the Checkpoint Age graph - it's clear we're flushing too much here.. But WHY?...
Once again, the answers are coming from the source code:
- For some reasons, Master thread supposing there was no activity during the last period and going to the background loop(!) while there is still one user non-stop bombarding the database with its queries...
- In the background loop Master thread flushing pages fast supposing there is no user activity and killing my single user performance...
Solution:
-
Don't know if I'm right, but it looks like there are several
bugs/improvements to fix/make here..
-
First of all the IO capacity is not used within a background flush
loop, so it may be a source of performance impact when the storage is
shared between several MySQL instances...
-
Then - the user activity within a Master thread is verified via srv_activity_count
variable, and seems in some cases it remains not increased (or
probably my changes involved such a situation), so by increasing its
value inside of the 1sec loop if there were changes in redo log fixed
the problem!
- Finally - in many places operations with a server activity counter are protected by the kernel_mutex, while all information we need about is to know if there was any changes or no, so doesn't matter how much it was increased, it's just compared to its previous value, and only if it's the same - Master thread is going to the background loop... - So WHY protect it by the kernel_mutex while it's already so hot?... :-))
Applying all these changes, I've got the following results:
As you see, it's way better!! :-))
And curiously it's even better now comparing to XtraDB:
Auto Adaptive IO Capacity
There is still possible that even well tuned IO capacity configuration may meet cases when the IO capacity setting may be lower than needed.. And as I said, it should be configurable and up to user decision if writes should be free of limit or not.. In my case I've tested an auto adaptive IO capacity which is incremented progressively every time the redo log free space become close to critical levels..
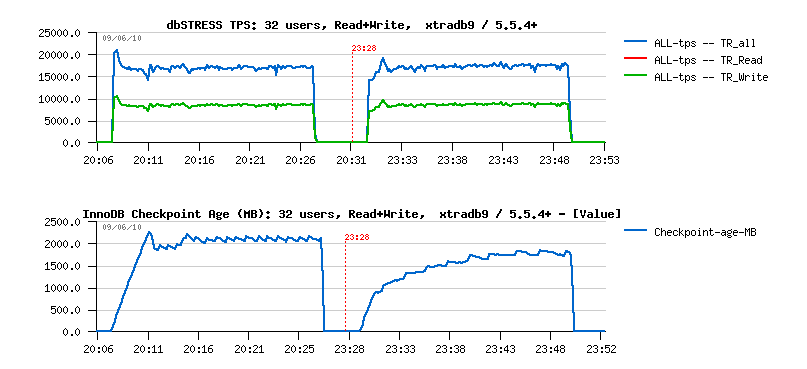
Here is a test I've made to see if over the same period of non-stop Read+Write activity 5.5.4+ will still be able to keep the same performance level if I'll disable max purge lag limit (but purge thread active) - if you remember, the result initially for 5.5.4 was 17.000 TPS, and 18.000 TPS for XtraDB within the same conditions - and now for modified 5.5.4+ :
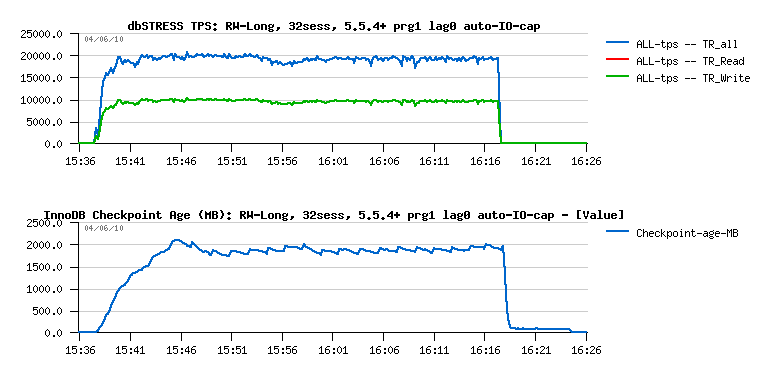
As you can see:
- Performance level remains stable and reaches now higher TPS numbers even than XtraDB :-) and we're not far from the results obtained without using Purge Thread! (similar to what we saw before with MySQL 5.4)
- Auto adaptive IO capacity works well to keep a balance an avoid entering a critical redo log occupancy - BTW, at the end of the test it reached 3600(!) in max - while usually 1500 was enough :-)
- The History Length is reaching 14M(!) at the end of the test, and all these background problems are coming from here - there is more and more unpurged data and every operation become slower and slower.. - Curiously there is not too much more data written to the disks over a time, but InnoDB has to write more over one flush batch to keep enough free space in redo logs...
So far, the work continues, and it's time for vacations now :-))
Any comments are welcome!
Thursday, 20 May, 2010
MySQL Performance: Using Performance Schema
Two weeks ago I was very lucky to meet in Paris Marc Allf (one of developers of MySQL Performance Schema) and get all details about Performance Schema directly from the source :-)
I would say I'm very excited about this feature giving so enormous potential to observe any activity inside of MySQL, as well by a great flexibility of the proposed solution! :-)
However, discussing with Marc and going over a day more and more in depth, I've got some remarks that I needed to group, summarize and then express (and vacation time helping here a lot ;-)) My points will not be about adding some new extensions, but rather fixing some core issues which I consider important (and, please, correct me if you're not agree, express your ideas, etc - it's one of the cases where a quantity of opinions will be easily transformed into the quality solution for sure :-))
The following stuff is not a HOWTO, rather just some ideas based on observations during a test workload. For more information about Performance Schema don't miss an excellent documentation published on MySQL site, as well a really nice example with InnoDB was posted by Jimmy Yang. So, sorry if I'll miss/skip some details - it's already hard to make it short :-)
Performance Impact
First of all I was curious to see the performance impact of using Performance Schema on a heavy database workload. So for my experiments I've used dbSTRESS scenarios with a constant Read-Only or Read+Write workload with 32 concurrent users on the server with 16 cores. InnoDB storage engine was used for all tables during the tests.
Following cases were tested as a start point:
- MySQL server was even not compiled with Performance Schema (None)
- Performance Schema was set OFF (performance_schema=0 (default))
- Performance Schema was set ON (performance_schema=1)
The following graphs are representing observed TPS levels on dbSTRESS corresponding to each case (tests were executed sequentially, one after other).
Read-Only:

As you can see:
- there is no impact on Read-Only until the performance_schema is not set to 1
- once activated, the impact on the Read-Only workload is still minimal - from 30.000 TPS we're going to 28.000 TPS, which is representing 7% (well, I'd prefer less, but 7% is still not too bad :-))
Read+Write:

Thing are changing on Read+Write:
- still no impact until Performance Schema is not enabled
- once activated, the impact here is more important - from 17.000 TPS we're going to 13.500-14.000 TPS, which is near 20% (!) degradation and not good at all..
- on the same time it's easy to understand - the internal MySQL/innoDB contention during Read+Write workload is already very high, so once you add an additional instructions within a critical parts of code it may only become more higher..
Let's see now if a such performance impact can be reduced..
Performance Schema has several "SETUP" tables giving an easy way to change default configuration and adapt accounting setup conditions/rules according your need. One of such tables is "SETUP_CONSUMERS". The default setting (contents) is:
mysql> select * from SETUP_CONSUMERS;
+----------------------------------------------+---------+
| NAME                                         | ENABLED |
+----------------------------------------------+---------+
| events_waits_current                         | YES     |
| events_waits_history                         | YES     |
| events_waits_history_long                    | YES     |
| events_waits_summary_by_thread_by_event_name | YES     |
| events_waits_summary_by_event_name           | YES     |
| events_waits_summary_by_instance             | YES     |
| file_summary_by_event_name                   | YES     |
| file_summary_by_instance                     | YES     |
+----------------------------------------------+---------+
8 rows in set (0.00 sec)
Currently there are 3 account categories:
- high level "summary" tables containing aggregated information by instance, event name, etc.
- middle level "history" tables keeping last series of wait events
- and the lowest level "current" table keeping wait events happening right now
By changing the value of "ENABLED" column to YES or NO you may enable or disable corresponding accounting within Performance Schema. By disabling "events_waits_current" you'll disable a whole accounting (equivalent to disabling Performance Schema). However having "history" accounting disabled makes still possible to account in "summary" aggregates. So the "events_waits_current" is the lowest possible level of accounting and playing the main role for all others.
Now, how the performance impact will be changed if I'll enable only the "events_waits_current" accounting?
mysql> update SETUP_CONSUMERS set ENABLED= 'NO' where NAME != 'events_waits_current';
Query OK, 7 rows affected (0.00 sec)
Rows matched: 7  Changed: 7  Warnings: 0

mysql> select * from SETUP_CONSUMERS;
+----------------------------------------------+---------+
| NAME                                         | ENABLED |
+----------------------------------------------+---------+
| events_waits_current                         | YES     |
| events_waits_history                         | NO      |
| events_waits_history_long                    | NO      |
| events_waits_summary_by_thread_by_event_name | NO      |
| events_waits_summary_by_event_name           | NO      |
| events_waits_summary_by_instance             | NO      |
| file_summary_by_event_name                   | NO      |
| file_summary_by_instance                     | NO      |
+----------------------------------------------+---------+
8 rows in set (0.00 sec)

mysql>
Read+Write (results including a "current-only" accounting):

Observations:
- TPS level is now around of 15.000(!) - it's better, but still 12% degradation comparing to 17.000 TPS
- I've added a mutex waits graph here based on information reported by InnoDB (show mutex)
- As you may see in all cases the workload is starting by jump of waits on index mutex, then drop down, then in few minutes waits become stable...
Let's get a more close look during a "stable" period:

Observations:
- Comparing to the "normal" state, we may see many mutex waits increased once Performance Schema is enabled
- kernel mutex waits are increased by x3 from ~1000 to ~3000 (srv/srv0srv.c)
- buffer mutexes waits are also increased, but the kernel mutex waits should be the main factor here (and seems the index mutex waits were decreased due contention moved to the kernel mutex)..
- using only "current" accounting reducing mutex waits, but still has %12 overhead..
- again - on the lowest possible instrumentation level there is already %12 performance degradation!
So, let's see more in details what's going here with those mutexes ;-)
Having only "current" accounting is probably useful for live debugging, but for a general observation I'll need to activate at least "events_waits_summary_by_event_name":
mysql> update SETUP_CONSUMERS set ENABLED= 'YES' where NAME = 'events_waits_summary_by_event_name';
Query OK, 1 row affected (0.00 sec)
Rows matched: 1  Changed: 1  Warnings: 0

mysql> select * from SETUP_CONSUMERS;
+----------------------------------------------+---------+
| NAME                                         | ENABLED |
+----------------------------------------------+---------+
| events_waits_current                         | YES     |
| events_waits_history                         | NO      |
| events_waits_history_long                    | NO      |
| events_waits_summary_by_thread_by_event_name | NO      |
| events_waits_summary_by_event_name           | YES     |
| events_waits_summary_by_instance             | NO      |
| file_summary_by_event_name                   | NO      |
| file_summary_by_instance                     | NO      |
+----------------------------------------------+---------+
8 rows in set (0.00 sec)

mysql>
Then reset the summary per name accounting (the table corresponding to this data is called "EVENTS_WAITS_SUMMARY_BY_EVENT_NAME", so to reset you just need to truncate this table):
mysql> truncate table EVENTS_WAITS_SUMMARY_BY_EVENT_NAME;
Query OK, 0 rows affected (0.00 sec)
Then restart my test again ;-)

Observations:
- Still 15.000 TPS!
- means by wait name aggregation is not decreasing performance!
But what can we discover now via Performance Schema?..
Let's see the top 7 wait events during Read+Write workload:
mysql> select EVENT_NAME, COUNT_STAR, SUM_TIMER_WAIT
from EVENTS_WAITS_SUMMARY_BY_EVENT_NAME
where count_star > 0
order by SUM_TIMER_WAIT desc limit 7;
+--------------------------------------------+------------+------------------+
| EVENT_NAME                                 | COUNT_STAR | SUM_TIMER_WAIT   |
+--------------------------------------------+------------+------------------+
| wait/synch/mutex/innodb/kernel_mutex       |  158217608 | 1232782089422208 |
| wait/io/file/innodb/innodb_log_file        |   18585756 |  321430981380938 |
| wait/synch/mutex/innodb/buf_pool_mutex     |   81590186 |  110569541099368 |
| wait/synch/mutex/sql/MDL_map::mutex        |   36280653 |  101617775779338 |
| wait/synch/mutex/sql/LOCK_open             |   71053737 |   39460113468230 |
| wait/synch/mutex/innodb/buffer_block_mutex |  149481944 |   21384268657882 |
| wait/synch/mutex/sql/LOCK_global_read_lock |   52214671 |   14988152509694 |
+--------------------------------------------+------------+------------------+
7 rows in set (0.00 sec)
That becomes very interesting:
- As I already supposed, having the highest number of waits doesn't yet mean the lock is having the hottest contention.. - but the waited time does! :-)
- "kernel_mutex" and "buffer_block_mutex" are having a similar number of waits, however a time spent on the "kernel_mutex" waits is over x100 times higher!
- BTW, we even don't see index mutex int the top 7 wait times ;-)
- So, the "kernel_mutex" is keeping here the first place
- While the second one is on the redo log file writes! - however still 10 times lower than kernel_mutex :-)
- Then buffer pool mutex is sharing the third place with MDL_map mutex waits..
- Whet is interesting here also: the contention on LOCK_open was resolved by introducing of MDL in 5.5.4, however according to what I can see here, the contention is moved now in MDL :-) means still need to be fixed..
Now, can I believe to what I see here?.. - the kernel mutex seems to be the hottest, but how can we be sure it's not due instrumentation code?..
Let's see what will be the result if we'll disable any mutex accounting. To do this we need to operate first with the SETUP_INSTRUMENTS table (for every NAME it keeps the setting state for ENABLED and TIMED):
mysql> update SETUP_INSTRUMENTS set ENABLED = 'NO', TIMED = 'NO' where NAME like '%mutex%';
Query OK, 121 rows affected (0.00 sec)
Rows matched: 121  Changed: 121  Warnings: 0
The new result is here:

Observations:
- We're now near 16.000 TPS! - means only 6% in performance degradation (which is way better, but we're missing all information about mutexes)..
- It also demonstrates the impact of mutex instrumentation within Performance Schema - there is something to optimize for sure..
Let's see what are the top 7 waits now:
mysql> select EVENT_NAME, COUNT_STAR, SUM_TIMER_WAIT
from EVENTS_WAITS_SUMMARY_BY_EVENT_NAME
where count_star > 0 order by SUM_TIMER_WAIT desc limit 7;
+------------------------------------------------------------+------------+-----------------+
| EVENT_NAME                                                 | COUNT_STAR | SUM_TIMER_WAIT  |
+------------------------------------------------------------+------------+-----------------+
| wait/io/file/innodb/innodb_log_file                        |   19467181 | 337391150792878 |
| wait/synch/rwlock/sql/LOCK_grant                           |   26426964 |   5980185397914 |
| wait/synch/cond/sql/Query_cache::COND_cache_status_changed |     182386 |   5504284262672 |
| wait/io/file/innodb/innodb_data_file                       |      24829 |   3915749095700 |
| wait/synch/rwlock/innodb/buf_block_lock                    |     286027 |     23545903550 |
| wait/synch/rwlock/sql/LOCK_system_variables_hash           |        128 |        23642138 |
| wait/synch/rwlock/sql/LOCK_dboptions                       |         32 |         8600878 |
+------------------------------------------------------------+------------+-----------------+
7 rows in set (0.00 sec)
Observations:
- Waits on redo log writes now on the first position
- LOCK_grant on the second (is it normal it's called so often?..)
- And I was really surprised to see waits related to query cache while it's disabled! - is it normal too?..
- And only then we're hitting waits on the data files writing... - hmm.. very interesting..
So, I was curious to see if TPS wil be better if I'll disable now the accounting on "rwlock" names too?..
mysql> update SETUP_INSTRUMENTS set ENABLED = 'NO', TIMED = 'NO' where NAME like '%rwlock%';
Query OK, 20 rows affected (0.00 sec)
Rows matched: 20 Changed: 20 Warnings: 0
The new result:

Still the same 16.000 TPS. And the top 7 waits are now:
mysql> select EVENT_NAME, COUNT_STAR, SUM_TIMER_WAIT
from EVENTS_WAITS_SUMMARY_BY_EVENT_NAME
where count_star > 0 order by SUM_TIMER_WAIT desc limit 7;
+------------------------------------------------------------+------------+-----------------+
| EVENT_NAME                                                 | COUNT_STAR | SUM_TIMER_WAIT  |
+------------------------------------------------------------+------------+-----------------+
| wait/io/file/innodb/innodb_log_file                        |   19324916 | 334853972005878 |
| wait/synch/cond/sql/Query_cache::COND_cache_status_changed |     181392 |   5652267868910 |
| wait/io/file/innodb/innodb_data_file                       |      24876 |   3727374241032 |
+------------------------------------------------------------+------------+-----------------+
3 rows in set (0.00 sec)
Observations:
- Waits on "rwlock" names are gone as expected
- It did not make any big changes on other waits, so we can be sure they were not provoked by "rwlock" instrumentation background effects :-)
- Once again, strange to see a query cache related waits.. :-)
To be sure now the problem is not coming from TIMED accounting, I'll try a test with all NAME accounting enabled but with disabled time accounting:
mysql> update SETUP_INSTRUMENTS set ENABLED = 'YES', TIMED = 'NO';
Query OK, 217 rows affected (0.00 sec)
Rows matched: 217 Changed: 217 Warnings: 0
The new result:

Hmm.. - We're back to 15.000 TPS again?...
And what about top 7 wait numbers now? -
mysql> select EVENT_NAME, COUNT_STAR, SUM_TIMER_WAIT
from EVENTS_WAITS_SUMMARY_BY_EVENT_NAME
where count_star > 0 order by 2 desc limit 7;
+---------------------------------------------------------+------------+------------------+
| EVENT_NAME                                              | COUNT_STAR | SUM_TIMER_WAIT   |
+---------------------------------------------------------+------------+------------------+
| wait/synch/mutex/innodb/kernel_mutex                    |  155087534 |  126763742418976 |
| wait/synch/mutex/innodb/buffer_block_mutex              |  146812631 |  165945812893432 |
| wait/synch/mutex/innodb/buf_pool_mutex                  |   85353157 | 2081293853476058 |
| wait/synch/mutex/sql/LOCK_open                          |   69641679 |   53903993714220 |
| wait/synch/mutex/sql/LOCK_global_read_lock              |   51163779 |   39601211521560 |
| wait/synch/mutex/sql/MDL_map::mutex                     |   35567564 |   27529970557804 |
| wait/synch/mutex/sql/Query_cache::structure_guard_mutex |   25581890 |   19800605760780 |
+---------------------------------------------------------+------------+------------------+
7 rows in set (0.00 sec)
Observations:
- First of all I'm surprised to not see a zero value in the SUM_TIMER_WAIT column! - is it a trash and should be ignored? or is it a bug and there is still some time accounting is happening even when it's disabled?..
- There is definitively something going not optimal - the accounting of number of waits should be the most light weight and should not bring a such important performance degradation!.. - it's seen with a similar "show mutex" within InnoDB and there is no reason why it cannot be done within Performance Schema too..
- However, if I can believe what I see - the wait numbers are very interesting here :-) Because LOCK_open & MDL are still here ;-) and curiously disabled query cache too ;-)
Now.. - What if the main problem is coming from the hottest "kernel mutex"?.. Let's disable accounting just on the "kernel mutex" and see how it'll change things:
mysql> update SETUP_INSTRUMENTS set ENABLED = 'YES', TIMED = 'YES';
Query OK, 217 rows affected (0.00 sec)
Rows matched: 217  Changed: 217  Warnings: 0

mysql> update SETUP_INSTRUMENTS set ENABLED = 'NO', TIMED = 'NO' where NAME like '%kernel_mutex%';
Query OK, 1 row affected (0.00 sec)
Rows matched: 1  Changed: 1  Warnings: 0
The new result is here:

Observations:
- The result is not really better (or just slightly better) - still around of 15.000 TPS
- That means the performance impact is somewhere inside of the mutex instrumentation globally within Performance Schema..
And what are the top 7 waits now?..
mysql> select EVENT_NAME, COUNT_STAR, SUM_TIMER_WAIT
from EVENTS_WAITS_SUMMARY_BY_EVENT_NAME
where count_star > 0 order by 3 desc limit 7;
+---------------------------------------------------------+------------+-----------------+
| EVENT_NAME                                              | COUNT_STAR | SUM_TIMER_WAIT  |
+---------------------------------------------------------+------------+-----------------+
| wait/io/file/innodb/innodb_log_file                     |   18687653 | 328447818062000 |
| wait/synch/mutex/innodb/buf_pool_mutex                  |   82809405 | 122379714665884 |
| wait/synch/mutex/sql/MDL_map::mutex                     |   35427655 | 100051628180218 |
| wait/synch/mutex/sql/LOCK_open                          |   69335282 |  38925098359264 |
| wait/synch/mutex/innodb/buffer_block_mutex              |  148084516 |  21364777588960 |
| wait/synch/mutex/sql/LOCK_global_read_lock              |   50918129 |  14015063815792 |
| wait/synch/mutex/sql/Query_cache::structure_guard_mutex |   25459066 |  10364875712542 |
+---------------------------------------------------------+------------+-----------------+
7 rows in set (0.00 sec)
Observations:
- The top wait time now is on redo log writes (and I'm curious to understand if it's really true.. - because I've used innodb_flush_log_at_trx_commit=2 setting and my redo log files are placed on SSD volume.. - will be interesting to observe if it'll be still similar if I'll use a RAM disk instead ;-))
- Curiously MDL+LOCK_open wait time is not far from buffer pool mutexes - probably it's still need to be improved..
- Anyway, it's quite positive to bring to the light other waits than InnoDB mutexes - it's the part of puzzle which was always missed before, and now we may compare servers as apples to apples without platform dependency! ;-)
So far, what can be improved here?..
Performance and Instrumentation
Usually performance analyzing and application tracing/instrumentation are very often going together. Because if you really need to understand what's going wrong inside of your application you need to trace it. From the other hand, if your tracing solution has an important impact on performance - very quickly you'll no more able to confirm you're tracing a real problem, or a problem may just may be gone due tracing as some critical parts will run slower and not making contention anymore, etc...
Let's start with a dumb example :-)
Here is a dumb C code I'm using usually to explain a potential impact of DTrace while tracing an unknown binary:
#include <stdio.h>

#define MAX  20000
#define LOOP 100000

main( int argc, char *argv[])
{
 int i;
 long t1, t2;

 printf( "My PID: %d\n", getpid() );
 sleep( 15 );
 puts( "Start.." );

 time( &t1 );
 for( i= 0; i < MAX; i++ )  fun();
 time( &t2 );

 printf( "Time: %d sec.\n", t2 - t1 );
}

fun()
{
 f1(); f2(); f3(); f4(); f5();
}

f1() { int i,n; for( n= 0; n < LOOP; n++ ) i*= n; }
f2() { int i,n; for( n= 0; n < LOOP; n++ ) i*= n; }
f3() { int i,n; for( n= 0; n < LOOP; n++ ) i*= n; }
f4() { int i,n; for( n= 0; n < LOOP; n++ ) i*= n; }
f5() { int i,n; for( n= 0; n < LOOP; n++ ) i*= n; }
This program has no real goal :-) It just execute function "fun()" MAX times. Then function "fun()" executes functions f1,f2..f5 - each of them is just doing LOOP times a loop on multiplication. So int total there will be executed a number of loops equal to: MAX * 5 * LOOP. And from the application point of view nothing will be changed if I'll increase the MAX by 10 and decrease the LOOP value by 10 too - there will be still the same number of loops executed, and the execution time will not vary to much due such changes..
Now let's see what will happens if I'll trace this program with DTrace supposing I have no idea what this program binary is doing and just want to discover what kind of functions are executed inside, how often, and how much time we spent inside..
I'll use the following (classic) DTrace script here:
#!/usr/sbin/dtrace -s

pid$1:a.out::entry
{
 self->t[probefunc]= timestamp;
}

pid$1:a.out::return
/self->t[probefunc]/
{
 elapsed= timestamp - self->t[probefunc];
 @s[probefunc]= sum(elapsed);
 @c[probefunc]= count();
 self->t[probefunc]= 0;
}
Script is just taking a PID as argument, and then by Control-C is printing the list of functions called (how many times, and a time spent within each function). The program is printing its PID on the start and waits 15 sec to leave me a time to start DTrace script before it will start looping :-)
So far, without tracing, the program is taking 31 sec to execute on my old AMD box. And 32 sec under DTrace script tracing. Well, 32 vs 31 sec is not too much, right? Let's see now how the time will be changed if I'll change MAX and LOOP values:
| MAX | LOOP | Normal Time | Under tracing |
| 20000 | 100000 | 31 sec | 32 sec |
| 200000 | 10000 | 31 sec | 37 sec |
| 2000000 | 1000 | 32 sec | 73 sec |
| 20000000 | 100 | 32 sec | 372 (!) sec |
As you cant see, in worse cases the binary took over x2 times, then over x10 (!) times more to do the same work!... - Why?.. - just because the code added on the fly by DTrace instrumentation has a cost! - and by reducing the time we stay inside of the each function we amplified it by so much!..
Of course, we may also simplify the trace script and trace only call numbers:
#!/usr/sbin/dtrace -s

pid$1:a.out::entry
{
 @c[probefunc]= count();
}
But the thing will still not be too much better - in the worst case instead of 372 sec we'll get 122 sec, so still near x4 times slower than a normal execution time of the same program!
While DTrace is an absolutely great tool, in the current case you have to understand what you're doing - you're introducing additional instructions into your code, and more short the portion of your code will be - more important performance impact you'll see! Dtrace has no idea about your binary. But if you have - you may do it in right way :-)
For example here a simple adding of counter++ inside of each function should not bring any important slow down on execution :-))
Now what about MySQL and Performance Schema?..
MySQL is not an unknown binary for Performance Schema instrumentation :-) so it can be done in much more lightweight way comparing to the previously presented observations!
For example if we take "kernel_mutex" - in many places it's called just to protect one or few instructions! (well, probably the usage of this mutex should be also optimized :-)) but we're speaking about tracing and instrumentation for the moment :-))
So, how the things may be changed?..
Counters - The first step should be done on accounting of the number of events - there is nothing more lightweight than a simple "count++" :-)) and there are many currently already introduced here and there inside of the MySQL code as well every storage engine. These all counters should be remapped to the same place to avoid to count the same information twice and should be always accounted, without regarding if Performance Schema is enabled or not! Keep in mind that operation:
if( tracing ) count++;
is more costly rather simple:
count++;
That's why counters should be always available without any check condition - it gives a lower performance impact :-))
Another point - it'll be also fine to have not only a number of waits, but also a number of access/calls (it'll be probably just another count++ in another place, but will give a great overview of many other issues: which file/table is accessed more than others, which mutexes are the most involved, etc.)...
Time accounting - as you saw previously, having a high number of some wait events is not yet meaning we found the source of performance problem.. - some other events may have lower wait numbers, but way more high summary wait time! - and in many cases timing is the only way to find the real source of the problem. From the other hand, time measurement is much more costly than a simple counter. So this operation should be checked first by the "IF" condition (as it's done currently) and executed on demand for each event if its TIMED setting is set to YES (as it's done currently)..
Aggregation - is very useful, but may be very costly as well :-) so should be re-viewed and re-optimized again.. - in many cases aggregation may be done on demand and during the query execution (for ex. for permanently presented objects like mutexes/ files/ etc)..
Performance Schema access - currently we may access performance
data and execute an SQL query only via a normal MySQL session.. - means
we're in the same wait queue with other sessions to execute our query.
I'll be much better to have say a dedicated port for Perf queries to
access data in priority, or via SHM (as it made in Oracle for ex.) and
access perf data live without introducing any activity into MySQL server
processing (it'll be the most clean solution).
Call to action :-)
I think currently we're missing feedbacks from real tests / workloads whenever it's possible:
- What kind of performance impact do you observe on your workload when Performance Schema is enabled?..
- Are the numbers you're observing via Performance Schema reflecting your activity right?..
- What kind of information you're missing?..
- Etc. etc. etc. :-)
Any comments are welcome! :-)
Monday, 03 May, 2010
MySQL Performance: Improving Stability
Huge performance improvement was came with MySQL 5.5.4, and looking on the following picture it's very easy to see why:
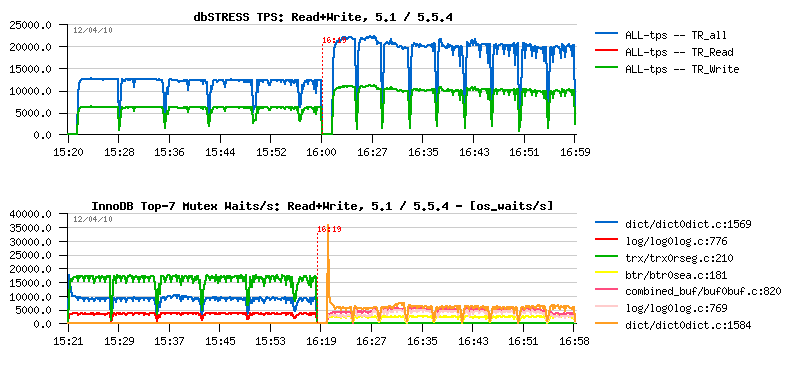
It's a one hour Read+Write dbSTRESS workload with 32 sessions running non-stop on 16 cores server. The left part of the picture corresponds to MySQL 5.1 activity, and the right one to MySQL 5.5.4. The first graph represents TPS levels, and the second one - the mutex waits observed during each test.
Even without going in details you may see how dramatically were reduced mutex waits! And I would say one of the greatest InnoDB features was a compact presentation of the "show innodb mutex" output which gave the way to monitor InnoDB more in depth and understand its contentions on each workload! - it's still not perfect, but anyway a big step ahead :-) and helped a lot to improve 5.5.4.
From the mutex waits graph you may see that the most hot "visible" contention now is on the index mutex (well, the output "file:line" is probably better for debugging rather a normal use - it's one of the things to improve here, just to be more human friendly and show a mutex name instead, as well the code is already there and require a small format changes)..
From the other side, purge lagging is another problem - you may see the same (apples to apples) workload on MySQL 5.1, MySQL 5.5.4 and XtraDB 9.1:
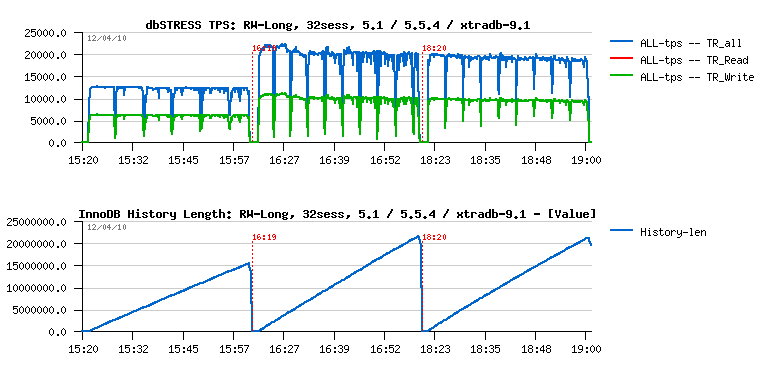
The first graph is still representing the TPS level, and it's interesting to see the potential performance gap between 5.5.4 and XtraDB during the first 10-15 min of test (and if we stop the test here we'll simply miss the next problem and will not see decreasing performance with a time on both engines due purge lagging..). The second graph represents the InnoDB history length, and as you may see it's growing now even faster than before! :-) And the problem is supposed to be fixed with a purge thread.. But let's get a look on one problem at a time :-)
Index Mutex Contention
It'll be great just to get it fixed ;-) But as you know, an simple way to reduce contention on a single mutex is to split this mutex into several ones (so you'll split your contention too, and instead of having say a one single session working at a time - you'll have several sessions working, etc.). And currently MySQL has a nice feature - PARTITIONS! :-) By using partitions on a table having index mutex contentions will simply split this contention by number of partitions! (for example using 3 partitions will physically split your table into 3 tables (even you'll still see it as a single one), and instead of one index mutex you'll have 3 mutexes as well dividing your contention by 3 probably too :-))
However on the next picture you may see the performance impact on 5.5.4 by using 3 partitions on the hottest table during the same Read+Write workload as before:
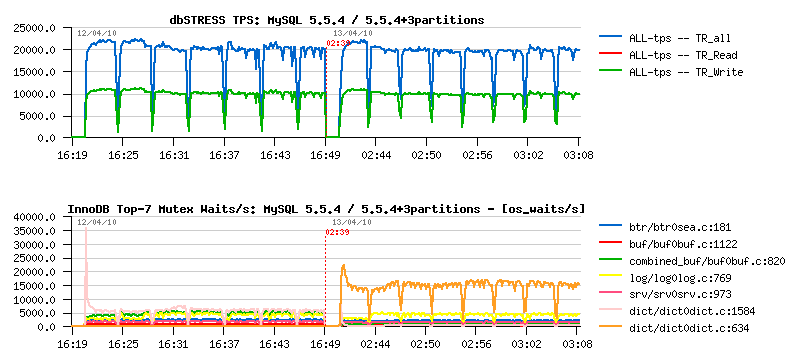
As you may see, curiously TPS level did not change... And we may suppose that partitions would not help here if we did not have improved mutex status within InnoDB and did not see there is another mutex waits jumped to the top and become more hot once we used 3 partitions! (while index mutex was really readuced! - that's why monitoring is so important :-))
What about this new mutex waits? - this is a dictionary lock on stats update. The fix was already proposed by Percona, and is not yet present in the current 5.5.4 tree - but as it's just a one line changes I've tried to see what if it'll be done on 5.5.4:
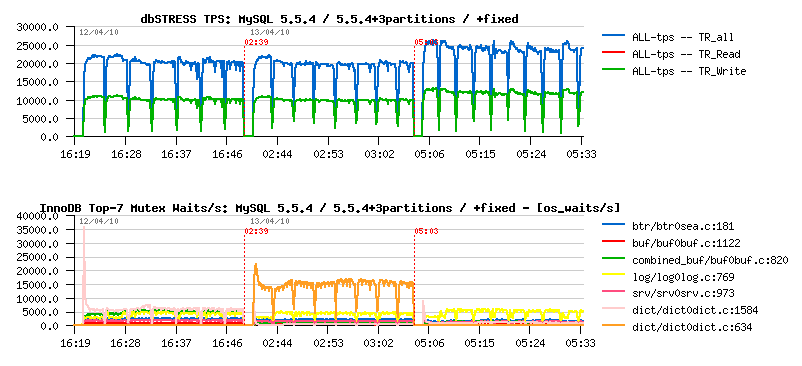
As you can see, the TPS level is improved! (over 20% gain!), and the main "visible" mutex waits are now on the redo logs - which may probably be considered as expected contention for a database in general :-)
But where we're with a history length now?..
Purge Lagging
Now let's get a look on the same workload but from the stability perspective.. Having constantly growing history length is not normal and quite dangerous! As well having periodic performance drops is not better too :-) And the Purge Thread feature is the answer here. But let's look in details how it'll help - the following picture represents the same workload tested on:
- MySQL 5.5.4
- MySQL 5.5.4 +purge thread
- MySQL 5.5.4 +3 partitions
- MySQL 5.5.4 +3 partitions +purge thread
The first graph is TPS, the second one is History length:
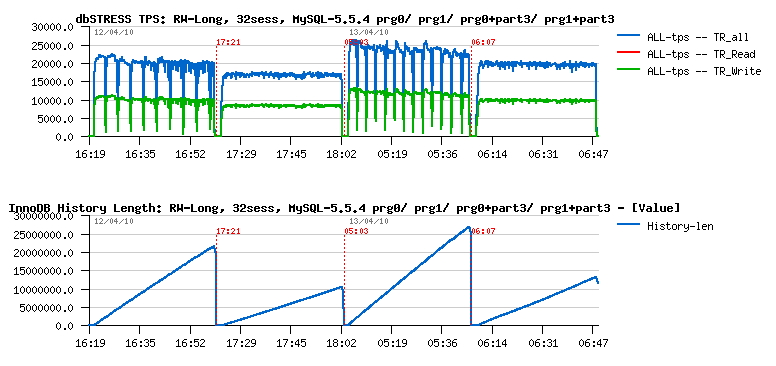
As you may see, Purge Thread brings an important stability to the workload. However a single purge thread is no more enough to follow a purge demand here!..
Currently 5.5.4 implementation allows only one purge thread for the moment. But to analyze a performance impact we may try XtraDB which already allows several purge threads. The following picture represents the same Read+Write workload running on XtraDB 9.1 using 3 partitions and tested:
- without purge thread
- with 1 purge thread
- with 2 purge threads
The first graph represents TPS level, and the second one History length:
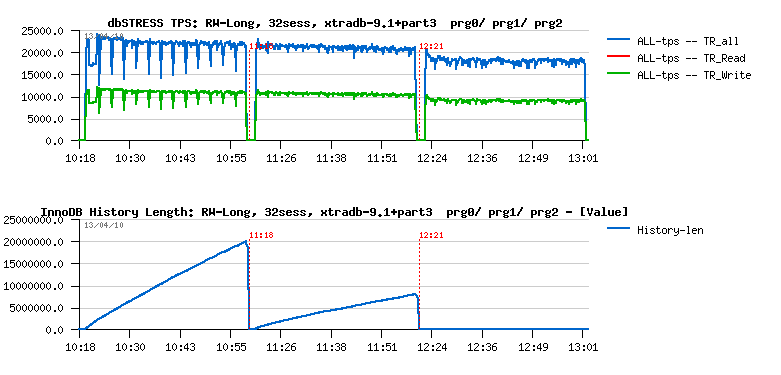
As you may see having 2 purge threads are completely removing purge lagging here! However it's also significantly reducing performance..
Can do we better here?.. - let's try ;-)
For a long time InnoDB has a purge lag configuration option - you can limit purge lagging with innodb_max_purge_lag by setting it to some acceptable level of History length, then once this limit will be reached InnoDB will slightly slow down all arriving DML queries by doing a short sleep (few ms) before processing a query statement. The feature itself is not bad, and many file systems are having a similar solution to throttle a high demand write requests. The only problem with InnoDB purge lag feature that it's broken seems to me, and I've explained why and how to fix it . Now if I apply the fix to XtraDB and see the result ;-)
What I'm interesting here is to compare:
- single purge thread + fixed purge lag
- two purge threads
Of course fixed purge lag without purge thread cannot give us a stable result due all missed maintenance work missed by Master thread (as explained in the previous post ). However, having one purge thread and throttling writes via max purge lag setting may still give a better result than having 2 purge threads..
On the following picture you may see the same Read+Write workload running on XtraDB 9.1 and now comparing:
- XtraDB without purge thread
- XtraDB with a single purge thread
- XtraDB with 2 purge threads
- XtraDB with a single purge thread + fixed max purge lag
The innodb_max_purge_lag was set to 400K here:
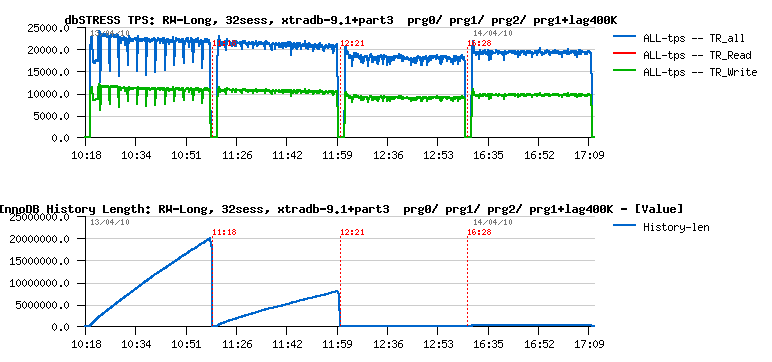
As you see, the tandem of single purge thread + fixed purge lag gives a better result here than 2 purge threads - TPS level is higher while History length is constantly kept under 400K! :-)
Why on my point of view such a solution will be more optimal?
- in many cases one purge thread will be probably just enough
- however when it'll be not enough - your server will still be protected by the max purge lag setting!
As always, many things depends on workload, and your experience may be different of mine.. - but tests and observations will be done, better MySQL performance will be with a time :-)
Any comments are welcome! ;-)
Tuesday, 13 April, 2010
MySQL Performance: 5.5.4 @dbSTRESS
Today we have something to celebrate - the MySQL 5.5.4 was announced! And a huge number of performance improvement made in this version make me very happy :-))
I've got an immense pleasure to participate in this story and seek for the most optimal solutions together with all these talented engineers from MySQL/Sun/InnoDB/Oracle teams (and in few months all Oracle :-)) - and I think it was a huge step ahead to see how well we may all work together :-))
And now I'm happy to share with you my results obtained with MySQL 5.5.4 on dbSTRESS benchmark. All tests were executed on the 32cores Intel server running Fedora 10 and having 128GB RAM and absolutely fast internal SSD drives (and if from the memory I've used only 16GB for the buffer pools, the SSD drives helped a lot to reduce any dependency on the I/O activity).
Test scenario :
- Workload(s): Read-Only, Read-Write
- Sessions: 1, 2, 4, 8, 16, 32, 64, 128, 256
- Think time: 0 sec. (non-stop)
Tested InnoDB engine implementations :
- MySQL 5.5.4
- MySQL 5.1.45 with innodb plugin 1.0.6 (I did not test the integrated innodb because we've already demonstrated it last year that 5.1 with integrated innodb is way slower comparing to any other InnoDB engines implementation (including innodb plugin :-))
- XtraDB-9.1
Abbreviations used in graphs :
- concurrency: innodb_thread_concurrency settings
- suffix -prg1: means engine was started with a one purge thread (to see why separated purge thread is needed and what are the benefits you may read my benchmark report when we were the first to propose and published the purge thread patch.
- X axis: number of sessions
- Y axis: number of transactions per second (TPS)
Read-Only Workload
Read+Write Workload
Relaxed Read+Write Workload (10 Reads per Write)
I'll not go too much in details for the moment, but you may already see that:
- MySQL 5.5.4 is reaching higher TPS levels than others
- MySQL 5.5.4 is better prepared now to scale up to 32 cores
Of course it's not perfect yet, but there is already a huge progress was made! Even get a look on the last year's graphs and you'll see what I mean ;-)
More data will come, so stay tuned ;-)
Wednesday, 16 December, 2009
MySQL Performance: Breaking limits with XtraDB !
I've just finished my benchmark report about InnoDB current hottest internal contentions on the dbSTRESS workload. Since InnoDB-plugin-1.0.4 there is an excellent feature was added by Innobase team to monitor internal mutex lock waits: a compact output of "SHOW MUTEX STATUS" become much more useful then before! and helps greatly to understand InnoDB limits!
I've integrated innodbMUTEX stats within dim_STAT monitoring and was able to see performance limits from completely different axes!
Initial results
Initially I've retested again:
- MySQL Perf-build5
- MySQL 5.4
- InnoDB-plugin-1.0.4
- XtraDB-8
on the same workload and using X4450 server (Intel CPU, 16cores, 16GB RAM (unfortunately all more powerful servers were busy :-)) as well it was sad for me that I've not used the updated XtraDB-8 code during my latest tests (there was something wrong with uploaded sources during announces, and I've discovered it only after discussion with Yasufumi)..
And obtained results are looking like this now:
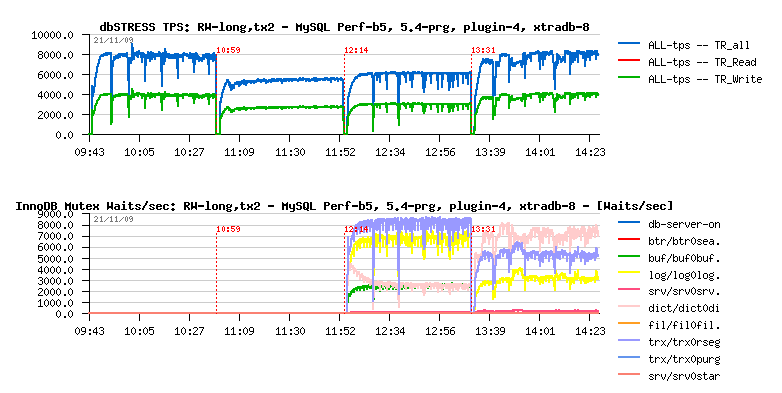
placing XtraDB-8 in the #1 position!
NOTE: lock waits stats are not available for MySQL 5.4 and build5, but
you may compare plugin-1.0.4 and XtraDB-8 profilings - they are very
different the one from other! And observing their lock waits levels you
may easily understand why XtraDB today out-performs all others!..
Going further with XtraDB
And then I continued my investigations mainly with XtraDB, because:
- Because it has already combined together all most important improvements from MySQL 5.4 and InnoDB-plugin!
- And it has already several "ongoing" improvements integrated! :-)
- And it has its own valuable ideas! :-)
- It even has now a separated purge thread feature implemented! (it was not announced in the list of features for XtraDB-8, but you may find a new configuration parameter innodb_use_purge_thread (=0/1))
- It already implements buffer mutex split (and that's why we did not observe buffer lock waits!)
- It already implements extended rollback segments!
- And it already implements some fixes for dictionary locks!
So, until all these features are not shipped "officially" - it's very easy to validate their impact on your workload with XtraDB, and I'm pretty sure - more cases will be tested, better MySQL/InnoDB will be in the future! Don't wait! :-)
I'll avoid to copy & paste my report to the blog post, and will just say you that I was able to improve performance by 37% (!) again by using available in XtraDB features!
All details you may find within my benchmark report: http://dimitrik.free.fr/db_STRESS_XtraDB-8_Performance_Dec2009.html
Any comments ate welcome! And I'll be happy if you may share any lock waits observations regarding your own workloads (production or testing - doesn't matter)!
As the last word I want just to say: kudos Percona! :-) XtraDB once again become the performance #1 and going ahead of the all today's available InnoDB engine implementations, and it's great to see such a kind of positioning few days before of incoming XtraDB anniversary! :-)
Friday, 20 November, 2009
MySQL Performance: Conference Session @Paris
I'm presenting during MySQL Performance Session in Paris which will take place on 24th November in our office building - Sun Solution Center, 32 rue Monceau, 75008 Paris. I did not blog about to avoid to increase frustration for all people who cannot attend it.. Because even we reserved for this even the biggest conference hall in the building there is still not enough place to accept everybody.. As well we did not expect so high interest - the first invitations were sent in priority to MySQL customers, and in few days there was already no more place..
So, why I'm writing now? ;-) Just because I'm pretty sure there will be a second session! :-) I cannot say you date & place yet because it'll directly depend on the number of persons willing to attend. And if you have a such willing, please, right now express it by email to Olivier.Beutels(at)sun.com !
List of topics covered during Performance Session:
- MySQL history/development milestones
- MySQL Architecture overview
-
MySQL Storage Engines overview (Pros/Cons)
- MyISAM
- InnoDB
- NDB
- PBXT
- XtraDB
- Falcon
-
MySQL Bottlenecks:
- Data model/design
- Multi-threaded model
- Storage engine
- Internals
- etc.
-
MySQL Performance:
- Solutions
- Scalability
- etc.
-
InnoDB Performance:
- Bottlenecks
- Internals
- Google SMP patches
- XtraDB
- etc.
-
MySQL 5.4
- Improvements
- Internals
- I/O capacity
- I/O threads
- Thread concurrency model
- Benchmark results
- etc.
-
New / Incoming InnoDB improvements:
- Ahead /Adaptive flushing /checkpoint
- Purge lag
- Splitted locks
- Multiple rollbacks
- etc.
-
MySQL Performance Tuning:
- Monitoring
- Configuration
- Best practices
- DTrace
- ZFS
- etc.
-
MySQL & dim_STAT
- mysqlSTAT
- mysqlLOAD
- innodbSTAT
- innodbIO
- innodbMUTEX