« August 2013 | Main | May 2013 »
Saturday, 13 July, 2013
MySQL Performance: Why Performance Schema Overhead?..
As there was a lot of complain recently about various cases with
PERFORMANCE SCHEMA (PFS) overhead, I've decided to start a series of
articles to help you to use PFS in the best way to analyze your
workloads. This is the first part, starting with an overview of
instrumentation problems generally..
First of all, instrumentation
cannot be free! - when you want to trace or get some stats about
your application internals you're adding a new code, and this code is
increasing an overall code path, so your final binary simply cannot run
on the same speed by definition!.. Of course, if your instrumentation
code is poor, the overall overhead will be bigger ;-) but if you're
designing it well, it'll be lower, but still not zero!..
Dynamic
instrumentation brings additional cost - as soon as you're willing
to add some advanced stuff within your instrumentation, it makes sense
to not keep it active all of the time.. - but checking of all these
flag/states on active/inactive will bring additional cost as will
require more additional code to manage it.. (the best realization for
today of dynamic instrumentation will probably attributed to DTrace, but
currently you cannot get it yet available on most of platforms, and
which is remaining a story on itself)..
Instrumentation
overhead is directly depending on event frequency - sounds trivial,
right? - more frequently your instrumentation code is executed - bigger
overhead you may expect. So, before you activate any instrumentations on
some execution levels of your code you have to think about a frequency
of events on this level.. BTW, exactly the same problem you're meeting
with DTrace as well (for ex. see my old article with example
of x10 slowdown under DTrace). However, when we're adding
instrumentation into our own code, we may then keep in mind what kind of
level of event frequency to expect within each part of code, and make
and overhead of such an instrumentation predictable(!)..
All this
sounds simple.. - until we're not starting to feel an overhead directly
related to involved instrumentation ;-) To give you a feeling of what it
could be I wrote a simple "dumb code" of a program which is not doing
anything useful, but just looping to keep CPU warm, and within it loops
checking different conditions ;-) (the full source code you may find
here if you want to play with it too).
The program is calling
recursively Loop_func(), which will do "N" loops of a given level, and
then call "M" times Loop_func() again to involve execution of the next
level (in fact the program is simulating a work like: main()->do some
work-> call function1() -> do some work -> call in loop func2() -> do
some work -> call in loop fun3() -> and so on...)
For a
database code it could be something similar to:
main()
  ...
  '-> loop: execute_SQL_SELECT();    <== level 1
     '-> loop: read_ranges();           <== level 2
        '-> loop: read_rows();             <== level 3
           '-> loop: read_row();              <== level 4
              '-> ...
So, more we're going in depth in levels - bigger a probability that a code on this level is executed more frequently (more loop iterations). And then, we want to instrument it to measure exactly the time we're spending there. And to follow the PFS idea, I'll add the following to my code around call of the Loop_func():
- first I'm able to compile the code with or without "PFS instructions" (depending if PFS_DEF is declared or not)
- then, I'm able "dynamically" enable instrumentation code according the "PFS" arg value
- and then according to enabled instrumentation of each level, I'm then executing or not the instrumentation code on such a level (for TIMED instrumentation I'm using gettimeofday() which is probably not the most optimal, but good for an example)..
#ifdef PFS_DEF
    if( PFS )
    {
      if( Data[ level ].Enabled )  Data[ level ].CNT++;
      if( Data[ level ].Timed )  gettimeofday( &tv1, NULL );
    }
#endif

    Loop_func( level + 1, max );

#ifdef PFS_DEF
    if( PFS )
    {
      if( Data[ level ].Enabled && Data[ level ].Timed )
      {
        gettimeofday( &tv2, NULL );
        Data[ level ].TIMED += (tv2.tv_sec - tv1.tv_sec) * 1000000 + tv2.tv_usec - tv1.tv_usec;
      }
    }
#endif
Hm.. it's probably will be faster for you to read the code than read my explanations ;-)
But well, now how to use this program:
-
first of all, I've compiled 2 binaries:
- one "without PFS enabled" and namedd "pfs_loop-noPFS"
- another with "PFS enabled" (PFS_DEF defined) and named "pfs_loop-withPFS"
-
then I'm executing the program with following arguments:
- $ pfs_loop PFS Loop1_N Loop1_M Instr1 Timed1 [Loop2_N Loop2_M Instr2 Timed2]...
-
where:
- PFS - 1/0: enabled/disabled PFS code
- Loop1_N - number of loops to execute on the "level1" to simulate a kind of work
- Loop1_M - number of loops with call of the Loop_func() function for the next level ("level2")
- Instr1 - 1/0 : enabled/disabled instrumentation on the "level1"
- Timed1 - 1/0 : enabled/disabled TIMED instrumentation on the "level1"
- ... - and so on for each next level
- the total number of levels is calculated then automatically
So far, in the following example I'm executing the "pfs_loop" program with 4 levels in total, on the first 3 levels the program will run 1000 times in the "work loop" (N), and then will 500 times call execution of the next level. And only on the last (4th) level the "work loop" will be shorter - 10 times only (similar like you read few rows from FS cache, etc.)..
The first execution is with a binary without any instrumentation:
$ time pfs_loop-noPFS   0 1000 500 0 0 1000 500 0 0 1000 500 0 0 10 0 0 0
real    0m4.380s
user    0m4.366s
sys     0m0.000s
Now exactly the same thing, but with binary compiled with "PFS instrumentation", but PFS is "disabled"
$ time pfs_loop-withPFS 0 1000 500 0 0 1000 500 0 0 1000 500 0 0 10 0 0 0
real    0m4.551s <-- 4% more..
user    0m4.537s
sys     0m0.000s
The same, but PFS "enabled", but all instrumentations "disabled":
$ time pfs_loop-withPFS 1 1000 500 0 0 1000 500 0 0 1000 500 0 0 10 0 0 0
real    0m4.685s <-- 6.6% more..
user    0m4.671s
sys     0m0.001s
And now "enabling" instrumentation on different levels:
$ time pfs_loop-withPFS 1 1000 500 1 1 1000 500 0 0 1000 500 0 0 10 0 0 0
real    0m4.685s  <-- same 6.6% for "level 1"
user    0m4.671s
sys     0m0.000s

$ time pfs_loop-withPFS 1 1000 500 0 0 1000 500 1 1 1000 500 0 0 10 0 0 0
real    0m4.700s <-- 7.3% for "level 2"
user    0m4.684s
sys     0m0.001s

$ time pfs_loop-withPFS 1 1000 500 0 0 1000 500 0 0 1000 500 1 1 10 0 0 0
real    0m12.864s  <-- 293% for "level 3"
user    0m12.826s
sys     0m0.000s
As you can see, more in "lower level" we're involving instrumentation - bigger overhead we're getting (trivial, right? - on a more lower level the same instrumentation code is executed way more often, so as the result the impact is more bigger too)..
Exactly the same is going with PERFORMANCE SCHEMA in MySQL! - more low level instrumentation you're enabling, bigger overhead you may hit.. However, keep in mind:
- ALL PFS instrumentation is completely dynamic
- at any time you may disable everything!
- you may go very progressively and detailed level by level in instrumentation, just be aware about what exactly you're doing ;-)
Now, let's take a popular example of Sysbench OLTP_RO Point-Select 8-tables workload. This workload on 16cores-HT is getting its max performance level usually on 64 or 256 concurrent user sessions. Let's analyze the PFS impact on this workload on the following situations:
- noPFS -- MySQL binary was compiled without PFS
- withPFS, PFS=off -- MySQL binary was compiled with PFS, but PFS is disabled
- withPFS, PFS=def -- same as before, but PFS is enabled with default instrumentation (as in MySQL 5.6 by default)
- withPFS, PFS=none -- PFS is enabled, but all instrumentations are disabled
So, we're getting:

Observations :
- noPFS : 64usr-> 250K QPS, 256usr-> 280K QPS
- PFS=off : 64usr-> 249K QPS, 256usr-> 275K QPS
- PFS=def : 64usr-> 240K QPS, 256usr-> 260K QPS
- PFS=none : 64usr-> 245K QPS, 256usr-> 270K QPS
- so, in worse case we have 8% "overhead" - 260K QPS -vs- 280K QPS.. (PFS default -vs- compiled without PFS)
- while, "not compiled" -vs- "compiled, but disabled" (noPFS -vs- PFS=off) is "near" the same - only 2% overhead max here..
However, the "default" PFS instrumentation is composed from "table I/O" and "statements/digest" instrumentations, let's see the impact of the each one:

Observations :
- PFS=none : 64usr-> 245K QPS, 256usr-> 270K QPS
- PFS=tables_only : 64usr-> 240K QPS, 256usr-> 265K QPS
- PFS=statements_only : 64usr-> 240K QPS, 256usr-> 260K QPS
- so, as you can see, by disabling statements instrumentation you can reduce the max overhead from 8% to 5%
- and all this dynamic, without MySQL Server restart!
Well, I'll go more in details within next articles, but to finish with this one, let's see how well the "alternative" solutions are working on the same workload...
Let me start with MySQL 5.6 code patched by Facebook and providing TABLE_STATISTICS (and other stats). As mentioned Domas, there is no need any enable/disable settings, just start MySQL server and you get it. So, let's compare its overhead on the same workload with noPFS and PFS=def :

Oservations :
- as you can see, there is near no difference in overhead between PFS=def and Facebook stats instrumentation
- there are the same max 8% overhead -vs- noPFS.. - so, there is no instrumentation without cost, right?..
- while PFS=def is not only have table stats, but also query digest..
- and PFS instrumentation you may dynamically reduce at any moment, while the Facebook code is just here..
Another "alternative" stats solution is implemented in Percona Server, but this instrumentation is dynamic, in fact binary: you may just enable or disable it completely by setting the "userstat" global variable to 1 or 0. Percona Server 5.6 is only RC for the moment, and I was unable to compile it without PFS due errors in Percona code.. So, let's compare it on the same workload with noPFS and PFS=off (the difference in PFS=off config between MySQL 5.6 and Percona 5.6 may be a sign of yet additional overhead coming from the "userstat" related code) :

Observations :
- in fact, yes, MySQL 5.6 max QPS with PFS=off is higher than on Percona 5.6..
- and then, once userstat=1 the regression is horrible.. over 30%...
So, it's very easy to complain about PFS overhead.. - but what if we'll try together to improve it rather to blame?.. ;-)) PFS is an universal solution for MySQL profiling, it has a HUGE power, we all just need to learn how to use it right, and then life will become much more easier.. ;-)
INSTEAD OF SUMMARY :
- Instrumentation is not free ;-)
- Instrumentation of higher frequency events having a bigger overhead!
- PFS is a really great tool, just need some love ;-)
Well, it was only a story about PFS instrumentation overhead, but nothing about practical usage.. So, the next one in this series will be all about practical ;-)
To be continued..
Rgds,
-Dimitri
Monday, 08 July, 2013
MySQL Performance: Analyzing Benchmarks, part 5: TRX list again
It was a long time that I wanted to dig more the solution proposed by
Percona to improve "TRX list" (transactions list) code -- the initial
story by Alexey is starting here,
then my following analyze is here,
and then another test results from Percona are here.
The initial discussion was more related to the READ-ONLY TRANSACTIONS
introduced within MySQL 5.6 (and it was introduced exactly to get a rid
of TRX mutex on read-only requests where transactions are not required
at all). But in the last tests Alexey involved a very good question:
what will be an impact on performance when READ-ONLY TRANSACTIONS
activity is meeting writes from other user sessions?.. - and this is
waked up my curiosity ;-)
Well, I'll try to put things in order,
while unfortunately my analyze cannot be not complete here, as I'm not
allowed to publish results from the MySQL 5.7 latest code until it
became public, so will complete the full puzzle later then ;-)
So,
first of all I'll cover points exchanged within various discussions and
blog comments. One of them was a tested database volume -- from my
observations until now as soon as workload is read-only, and all used
data set in tests is seating in Buffer Pool, and workload queries are
not dependent on the data volume - then there will be near no difference
from the benchmark results on a bigger or a smaller volume.. And
Sysbench POINT-SELECT is a very good example here (as every query is
just reading a single row by its PK). So, on my previous tests I've used
x8 tables of 1M rows. Now I'll replay the same, but with 10M rows (so,
x10 time bigger volume, and filling pretty well my 32GB BP).
To
get the full story shorter, I'll combine it with scalability results.
Don't know why on Percona servers the results on 5.6 and on 5.5 are
looking very similar, but it's pretty different on my 32cores server.
I'm supposing that my server is probably more sensible to any CPU caches
syncs between sockets, but in any case this server is very good for
performance investigations - because once the code is working well on
this host, I'm pretty sure then it'll work very well on any other server
too ;-)
So far, the following graphs are representing the test
results from:
- Workload: Sysbench POINT-SELECT test using x8 tables of 10M rows each, query without transactions
- Concurrent users: 16, 32 ... 1024
- CPU affinity: MySQL Server is running on 16cores, then 16cores-HT, then 32cores, then 32cores-HT (via taskset)
-
Tuning: nothing special, except:
- BP size: 32GB
- BP instances: 32
- innodb_spin_wait_delay=12 (otherwise hitting a regression on Percona-5.5)
Let's get a look on Percona-5.5 results first:
OLTP_RO Point-SELECTs 8-tables x10M @Percona 5.5, 16cores/ 16cores-HT/ 32cores/ 32cores-HT :
Observations :
- The best performance for Percona-5.5 is reached on 16cores-HT configuration
- the max result is 180K QPS
- main bottleneck is on the kernel_mutex contention - interesting that this contention is most seen on configs with HT enabled..
OLTP_RO Point-SELECTs 8-tables x10M @MySQL 5.6, 16cores/ 16cores-HT/ 32cores/ 32cores-HT :
Observations :
- The best performance for MySQL 5.6 is also reached on 16cores-HT config
- the max result is 275K QPS
- performance is lower on 32cores, and then hitting again the trx_sys mutex contention on 32cores-HT..
- so, even if READ-ONLY TRANSACTIONS feature is working well, it hits its limits anyway, and the code needs yet to be improved..
And now to compare apples-to-apples @16cores-HT on the same graph (MySQL-5.6 on the left, Percona-5.5 on the right) :
OLTP_RO Point-SELECTs 8-tables x10M @16cores-HT, MySQL 5.6 -vs- Percona 5.5 :

Observations :
- so far, here you can see a clear benefit of removed kernel_mutex contention in MySQL 5.6
- and benefit of the READ-ONLY TRANSACTIONS introduced in MySQL 5.6 as well
And READ-ONLY TRANSACTIONS were specially introduced to avoid the following situation where the same read-only POINT-SELECT queries are executed within transaction statements:
OLTP_RO Point-SELECTs-TRX 8-tables x10M @16cores-HT, MySQL 5.6 -vs- Percona 5.5 :
Observations :
- so, if transactions are used for RO statements, we're loosing all the benefit of RO transactions feature in MySQL 5.6
- 5.6 is getting a huge regression here (one more reason to use a new feature ;-))
- and since 128 concurrent user sessions the QPS level may only decrease (with increase of trx_sys mutex contention)..
- the "TRX list" patch from Percona is resisting better for Percona-5.5 QPS, while also hitting a regression.. (but not as big as 5.6, and keep better on a high concurrency level)..
- however, seeing regression on Percona-5.5 as well, making me thing that the story is not only about trx_sys contention here..
Well, the next 5.7 code is already auto-discovering READ-ONLY TRANSACTIONS even transaction statements are used, so even in this "non optimal" case there will be no regression (except that CPU time is wasted by transaction statement itself) -- so the question is then only to back port it to 5.6 code or not.. But Alexey is rising a more interesting question: what will be impact on RO transactions if in parallel there will be running a RW workload?.. Because the RO transaction feature is working well just because the "TRX list" is remaining empty.. - what will change for RO users when there will be some active transactions?..
I was unable to reproduce the test used by Alexey due some Sysbench issues (getting deadlocks or internal errors), so I've replaced it by a less artificial and more speaking to me:
- I'm starting a constant OLTP_RO workload with N concurrent users doing the same POINT-SELECT queries on x8 tables
- this OLTP_RO workload is using RO transactions
- and then, in parallel, I'm starting another Sysbench workload doing only OLTP_RW-Updates
- this Updates workload is starting with M concurrent users, where M is 4, 8, 16, 32, 64, 128
- so I'll always have M active transactions within InnoDB + observe the impact of both workloads on each one ;-)
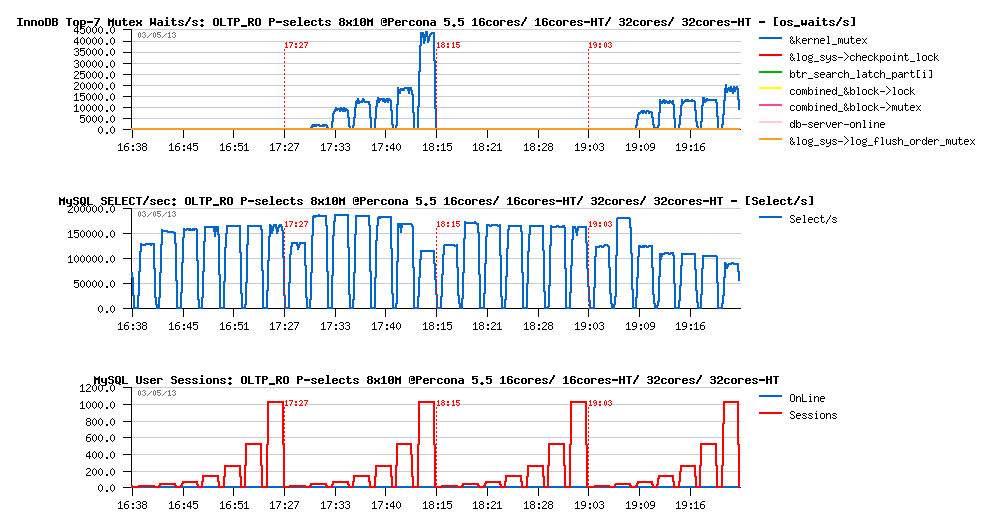
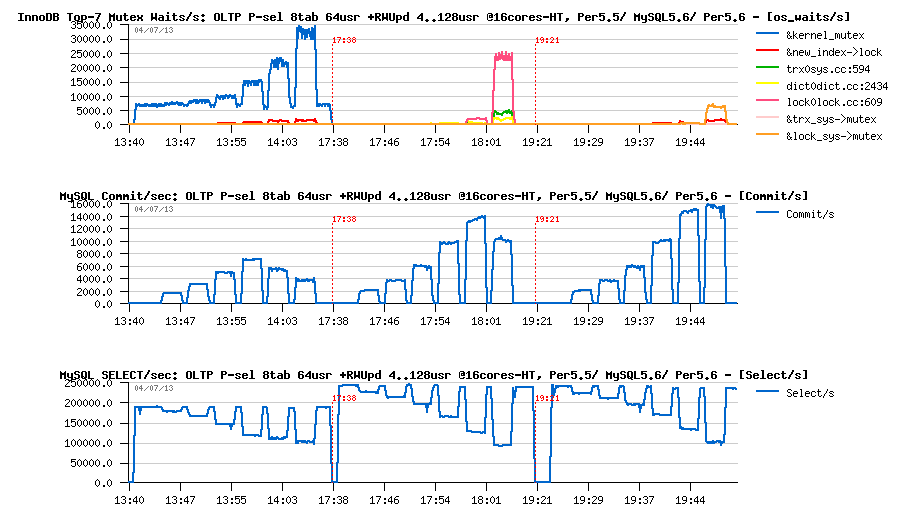
Let's start with 64 concurrent users in OLTP_RO (Percona-5.5 is on the left, MySQL-5.6 on the right).
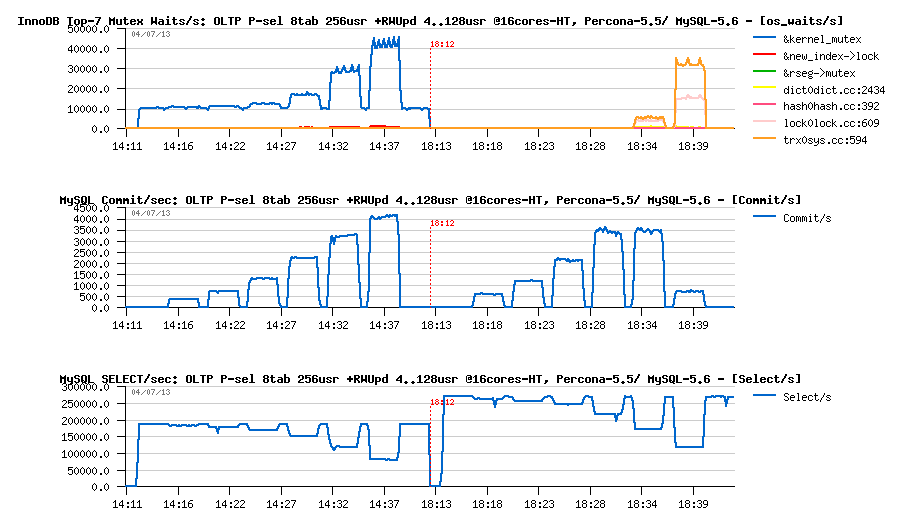
OLTP_RO 64usr + RW-Updates 4..128usr @16-cores-HT, Percona-5.5 -vs- MySQL 5.6 :
Observations :
- Commit/sec graph is reflecting the RW performance during the test
- While Select/sec graph is showing us the RO performance
- So, initially both engines are doing only RO workload and starting from their top levels on 64 users: 185K QPS for Percona-5.5, and 245K QPS for MySQL-5.6..
- then the first 4 RW users arriving, then more and more up to 128..
- as you can see, regression is impacting both engines..
- and at the end of the test both are regressing on RO up to 100K QPS..
- however, on the same time MySQL-5.6 is doing a way higher TPS on RW workload, and the performance result in fact is limited by lock_sys mutex contention, rather trx_sys... - so, it's not as simple ;-)
- and MySQL-5.6 is still looking better here..
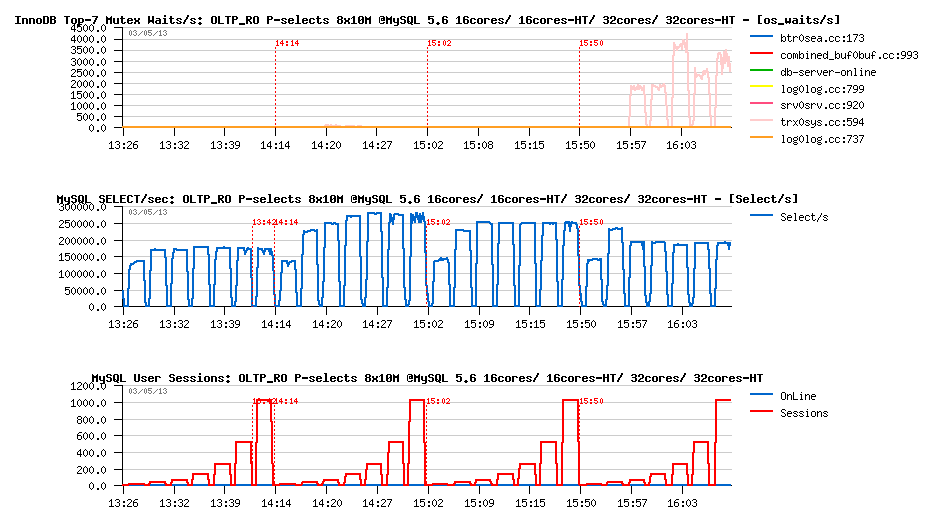
However, things are changed when the same test is executed on 256 concurrent users on OLTP_RO (more concurrent users are creating a more hot contention):
OLTP_RO 256usr + RW-Updates 4..128usr @16-cores-HT, Percona-5.5 -vs- MySQL 5.6 :
Observations :
- MySQL-5.6 is starting from 270K QPS on OLTP_RO and its regression has a less deep then Percona-5.5
- But since 64 concurrent RW users MySQL-5.6 is starting to hit trx_sys mutex contention which is impacting a lot its RW performance..
- and since 128 RW users hitting a dramatic regression on RW workload performance..
Well, all these results were unable anyway to give me a clear picture about what is going internally on all these contentions.. - the difference to day is too huge between the 5.5 and 5.6 code ;-)) So my main expectation was on the apples-to-apples comparison between MySQL-5.6 and Percona-5.6 which is fully based on 5.6 code...
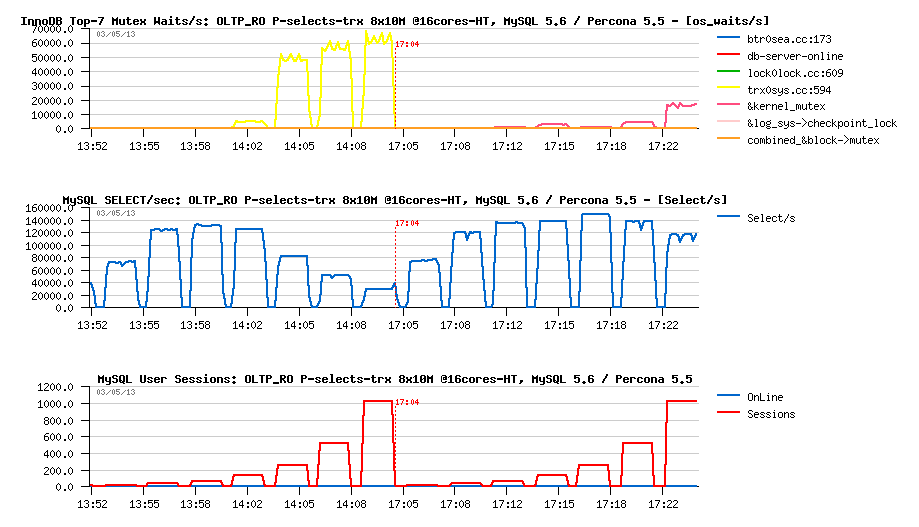
Here are the same tests, but including also results obtained on Percona-5.6-rc within the same configuration:
OLTP_RO 64usr + RW-Updates 4..128usr @16-cores-HT, Percona5.5 -vs- MySQL5.6 -vs- Percona5.6 :
Observations :
- first of all, there is very clearly seen the benefit of the MySQL 5.6 code base - 245K QPS on RO instead of 185K QPS on Percona Server once based on MySQL 5.6 code! ;-))
- then a clear benefit of proposed "TRX list" patch by Percona: by lowering trx_sys mutex contention, it's lowering also as the result the lock_sys mutex contention too..
- which is finally resulting in a better RW performance while keeping exactly the same RO regression..
- however, on this test case we're seeing only a secondary effect of the patch as trx_sys mutex contention is not on the top position..
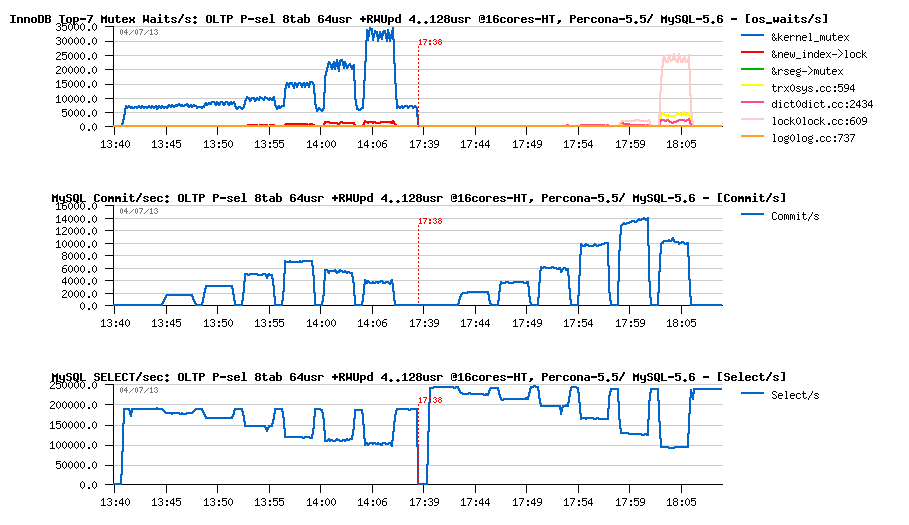
But on 256 RO users we're starting to see it very well:
OLTP_RO 64usr + RW-Updates 4..128usr @16-cores-HT, Percona5.5 -vs- MySQL5.6 -vs- Percona5.6 :
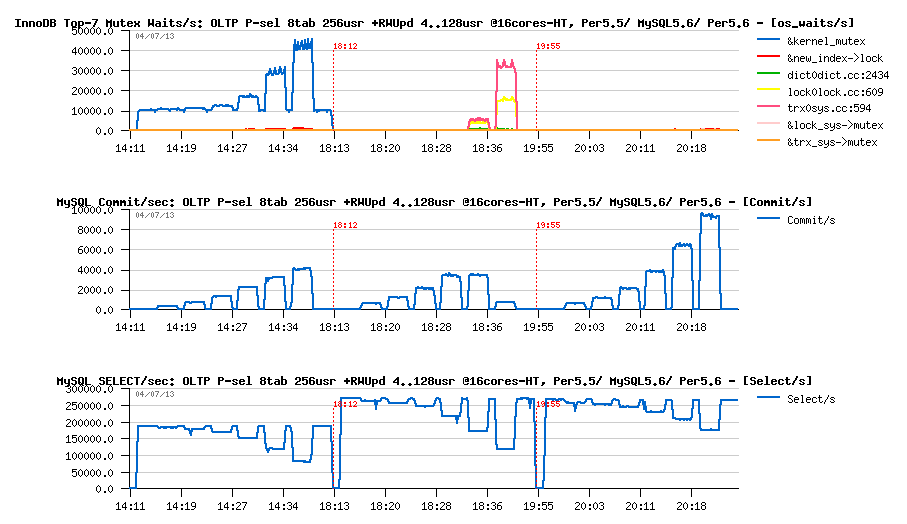
Observations :
- I'd say "no comments" :-))
- lowered trx_sys mutex contention giving a way better performance here on Percona-5.6
INSTEAD OF SUMMARY
- So far, to "fix" MySQL-5.6 I think we have here two options: backport related to trx_sys mutex (and other) contentions improvements from 5.7, or simply apply a proposed by Percona patch.. (interesting that a very similar "fix" implementation was already tested by InnoDB Team in the past, but was rejected as not giving a complete solution to the problem)..
- For sure, a true fix for all these issues will come with MySQL 5.7..
- But probably as a "short term" the fix used here by Percona will be just "good enough" for MySQL 5.6 right now?..
Well, to get a full picture about the story you'll need to wait until the latest MySQL 5.7 code will become public (and believe me, there is already something to see, and compared to all presented here results as well ;-))
Rgds,
-Dimitri