« dim_STAT | Main | MySQL »
Saturday, 30 December, 2017
dim_STAT v.9.0 CoreUpdate-17-12 is here !
Year is finishing, and as a kind of "end-of-year" gift, I'm happy to
announce that a freshy new CoreUpdate-17-12 is available from now
! ;-))
IMPORTANT : this is a very "sensible" update, and you
cannot just to apply it on the top of already deployed dim_STAT instance
as before.. -- there was a need to fix several issues within "under
hood" binaries to make the new stuff working properly, so the new code
has simply no chances to work with old binaries.. So far, I decided to
make it all as a "single shot move" -- align a new update shipment with
a moving to "64bit" versions support only :
- e.g. this is not a new version of dim_STAT
- this is just a "remastered" 64bit release + several visible and internal fixes
- any 32bit releases are remained "as it", and it makes no more sense to continue to support them..
- 64bit versions of dim_STAT v.9.0 are available for Linux and MacOSX (macOS)
- any further CoreUpdate will work only with 64bit version having the latest supported binaries..
So, what about this "new stuff" requiring such deep changes to go till the binaries remastering ?.. -- a very long story short, this is all about support of SVG images ! ;-)) -- I've started to develop dim_STAT exactly 20 years (!!) ago.. (hard to believe time is flying so fast..) -- initially dim_STAT used Java Applets (it was very lightweight (yes! it was so 20 years ago ;-)) and it was really cool, "live", etc.) -- but then Java support in a browser became only heavier and heavier, so I've added PNG images support (which could bring back the initial lightweight to dim_STAT and make it "usable" again ;-)) -- and today, things are changing again ;-)) -- "retina" and other "high resolution" screens become more an more popular, and on these screens my previously "good enough" PNG graphs are looking just "ugly" (to be polite ;-)). After testing and analyzing tons of various JS-based (or other) live graphing tools/libs, I've finally stopped my choice on SVG ! -- it's already supported by most of web browsers, still lightweight, and has a huge advantage -- it's extremely well "readable" !! and you can scale (!!) it very easily as much as you want ;-)) (so, no more color confusions and simply ugly graphics ;-))
An SVG graph is looking like this :

well, this is just a snapshot, but hope you already can get an idea about how much "more clean" your graphs could be ;-))
NOTE : some web browsers (for ex. FireFox) may require to not be limited in the "smallest" font size to draw SVG images correctly (as the text you see on your graphs is reproduced by your browser itself).
Now, few words about how SVG is integrated in dim_STAT :
- you have a new option for Graph image now : SVG (default)
- and in fact at any time you're selecting SVG or PNG -- your graph is generated in both formats on the same time
- however, the same image "size" may look differently in PNG vs SVG..
- for this reason there is an additional option : SVG Scale (which is x1.0 by default, but you may change it as you like)
- and most of dim_STAT "modules" are considering SVG option since now ;-))
So far, what is new in CoreUpdate-17-12 :
- SVG support !
- mandatory : remastered dim_STAT v.9.0 64bit version
- always generating PNG & SVG together
- SVG Scale option (web interface)
- default SVG Scale=1.0
- Snapshots :
- always containing PNG & SVG
- editing :
- allow image reordering by mouse dragging
- use SVG or PNG images according to what was recently used..
- redesigned Snapshots list :
- select criteria : Title pattern, order by time / title
- show all || first / last [N]
- option : show first N SVG/PNG images..
- option : show notes..
- click on title link involves snapshot editing
- redesigned Published Snapshots :
- have now also PNG and SVG document versions (HTML)
- HTML documents are now composed from first 2 images of each Snapshot + its notes, then <<More>> link is pointing on a full Snapshot page..
- PDF documents format remains the same (single document starting with a list of links to all included Snapshots)..
- Multi-Line stats :
- "CacheList" feature to speed-up names look-ups ! (generated once, then only re-used, can be re-generated again at any time on demand)
- allow bigger varchar limits for Add-On "name" collumn : 8/ 16/ 24/ 32/ 48/ 64/ 80/ 96/ 128
- Report Tool :
- you can now add Published Snapshots to your reports !
- code remastering / cleanup
- better / more accurate formatting
- remove external / java editors
- minor bug fixes..
- Bookmarks :
- Duplicate existing Preset
- Edit Preset (via checkbox list + reorder)
-
code remastering..
- STAT-service :
- STAT-service script now saves PID on start
- new commands: status, restart
- status : check if process with saved PID is running
- stop : call x.killSTAT with saved PID
- x.killSTAT : remaster to use CMD or PID
- restart : calls itself with stop, then start
- respecting chkconfig standard
- respecting LSB standard
- to setup under systemd :
- # ln -s /apps/STATsrv/STAT-service /etc/init.d
- # systemctl enable STAT-service
- # service STAT-service start
- # service STAT-service status
- # /apps/STATsrv/STAT-service status
- involving ALARM signal : ejecting on x10 Timeout non-activity period in all MySQL/ PG/ ORA scripts !!!
- => this could be very important in case when your monitored database engine becomes "frozen", but still continue to accept new connections..
- so dim_STAT will not see any stats coming from your database and suppose the connection was lost..
- and dim_STAT will then start a new stat command..
- which may still connect to your database, but not go any further, as database is frozen..
- and this may continue endless in loop every time once "connection timeout" is expired..
- and your server will get tons of stat commands started on its side and trying to collect some stats from your frozen database engine..
- so, to avoid this, each stat command is now having its own "non-activity alarm" -- if within x10 times Timeout period there was nothing collected from a given database, the stat command will self-eject by alarm event ;-))
- innodbMUTEX : advanced aggregation with tot@ / max@ / avg@ wait stats !
- Linux netLOAD_v2 : reports also MB/sec + fixed counters overflow
- Linux mysqlSTACK / ProcSTACK (based on quickstack from Yoshi (@FB))
- Linux mysqlCPU / ProcCPU (based on tiptop, not compatible with "perf", use with caution)
- Linux PerfCPUSTAT (based on "perf", reports CPU HW counters)
- Linux PerfSTAT_v2 (improved PerfSTAT)
- extended with Cycles/s numbers !!
- new option : -Event ... (ex: -Event cycles:u)
- EasySTAT :
- extended on Linux with : mysqlSTACK, mysqlCPU, netLOAD_v2, PerfCPUSTAT, PerfSTAT_v2
- now also auto-generating start/end log messages (to simplify post-analyze)
-
LoadDATA.sh is allowing now to pass args from command line (path
to BatchLOAD and DB name)
- General :
- Analyze Top-N values : choice => MIN/ MAX/ AVG/ 95% !
- export data in CSV format via Analyze page & dim_STAT-CLI
- tag LOG Messages with different colors according text pattern !
- on stat names checkbox => popup with note description (when available)
- improved auto-scaling Y-axe values according image size !
- improved default HTML style, re-look, etc.
- New Add-Ons & their Bookmarks :
- mysqlSTACK
- mysqlCPU
- ProcSTACK
- ProcCPU
- netLOAD_v2
- PerfCPUSTAT
- PerfSTAT_v2
- ...
- minor bug fixes..
Hope you'll enjoy all this new stuff as I'm already doing ;-))
For those who already using dim_STAT and want to preserve their collected data -- here are few simple steps to make the migration to the latest 64bit version smooth :
- first of all - no matter if you used 32bit version before, or 64bit (or SPARC, etc.), instructions are exactly the same
- however, even the version remains the same, we're moving to new remastered binaries..
- so the whole process is looking as "migration" (rather a simple CoreUpdate apply)
- (and if your data are critical, better to try you migration steps on another host first ;-))
- so far, let's suppose you already deployed dim_STAT into "/apps" on your host1
- 1) stop dim_STAT : # /apps/ADMIN/dim_STAT-Server stop
- 2) backup your whole (!!) database directory : /apps/mysql/data
- 3) if you created any Reports or Snapshots, then backup also the whole web server docs directory : /apps/httpd/home/docs
- 4) now on host2 install the latest 64bit dim_STAT version (supposing it'll be re-installed to the same default "/apps" path)
- 5) restore your "docs" backup into "/apps/httpd/home/docs" on host2
- 6) from your databases backup restore all to "/apps/mysql/data" on host2 except the following directories :
- /apps/mysql/data/mysql
- /apps/mysql/data/performance_schema
- /apps/mysql/data/dim_00
- 7) start dim_STAT on host2 : # /apps/ADMIN/dim_STAT-Server start
- 8) connect to your newly installed dim_STAT on host2 and check you can find all your previously collected data and created documents / snapshots..
- 9) if something is going odd.. -- then ping me back, let's see what is going wrong ;-))
- 10) if all is fine, then test if for a while, and once everything is really ok, then you're comfortable to migrate your host1 too ;-)) (and don't hesitate to ping me with good news too ;-))
Crossing fingers.. -- hope all will go just fine for you ;-))
And for the end.. -- there is yet "one more thing"..
This "one more thing" was inspired by observing many dim_STAT users doing some completely "unexpected things" (unexpected in my mind, but looking very "natural" for those who are doing) -- honestly, I'm really surprised by all use cases I've seen over past years (even users generating graphs via CLI commands involved from app servers and then grouping them into various documents, charts, etc.) -- but the most painful for me was to see users trying to involve "web oriented" actions in dim_STAT via curl, wget, etc.. -- this could bring to something wrong as there could be tons of options used within each POST/GET order, and all expected calls could be just broken after further CoreUpdates..
And to make your life more simple for such use cases, let me present you the REST-like Interface available since CoreUpdate-17-12 ! ;-))
dim_STAT-REST interface is supporting the following commands right now :
- DB_LIST -- list all available databases
- DB_CREATE -- create a new database
- HOST_LIST -- print current host list in database
- HOST_ADD -- add new hostname into host list in database
- HOST_STATS -- request the list of available STATS from host STAT-service
- COLLECT_LIST -- list all available STAT collects in database
- COLLECT_NEW -- create and start a New Collect in database
- COLLECT_STOP -- stop Active Collect(s) in database
- COLLECT_RESTART -- restart Stopped Collect(s) in database
- LOG_MESSAGE -- add a LOG Message to database
the output of each command is going in simple "pre-formatted" ASCII text, easy to parse and check.
Here is an example of "COLLECT_LIST" output :
==========================================================================================
 dim_STAT-REST (dim) v.1.0
==========================================================================================
 > CMD: COLLECT_LIST
  ----------------------------------------------------------------------------------------
      1 | goldgate     | -OFF- | 1998-12-18 16:28:27 |  15 sec. | Demo 1
      6 | test         | -OFF- | 2002-10-20 23:37:01 |  15 sec. | test
      7 | bezout       | -OFF- | 2003-06-26 13:46:51 |  30 sec. | test err
      9 | fidji        | -OFF- | 2003-09-17 13:23:12 |  10 sec. | test MPXIO + nocanput
     12 | test         | -OFF- | 2003-10-06 17:15:43 |  20 sec. | test MTB bug
     15 | localhost    | -OFF- | 2004-09-26 21:48:49 |  20 sec. | test
     16 | localhost    | -OFF- | 2004-09-26 21:51:59 |  20 sec. | test
     17 | gauss        | -OFF- | 2004-10-01 12:29:37 |  20 sec. | test RESTART
     18 | neel         | -OFF- | 2004-10-01 12:30:00 |  20 sec. | test RESTART
     19 | monod        | -OFF- | 2004-10-01 12:33:52 |  20 sec. | test RESTART
     20 | monod        | -OFF- | 2004-10-01 20:36:37 |  20 sec. | test RESTART
     21 | localhost    | -OFF- | 2004-10-12 20:30:51 |  15 sec. | test statOEE
     22 | dimitri      | -OFF- | 2007-01-21 21:06:43 |   5 sec. | test IObench
     23 | dimitri      | -OFF- | 2009-06-15 16:36:49 |  10 sec. | System Load...
  ----------------------------------------------------------------------------------------

 > OK
==========================================================================================
but I think more simple is to discover this all by yourself -- right now, try to execute the following command from your shell to test dim_STAT installed on your host2 (port 80) :
$ curl -L "http://host2:80/cgi-bin/WebX.mySQL/dim_STAT/x.REST"
this will print you the following help message :
==========================================================================================
 dim_STAT-REST (dim) v.1.0
==========================================================================================
 > Usage: curl -L "http://host2:80/cgi-bin/WebX.mySQL/dim_STAT/x.REST?CMD=Command[&..options..]"

    CMD=DB_LIST                    -- list all available databases

    CMD=DB_CREATE                  -- create a new database "Name"
      &DB=Name                        -- db name
      &Engine=InnoDB|MyISAM           -- db engine (InnoDB or MyISAM)
      &Passwd=password                -- optional password to protect admin actions

    CMD=HOST_LIST                  -- print current host list in database "Name"
      &DB=Name                        -- db name

    CMD=HOST_ADD                   -- add new hostname into host list in database "Name"
      &Host=hostname                  -- new hostname (format: [alias/]hostname[:Port])
      &DB=Name                        -- db name
      &RESET=1                        -- optionally: reset hostlist to empty

    CMD=HOST_STATS                 -- request the list of available STATS from host STAT-service
      &Host=hostname                  -- alias OR hostname (format: [alias/]hostname[:Port])
      &DB=Name                        -- db name

    CMD=COLLECT_LIST               -- list all available STAT collects in database "Name"
      &DB=Name                        -- db name

    CMD=LOG_MESSAGE                -- add a LOG Message to database "Name"
      &DB=Name                        -- db name
      &Message=text                   -- text message
      [&Host=hostname]                -- hostname (multiple Host args can be used)
      [&ID=id]                        -- Collect ID (multiple ID args can be used)
                                      * Host and ID are optional :
                                        > if ID is given : use provided ID(s) only
                                        > if no ID nor Host : add the message to all active collects
                                        > if only Host : add the message to active collects matching hostname(s)

    CMD=COLLECT_NEW                -- create and start a New Collect in database "Name"
      &DB=Name                        -- db name
      &Host=hostname                  -- hostname (only one Host can be user at time)
      &Timeout=Nsec                   -- STATs timeout in seconds
      &Title=title                    -- Collect title
      &STATS=list                     -- list of STATs to collect: stat1[,stat2[,stat3]...] or "all"
                                         all: means all STATs available from Host STAT-service
      [&LOG=filename]                 -- full filename of LOG file to watch
      [&Message=text]                 -- text message to log Collect start

    CMD=COLLECT_STOP               -- stop Active Collect(s) in database "Name"
      &DB=Name                        -- db name
      [&Message=text]                 -- text message to log on Collect(s) stop
      [&Host=hostname]                -- hostname (multiple Host args can be used)
      [&ID=id]                        -- Collect ID (multiple ID args can be used)
                                      * Host and ID are optional :
                                        > if ID is given : use provided ID(s) only
                                        > if no ID nor Host : stop all active collects
                                        > if only Host : stop active collects matching hostname(s)

    CMD=COLLECT_RESTART            -- restart Stopped Collect(s) in database "Name"
      &DB=Name                        -- db name
      [&Message=text]                 -- text message to log on Collect(s) restart
      [&Host=hostname]                -- hostname (multiple Host args can be used)
      [&ID=id]                        -- Collect ID (multiple ID args can be used)
                                      * Host and ID are optional :
                                        > if ID is given : use provided ID(s) only
                                        > if no ID nor Host : restart all recently stopped collects
                                        > if only Host : restart recently stopped collects matching hostname(s)

    ...
==========================================================================================

## ERROR:
=> CMD is not filled !!

==========================================================================================
while you can see there many options listed, there are many actions are simplified "by default" -- and to explain this, let me show you a simple use case of the whole workflow by example :
- you're starting a testing with say "Customer 1234"
- so, first you creating a dedicated database CU_1234_YourName
- (adding your name to dbname to be sure the name is unique ;-))
- then you adding to this database the hosts you're wanting to use (say: host_N1, host_N2, host_N3)
- (note: this also can be the same HW server, but running several STAT-services (each one for different db instance, etc.)
- once you're ready, you're :
- starting New Collect for host_N1
- starting New Collect for host_N2
- starting New Collect for host_N3
- NOTE: instead of building the list of stats you want to collect from your hosts, you can use "STATS=all" option, which will collect everything -- this could be dangerous (sometimes too much is too much ;-)) -- but you can easily limited "everything" to "just what you need" by editing the STAT-service "access" file (and leave uncommented there only the stats you'll really need) -- so, again, you can keep your own "pre-configured" STAT-service tarball, deploy & start it on your host(s) before any testings, and then in your scripts always use just "STATS=all" (regardless which system you're using and delegate it to your pre-defined STAT-service config ;-))
- after what, you can run your first test workload..
- your test script may contain in any place a command to send a Log Message
- NOTE: without mentioning any ID in the command, the Message will be automatically added to all currently active Collects !
- (so, in your scripts you even don't need to worry which exactly hosts are used, etc. -- all you need to know is the URL of your dim_STAT server and the dbname you're using ;-))
- supposing you got your first results, and now need a feedback from Customer/Dev about, so no more tests for the moment.. -- then you just involve COLLECT_STOP for your database
- NOTE: without any ID provided the command will stop all active collects within your database (so, no need to worry you forgot anyone ;-))
- then, few days later, you have more info, and need to run other tests within the same conditions and on the same hosts..
- so, all you need to do is just to involve COLLECT_RESTART command, and again, without any ID and by only giving DBNAME the tool will restart the latest most recent existing collects ;-))
- and in case you need to run some tests only on say "host_N2" => you then just giving "DB=CU_1234_YourName&Host=host_N2" and the tool will automatically find the most recently created Collect corresponding to "host_N2" and restart it !
- same, your test script continues to send Log Messages, and if the only host_N2 Collect is active during this time => then only host_N2 Collect will log them, and not other Collects ;-))
- and then again, but involving COLLECT_STOP with no ID, it'll stop all your running collects, no need to worry to miss any one of them ;-))
Well, don't hesitate to ping me if you need any more details !
That's all for the moment. As usual, all the stuff above is available for free download from my site :
- http://dimitrik.free.fr
Rgds,
-Dimitri
Tuesday, 12 February, 2013
MySQL Performance: MySQL 5.6 GA -vs- MySQL 5.5 tuning details
This post is the next part following the initial article about MySQL 5.6 vs 5.5 benchmark results (and MySQL 5.6 scalability).
The focus in this article is on the "tuning impact" used during the published tests, and also I have for you few more test results to present which were missed initially -- Sysbench tests using 8 tables instead of a single one (as it does by default).
All my.conf setting I've used during the tests was already presented within an initial article, so let's go directly to details about special tuning setting. While many parameters are pretty important (like use or not use O_DIRECT, choose a right REDO log and Buffer Pool size, flush or not flush neighbor pages, right I/O capacity, etc.) -- but all these ones less or more predictable, and once chosen right, not giving you many troubles (unless something did not change in your workload or data volume). But there are two of them which are directly related to internal InnoDB contentions and should be very well tested before applied:
Adaptive Index Hashing (AHI, innodb_adaptive_hash_index, default=1) is helping a lot and in many cases, but sometimes supporting very badly concurrent access or concurrent changes which is expressed by growing contention on the "btr_search_latch" rw-lock. Such a contention may happen not only on a mixed Read-Write (RW) activity, but on a Read-Only (RO) as well. And there is no general rule, and the only real test may give you a real answer (while "generally" you may expect a higher contention on a RW workload rather on a RO)..
Spin Wait Delay (SD, innodb_spin_wait_delay, default=6) value is
used on spin wait loops of mutexes and rw-locks in InnoDB. The setting
is giving the "max" value for the random wait delay interval chosen on
spin wait (expecting a mutex or rw-lock will be free soon, InnoDB is
"spinning" (looping) on CPU involving "pause" instructions and trying to
acquire the lock in the next loop). In fact this solution is "hiding"
contention rather solving it, and may use CPU time a lot just for
"spinning" (while we can do some other and more useful work) -- but in
any case it gives you an expected benefit, and InnoDB locking is going
really faster, and usually you're finally obtaining a better performance
within your workload.. However, again, there is no "silver bullet", and
the "right" value cannot be suggested generally, and that's why in MySQL
5.6 the default value remaining the same as in 5.5, while a bigger one
can be more appropriate, but the result may still vary depending on your
workload, CPU number, and CPU frequency on your server, and so on. At
least the variable is dynamic and you can test it live on your workload
(as I've made in RO testing, looking
for the most optimal value).. I know that on my server this value
may vary from 6 (default) to 128, and give a pretty interesting
performance impact! For MySQL 5.6 tuning os this setting is simply a
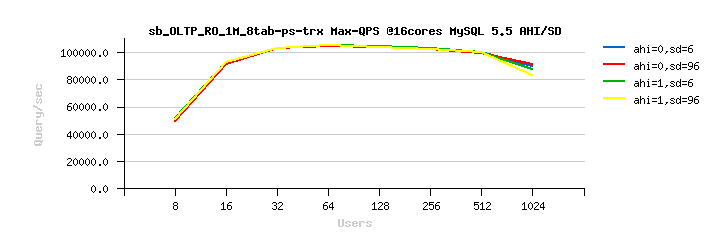
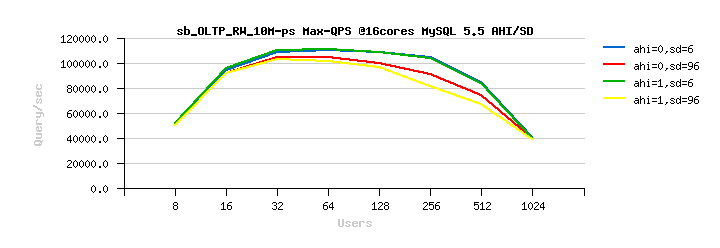
must, and you'll see how on one of the presented tests performance is
dropping already on 64 concurrent user sessions (when default setting is
used (sd=6)), while with a more appropriated one (sd=96) performance
remains much more stable and much more higher!..
So far :
- the following graphs are representing test results obtaining with variations: AHI= 1 or 0, SD= 6 or 96
- in fact there are 4 combinations, and each one is named like "ahi=n,sd=m", where n is 1 or 0, and m is 6 or 96
- on configurations with few CPU cores having a smaller SD value seems to be better in most of cases, while with more CPU cores a higher SD value is preferable (while there is may be some exceptions as well)
- so, don't hesitate to test and you'll get the right answer for your workload
Then, for every test case the following graphs are presented :
- Best-to-best TPS/QPS performance : there are both, TPS and QPS graphs, so you're able to see a ratio between transactions and queries/sec -- personally I prefer to see queries/sec performance, as it speaks much better (reaching near 300K QPS with all SQL and MySQL layers overhead is telling more than 20K TPS, except if you're aware about what exactly your transactions are doing)..
-
And then impact of SD and AHI pair within each CPU cores configuration:
- Tuning impact @16cores
- Tuning impact @32cores
- Tuning impact @32cores with HT-enabled
Hope I did not forget anything. Here are the results:
Sysbench OLTP_RO
Best-to-best TPS/QPS performance:


Tuning impact @16cores:


Tuning impact @32cores:


Tuning impact @32cores with HT-enabled:


Sysbench OLTP_RO 8-tables
Best-to-best TPS/QPS performance:


Tuning impact @16cores:


Tuning impact @32cores:


Tuning impact @32cores with HT-enabled:


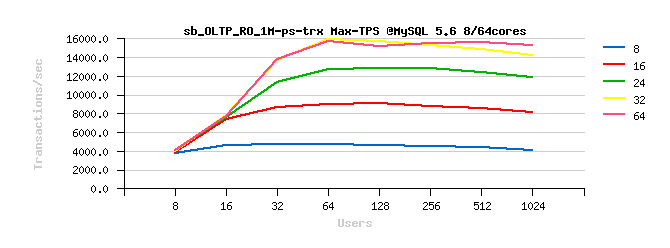
Sysbench OLTP_RO-trx
Best-to-best TPS/QPS performance:


Tuning impact @16cores:


Tuning impact @32cores:


Tuning impact @32cores with HT-enabled:


Sysbench OLTP_RO-trx 8-tables
Best-to-best TPS/QPS performance:


Tuning impact @16cores:

Tuning impact @32cores:


Tuning impact @32cores with HT-enabled:


Sysbench OLTP_RO Point-Selects
Best-to-best TPS/QPS performance:


Tuning impact @16cores:


Tuning impact @32cores:


Tuning impact @32cores with HT-enabled:


Sysbench OLTP_RO Point-Selects 8-tables
Best-to-best TPS/QPS performance:

Tuning impact @16cores:


Tuning impact @32cores:


Tuning impact @32cores with HT-enabled:


Sysbench OLTP_RO Simple-Ranges
Best-to-best TPS/QPS performance:

Tuning impact @16cores:


Tuning impact @32cores:


Tuning impact @32cores with HT-enabled:


Sysbench OLTP_RW 10M
Best-to-best TPS/QPS performance:


Tuning impact @16cores:

Tuning impact @32cores:


Tuning impact @32cores with HT-enabled:


Sysbench OLTP_RW 10M 8-tables
Best-to-best TPS/QPS performance:


Tuning impact @16cores:


Tuning impact @32cores:


Tuning impact @32cores with HT-enabled:


SUMMARY :
- as you can see, Spin Wait Delay is playing a very critical role for performance on your workload..
- as well enabling or disabling AHI may bring some unexpected regression, select it right..
- using or not using Hyper Threading (HT) for MySQL server is very depending on a workload too..
- so, the main rule is: keep in mind all these settings and tune your MySQL 5.6 server to the best! ;-)
- more to come..
to be continued..
Rgds,
-Dimitri
Monday, 11 February, 2013
MySQL Performance: MySQL 5.6 GA and MySQL 5.5 scalability
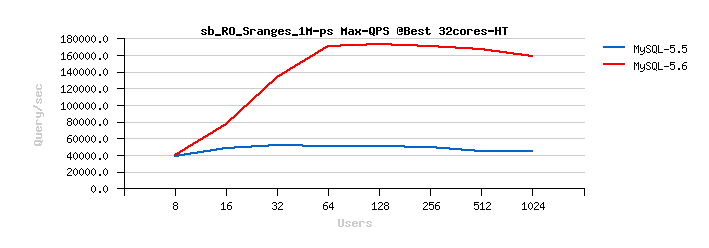
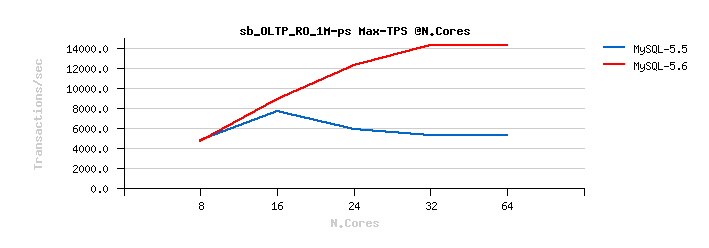
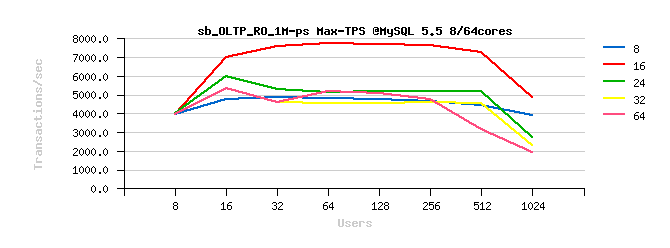
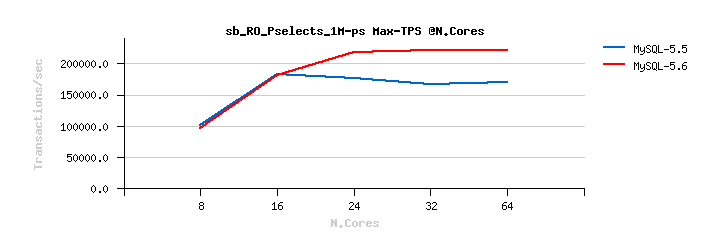
As promised, this is the first part of details about MySQL 5.6 vs 5.5 benchmark results I've published earlier last week. The following graphs are representing scalability results obtained for both MySQL versions on the published tests (and I have yet more test results to present to you, but these test's are still running)..
Few remarks based on comments and discussions I've got since then:
- I'm using a "true" 32cores server (true 32 cores, each one yet has 2 threads (HT), so 64 threads in total)
- I'm not using "CPU threads" terminology as I'm finding it confusing (for ex. when you're reading "16 CPU threads" you may not really know if there were 16cores with HT-disabled, or 8cores with HT-enabled)..
- during all the tests I've disabled HT (as it took days and days more to test every case I'm interesting in)..
- also, in many tests on 5.5 until now I've observed a worse performance when HT is enabled.. (well, depends on a workload, and yes, there was an improvement made too over a time)
- MySQL 5.6 is running more often better when HT is enabled (but again, depends on a workload)
- so, to compare apples-to-apples and reduce my test cycles, HT was always disabled, except on the last one - "64cores" which you should read as "32cores with HT enabled" -- I've made an exception for this one just to see what is waiting us ahead after 32cores ;-)
- so for all tests when you're reading "N cores" it means exactly N physical CPU cores (HT disabled), except for 64cores = 32cores HT-enabled (which was just too long for graph legends)..
- also, during all the tests both MySQL servers are running with "jemalloc" library instead of default malloc, as it's the best malloc on Linux today and I'm using it during all my tests since probably more than 2 years now (but don't think to precise, as it's a part of my "default" config, so did not suppose that somebody is not using it when running MySQL Server on Linux.. - while I always have a dedicated slide in my MySQL Performance presentations ;-))
- for the same reasons the MySQL config parameters I've added in the previous article are not Sysbench specific or oriented -- it's just a "start kit" I'm using by default, and then adapt according a workload.. - and for Sysbench load such a config is more than ok ;-)
- if anything else I forgot to mention - please, just ask ;-)
And now the results.
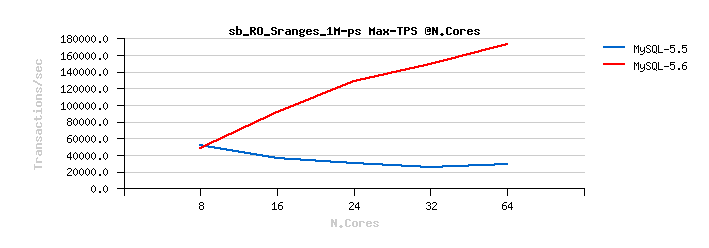
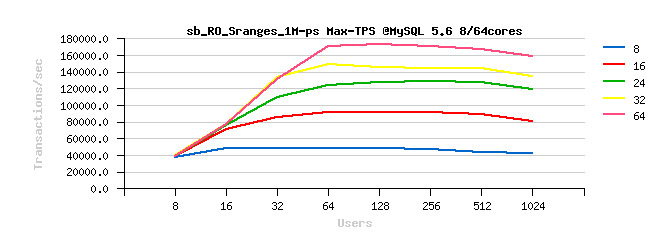
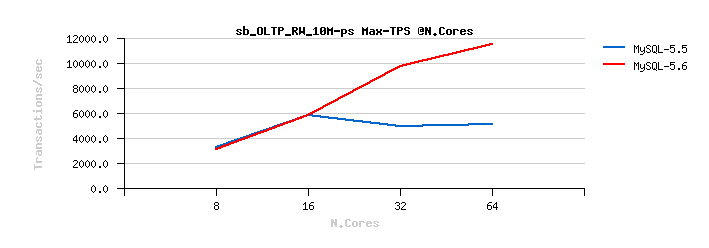
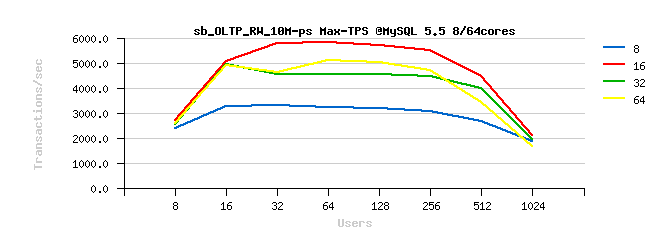
Don't think you'll need any comments.. Except maybe just this one:
- MySQL 5.5 was already scaling less or more well on small servers, up to 16cores..
- except that if you need more power and have more cores available on your host, there was no way to get better just by adding cores.. (but at least there was no dramatic regression anymore as we observed just few years before ;-))
- MySLQ 5.6 is going way further now, and able to show you a pretty visible performance improvement when more cores are available on your server!
- We know, we're not perfect yet.. - but a huge gap between MySQL 5.6 and 5.5 is already here! ;-)
- And it's not only about better performance with more CPU/cores, there are also a lot of new features + improved design in many many places (and if you've missed something, there are long and short lists available, as well a very good DBA & developer guide with many details)
- So, don't wait more, and start to use your servers with MySQL 5.6 on their full power right now!
Sysbench OLTP_RO :

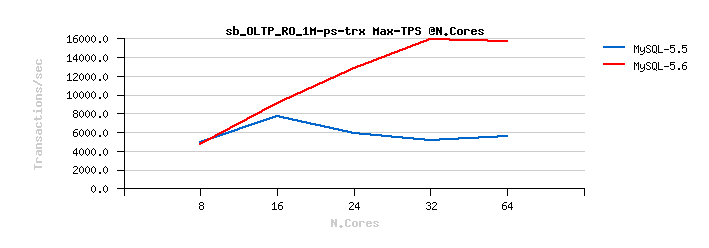
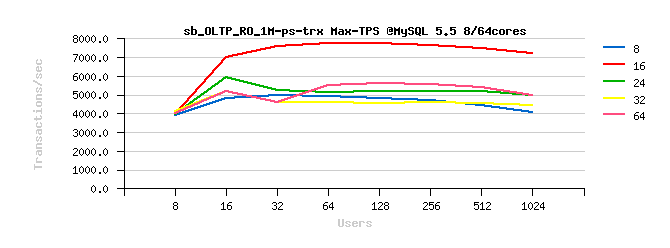
Sysbench OLTP_RO-trx :
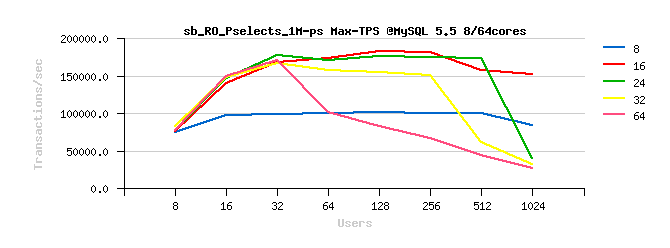
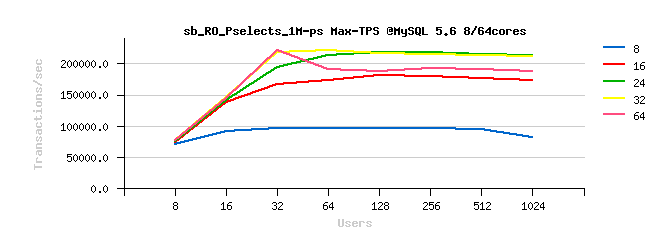
Sysbench OLTP_RO Point-Selects :
Sysbench OLTP_RO Simple-Ranges :

Sysbench OLTP_RW :
INSTEAD OF SUMMARY :
- open your TODO right now..
- and just write on top: Start upgrade to MySQL 5.6 ASAP !!! ;-)
to be continued..
Rgds,
-Dimitri
Monday, 28 January, 2013
MySQL Performance: InnoDB heavy I/O RW workloads limits in 5.6
This article was initially planned to follow the previous posts about RW
(Read+Write) workloads on MySQL & Linux (part#1,
part#2)...
But, when I've started to run real MySQL/InnoDB IO-bound tests on the
Fusion-io card, I've quickly realized that I'm hitting so hot internal
contentions within InnoDB code, that I'm simply unable to use storage
capacity on its full power.. So, I've moved to another server (having
SSD only), and then continued with it (as to explain RW limits it'll be
pretty enough). Also, curiously, on this server XFS performance on
writes is way better than EXT4 (while on the the previous server XFS got
some unexpected problems, seems to be known bugs)..
So far, for
the following tests I've used:
- Server : 32cores bi-thread (HT) Intel 2300Mhz, 128GB RAM
- OS : Oracle Linux 6.2
- FS : XFS mounted with "noatime,nodiratime,nobarrier,logbufs=8"
- MySQL : 5.6
- and as seen as the most optimal from the previous I/O testing, MySQL is using O_DIRECT and AIO for I/O operations (mainly write-oriented here)..
- adaptive hash index feature (AHI) is turned off (AHI lock contentions is a different issue, should be fixed in 5.7)
my.conf:
-------------------------------------------------------------------------
max_connections = 4000
key_buffer_size = 200M
low_priority_updates = 1
sort_buffer_size = 2097152
back_log = 1500
query_cache_type = 0
# files
innodb_file_per_table
innodb_log_file_size = 1024M
innodb_log_files_in_group = 3
innodb_open_files = 4000
table_open_cache = 8000
table_open_cache_instances = 16
# buffers
innodb_buffer_pool_size = 64000M
innodb_buffer_pool_instances = 32
innodb_log_buffer_size = 64M
join_buffer_size = 32K
sort_buffer_size = 32K
# tune
innodb_checksums = 0
innodb_doublewrite = 0
innodb_support_xa = 0
innodb_thread_concurrency = 0
innodb_flush_log_at_trx_commit = 2
innodb_flush_method = O_DIRECT
innodb_max_dirty_pages_pct = 50
innodb_use_native_aio =1
innodb_stats_persistent = 1
innodb_spin_wait_delay =96
# perf special
innodb_adaptive_flushing = 1
innodb_flush_neighbors = 0
innodb_read_io_threads = 16
innodb_write_io_threads = 4
innodb_io_capacity = 10000
innodb_purge_threads =1
innodb_adaptive_hash_index = 0
# Monitoring
innodb_monitor_enable = '%'
performance_schema = ON
performance_schema_instrument = '%=on'
-------------------------------------------------------------------------
An then, let's start from the beginning.. ;-))
What was wrong with MySQL/InnoDB on RO (Read-Only) workloads?..
- the main goal here is to bring data pages as fast as possible into the Buffer Pool (BP) to get them cached; and if BP is not big enough to keep the whole active data set -- then adding efficient BP management to remove the most unused pages first when reading the new ones..
- the positive thing here that reads in most cases are completely independent between user threads, so all the I/O related activity will most likely depend only of your storage speed..
- except if you're not hitting any InnoDB internal contentions ;-)
- the main one in the past was "BP mutex" contention (InnoDB, fixed in 5.5 by introducing BP instances)
- then "kernel_mutex" (InnoDB, removed in 5.6)
- then "trx_sys" (InnoDB, in 5.6 decreased by introducing of READ-ONLY transactions + lowered by increasing "innodb_spin_wait_delay", real fix is planned for 5.7)
- then MDL related locks (MySQL server, partially fixed in 5.6, real fix is planned for 5.7)
- however, even having all these contentions, it's still possible to keep performance level stable up to 1024 concurrent users sessions and more (see these posts for details) and without involving any throttling (like InnoDB thread concurrency) or special thread management like (Thread Pool extension)..
While, thinking well, the use of the Thread Pool is simply the must for any system having a big number of active user sessions -- OS scheduler will simply unable to manage them right (it has no idea who is doing what, who is locking what, who is waiting for what, and so on.. -- most of these things are internal to the MySQL/InnoDB code and not really visible to OS). Then, usually once your number of active threads out-passing x3 time the number of available CPU cores on your server, your CPU time will be very likely spent more and more to simply manage them (OS scheduling), rather to get a real work done.. As well, don't forget that N cores are able to run on the same time only N threads, and not more ;-) So, Thread Pool is really helping here and let you use your server HW more optimally..
Well, and what about RW workloads now?..
- MySQL 5.6 brings many improvement to get thing working right (improved Adaptive Flushing, Page Cleaner thread, Multiple Purge Threads, over 4GB REDO logs, etc.)
- but as you're constantly writing, you're very I/O dependent on RW workloads..
- with increasing number of concurrent users your I/O activity will be increased yet more faster (more REDO log records, more dirty pages flushing, more purge activity, etc.)..
- and combined with the increased internal concurrency contentions in the code, you may be even unable to involve the same amount of I/O write requests as on a lower load..
- Thread Pool may sill help here to keep contentions level constant..
- but things are changing A LOT not even with increased number of concurrent users, but with increased size of your database! - and here only a proper fix will help.. -- means we have many challenges for performance improvement in MySQL 5.7 ;-))
Let's start with a simple case first..
Test details:
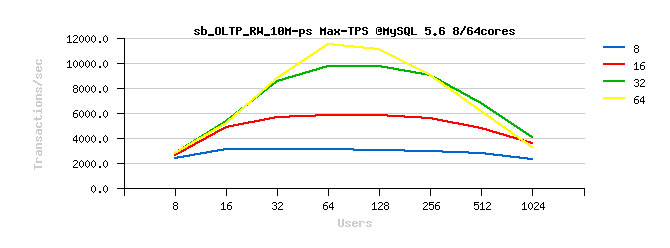
- Sysbench OLTP_RW (default, single table), 10M records, InnoDB engine
- workload is growing from 8, 16, 32 .. 1024 concurrent users
- innodb_thread_concurrency = 0 / 64 (just to see if it still helps)
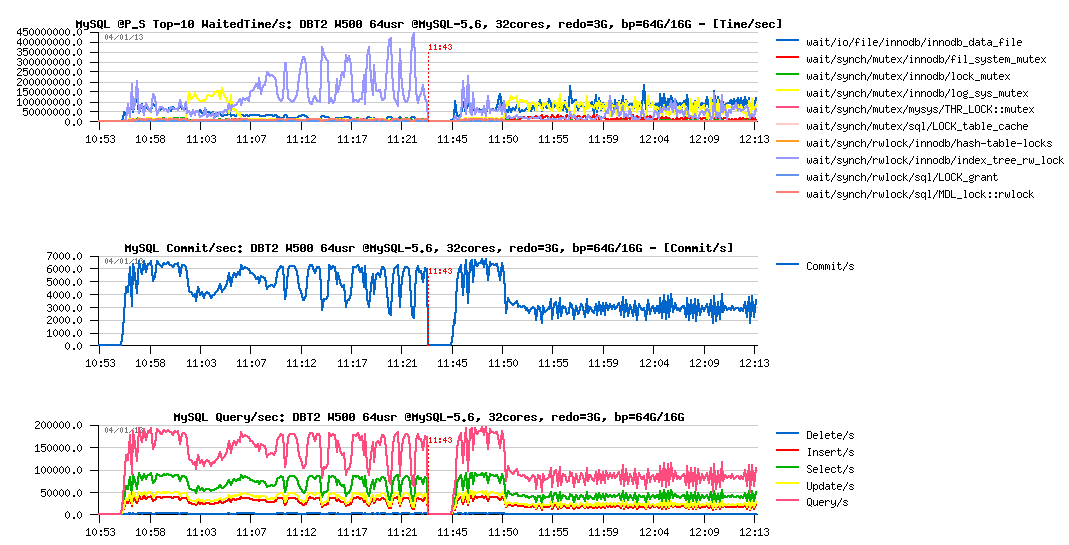
OLTP_RW 10M, concurrency = 0 / 64 :
Observations :
- left part of the graph is corresponding to the same test using innodb_thread_concurrency=0, and the right one = 64
- main bottlenecks here are on InnoDB "index lock" and "lock mutex"
- using InnoDB thread concurrency is still helping here! (result on 1024 users is near twice better)
- but index lock seems to be the most hot, so it lets expect that using partitioned table, or simple several tables should decrease this contention a lot..
Let's see:
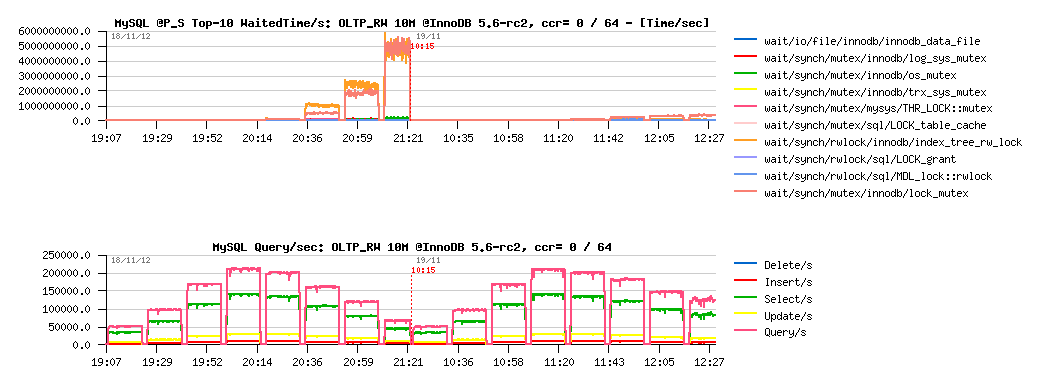
Test details:
- Sysbench OLTP_RW, 8 tables 1M records each, InnoDB engine
- workload is growing from 8, 16, 32 .. 1024 concurrent users
- innodb_thread_concurrency = 0 / 64
OLTP_RW 8-tables x 1M, ccr= 0 / 64 :
Observations :
- main contention is on the "lock mutex" only now, and as the result max QPS level is much higher too! (255K vs 210K QPS)
- but InnoDB thread concurrency is helping only on 1024 concurrent users load now.. interesting..
- and what exactly contention is blocking performance on 250K QPS?..
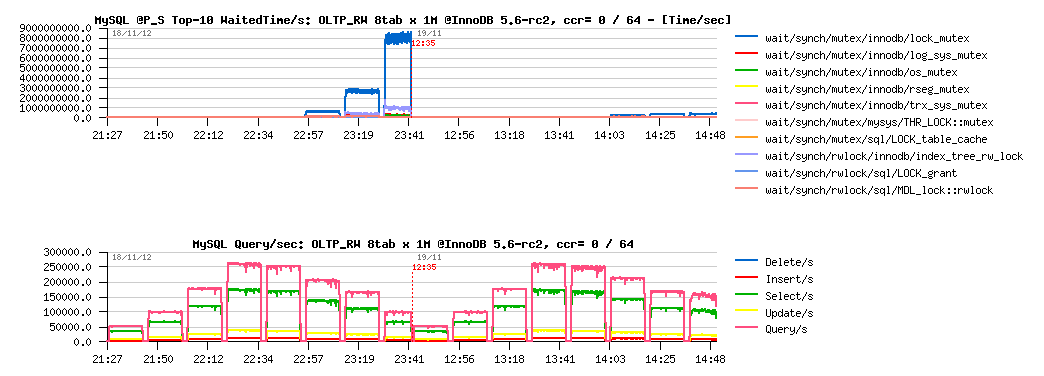
What is blocking us on 250K QPS ?..
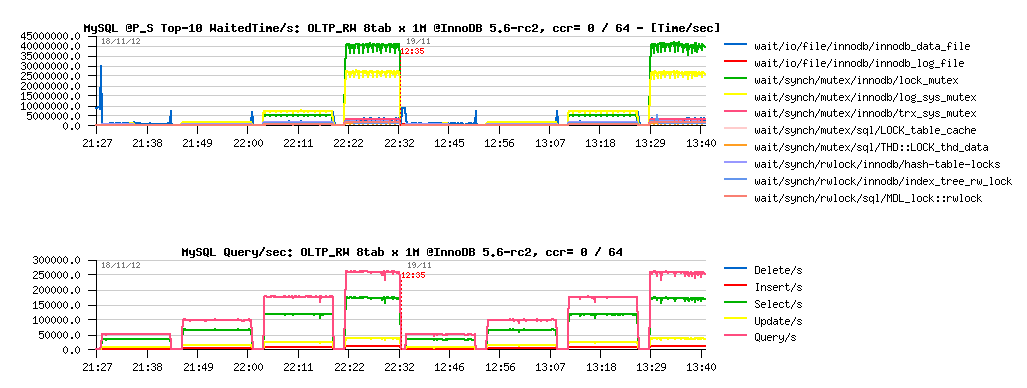
Observations :
- main contentions are on the "lock mutex" and "log sys mutex"
- lock mutex contention is dominating..
- and the question is: why log mutex is getting a contention?.. - specially how high it's jumping from 32 to 64 users level..
- gives impression to be blocked by IO speed on REDO log writes.. - but my SSDs are yet far to be even fully busy% on that moment, so the problem is not really related to I/O... and well, it's not yet the main contention here, so..
Well, let's keep the 64 users workload as the "peak level", and focus on it while analyzing more heavy loads ;-))
Now: What will be changed if instead of 10M, I'll run the same load on the 100M database size?.. 200M? more?..
- first of all the volume (of course ;-)) -- and if your workload data set will no more feet the BP size, there will be more and more data reads involved, and finally the whole database activity may become I/O bound, and we'll no more test the MySQL performance, but the storage..
-
but supposing we have enough RAM and workload data set may still
remain cached and SQL queries are not depending on the volume (we're
still operating with the same amount of rows in read and write
operations within every query).. -- what will be changed then?
- reads related response time should remain the same (of course index trees will be much more bigger, need more operations in access, but as most of the data remaining cached (as we supposed) it should still go on the same or near the same speed)..
- while if your access pattern is completely random, writes will become much more wider and will touch much more different data pages!
- the query/sec (QPS) level may pretty remain the same, and as the results, the REDO logs writes speed too..
- however, to follow these REDO log writes will become more harder now, because if on a small data volume there is a lot of chances that by flushing one dirty page you'll match several REDO records corresponding to this page, while on a bigger volume - there is more and more chances that more pages should be flushed to cover the same amount of REDO records..
- to summarize: with a growing volume your dirty pages flushing activity will grow too!.. - which will demand to revisit your storage performance hosting data (while REDO writes will remain the same)..
- And the question then: Will be MySQL/InnoDB able to follow your storage capacity?..
Let's continue with "standard" Sysbench OLTP_RW test, but use now 100M and 200M data volumes.
My main interest is focused around the following test conditions:
- Read+Write workload with 64 concurrent users (user threads)
- InnoDB Buffer Pool: 64GB vs 16GB (to see the impact in each test case when the dataset is not fitting the BP size)
- InnoDB REDO log total size: 8GB vs 3GB (to see the impact between less and more aggressive flushing conditions)
As usually, MySQL Performance Schema (PFS) will help here to analyze wait events + I/O waits too.
So, on OLTP_RW 10M it was enough to flush 1500-2000 pages/sec to keep the 200K QPS level. What will change on the 100M and 200M volumes within "good conditions" (BP=64GB and REDO=8GB):
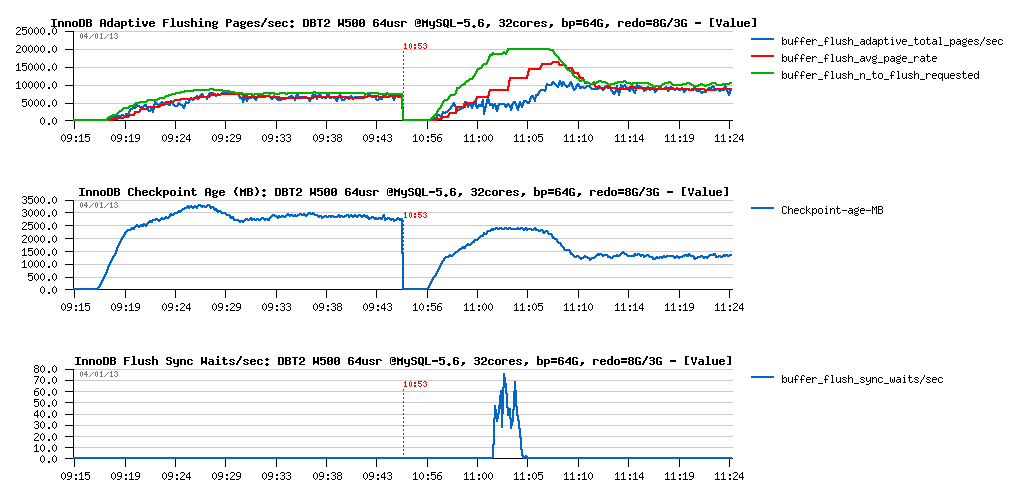
OLTP_RW 100M vs 200M, bp=64G, redo=8G :
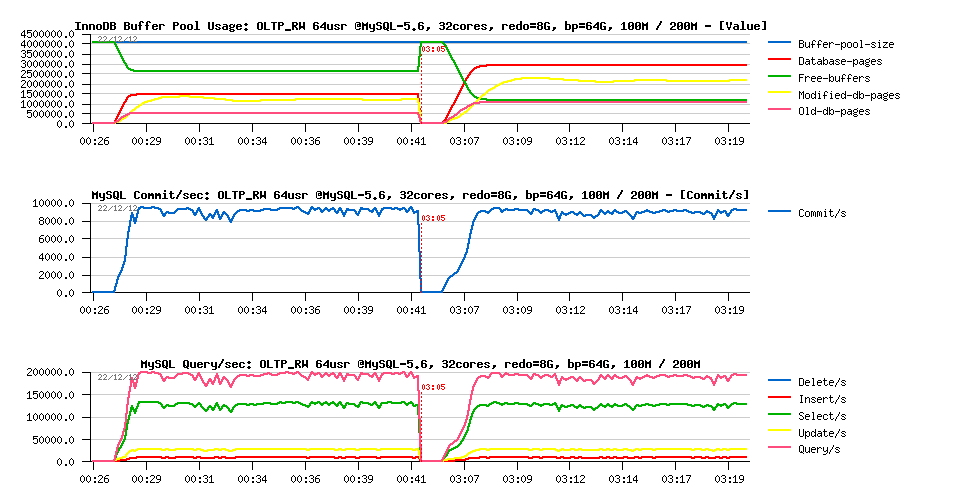
Observations :
- On both test cases the same near 200K QPS level and over 9000 commit/sec
- and all data are fully cached within BP
Flushing activity :
Observations :
- dirty page flushing became stable on 6000 pages/sec on 100M, and 8500 pages/sec on 200M - and as you can see it's not twice higher because of a twice bigger data volume
- Checkpoint Age remains far from 7GB limit, but still lower on 100M vs 200M
- while REDO log write rate remains near the same for both cases..
Waits reported by PFS :
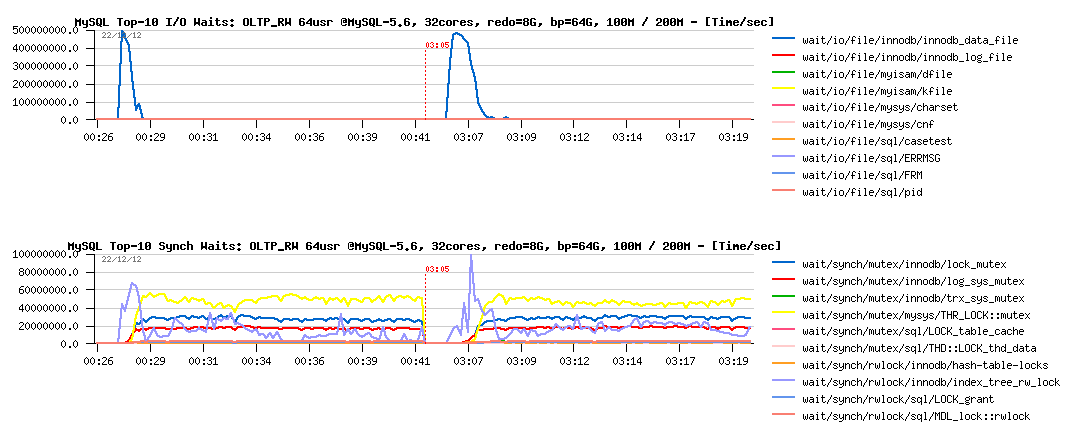
Observations :
- on the test start the I/O related waits are dominating (data reads)
- this also increasing index lock contention (due data reads), more higher on 200M
- then, main contention is moving to the lock_mutex (THR_LOCK::mutex wait can be ignored as it's only self-thread lock, not related to the concurrency)..
Let's reduce now the REDO log size to 3GB:
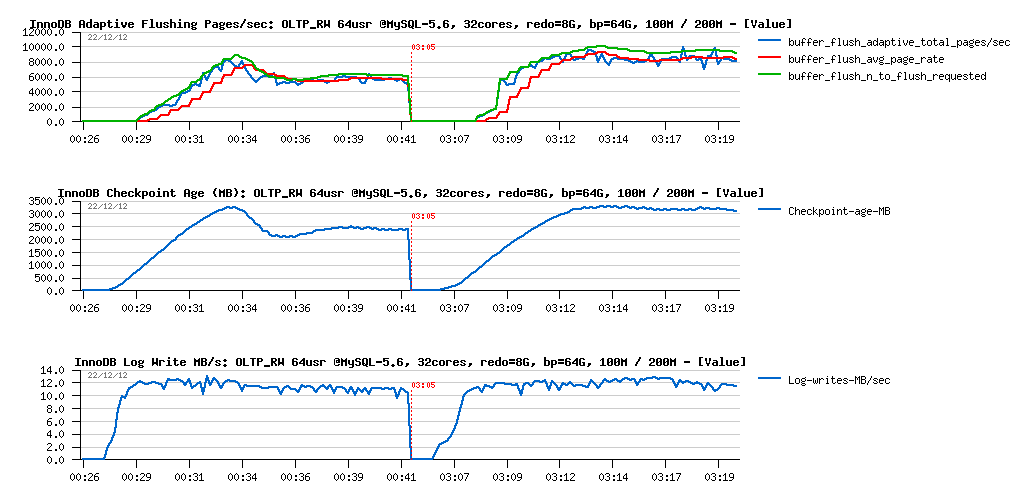
OLTP_RW 100M vs 200M, bp=64G, redo=3G :
Observations :
- performance is slightly lower now on 200M comparing to the 100M volume..
- while on 100M volume the result remaining the same as before
What about flushing?
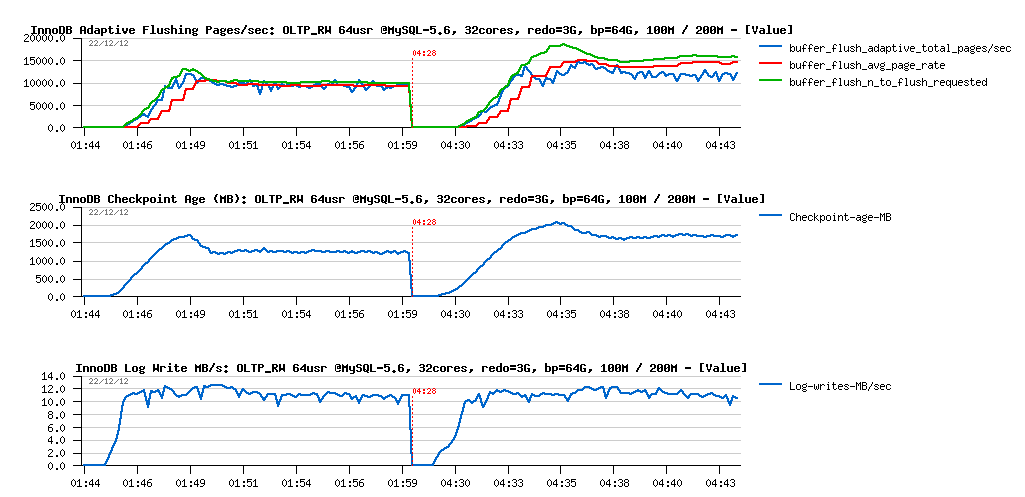
Observations :
- nothing abnormal on REDO log write speed, remains similar and stable in both cases
- Checkpoint Age became stable pretty quickly and then remains under 2500MB critical level
- then on 100M test we're running with a stable 10K flushed pages/sec
- while on the 200M test - you may see that flushing is reaching 15K pages/sec first, and than running on around of 12K pages/sec
- and what is interesting within 200M case: the flush avg page rate (red line on the graph) is no more matching the real pages/sec level (blue line).. - why? -- in fact the "avg page rate" is calculated internally within Adaptive FLushing code regardless the real flushing page/sec rate and indicates what should happen according Adaptive Flushing expectations (all requested writes should be finished during expected time); so, when it's not happening, and we're observing a deviation like here, it means that storage I/O level is unable to follow the write requests coming from InnoDB..
- And, of course, the main question since then is it really because of the storage the flushing rate is unable to follow the requested speed, or there may be some other reasons as well?..
Let's check our wait events :
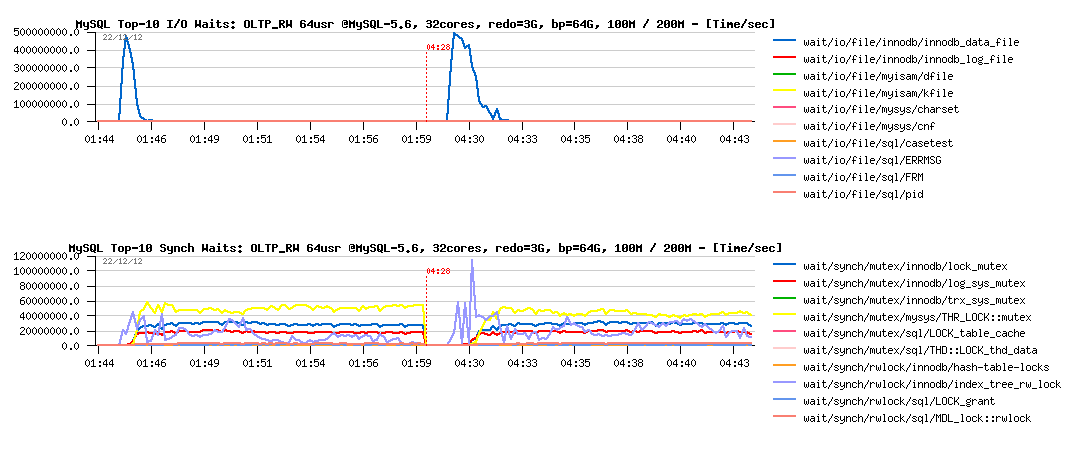
Observations :
- well, there is no really any difference between 100M and 200M test case..
- but probably it's more different from the previous test with 8GB REDO logs?..
More in depth with wait events, all 4 tests together :
Observations :
- hm.. all 4 tests are looking exactly the same..
- maybe we're simply missing some critical instrumentations here?
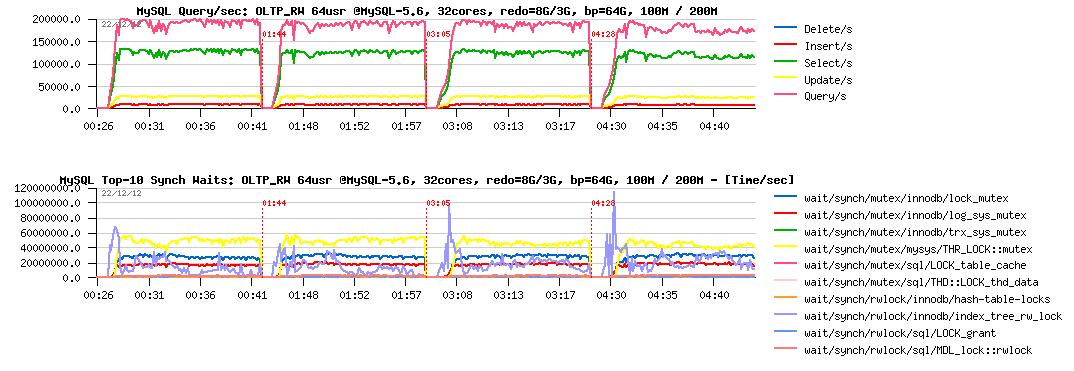
What is great the in MySQL 5.6 there are additional instrumentation counters available for InnoDB via its METRICS table (from where I'm getting data currently presented for flushing rate). Another interesting data to monitor from there is the number of pages which were scanned during flushing process! Let's compare scanned pages/sec levels during all these 4 tests:
More in depth with flushing :
Observations :
- first of all you may see that we have a problem here: there is no reason to scan 200K pages/sec to flush only 5K pages/sec!..
- then, as you see, with a higher flushing level, yet more pages are scanned/sec, and this is simply wasting CPU time ;-)
- so, we have here the first problem to fix..
PROBLEM #1 : Too much pages scanned on flushing
- why it may happen?
- in fact this is related to the InnoDB design, and coming from a long date now: the flush list is supposed to be accessed concurrently, and in some situations the "previous" pointer in the list may become no more valid, so the flushing code should to rescan the list from the tail again to find next pages to flush..
- the fix is not trivial, and may require some in depth remastering of the code..
- but I've already tried to hack it little bit, and may confirm you we can remove this gap completely and save a lot of CPU cycles ;-)
- then, the real improvement will come once a parallel flushing will be implemented in 5.7 !..
But well, this is not the only problem ;-))
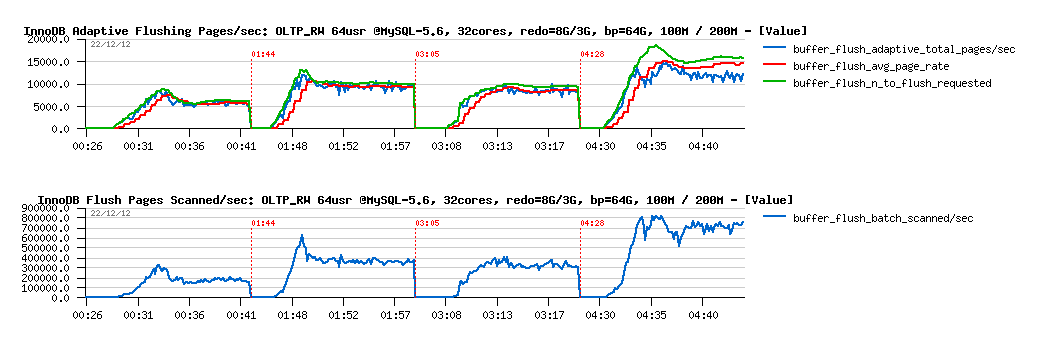
Let's see now what will happen if I'll change little bit test conditions to be more write aggressive on the same data volumes? -- I'll change Sysbench options now to keep only one "read" per RW transaction: only a single POINT-SELECT, this will completely change Read/Write operations ratio and involve much more writes than before. Let's call it OLTP_RW++ :-)
The following graphs are reflecting the changes.
and just to remind you about the order of tests on graphs from left to right:
- 100M, redo=8GB
- 100M, redo= 3GB
- 200M, redo= 8GB
- 200M, redo= 3GB
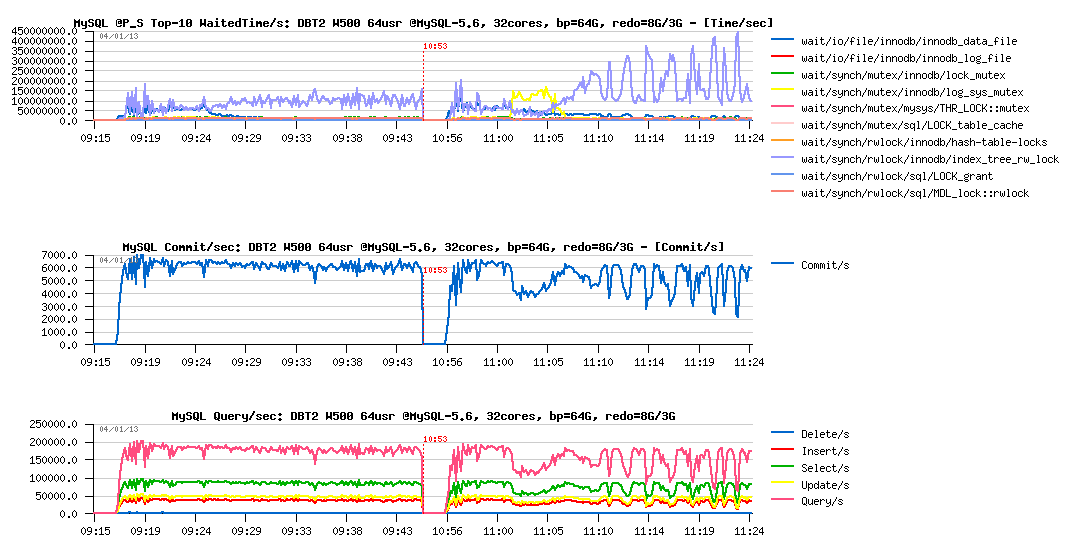
OLTP_RW++ 100M/200M, redo=8GB/3GB :
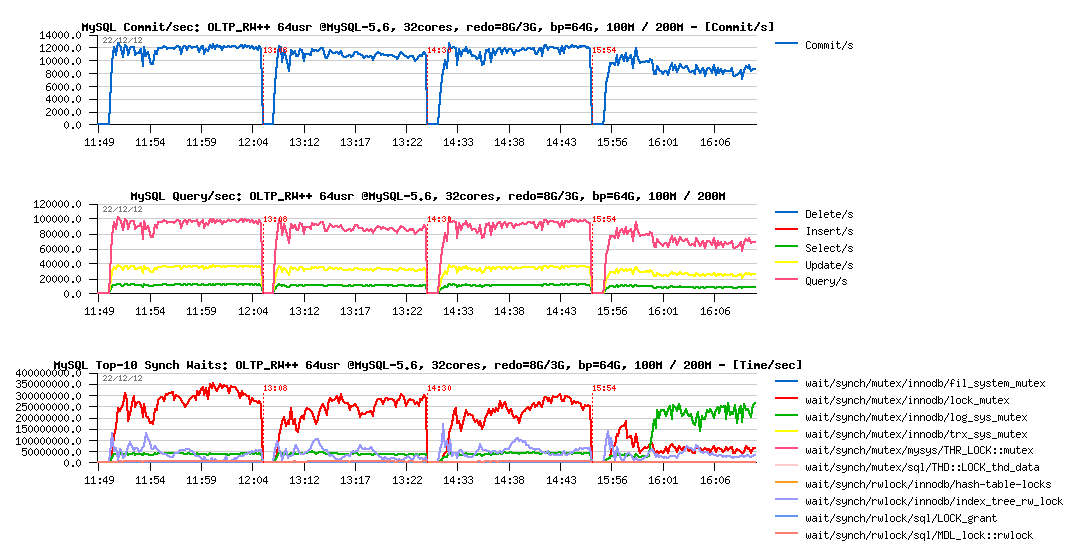
Observations :
- interesting that with 8GB REDO logs space both test cases (100M and 200M) having the same level of performance (and you may remark the higher number of commit/sec comparing to the previous tests, so even QPS is lower, we're writing much more now, see also the Updates/sec level)..
-
but with 3GB REDO logs things become more harder:
- 100M case seems to have a lower performance now
- and 200M performance is decreased even yet more and hitting log_sys_mutex contention (seems like flushing is not going fast enough to keep Checkpoint Age under critical level (2500M in this case), or REDO is hitting the read-on-write issue (verified: not hitting)
- interesting that on the 100M test case the levels of wait events are pretty similar
- however comparing to previous OLTP_RW tests, here the lock_mutex contention is really dominating
What about flushing?
Flushing details :
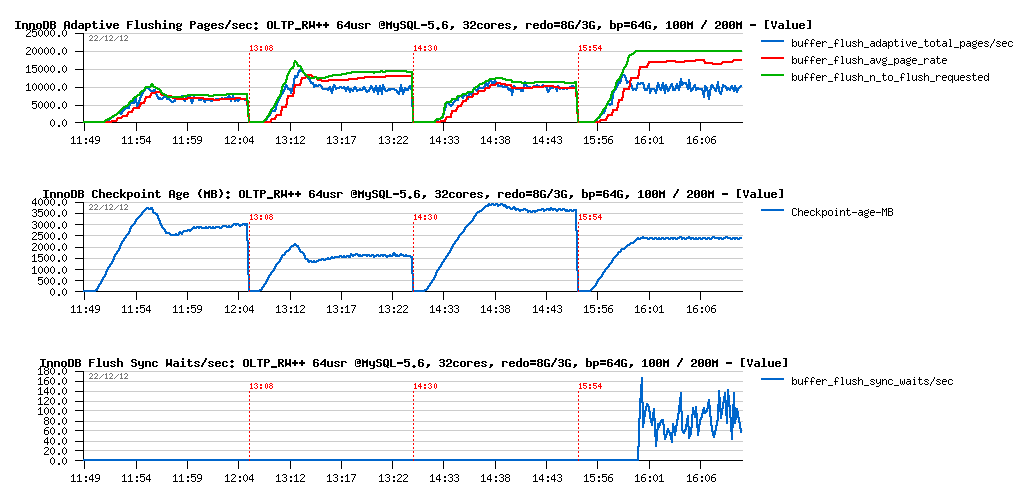
Observations :
- as expected, there is no problems on both volumes when REDO logs space is 8GB
- curiously the 10K pages/sec flushing level is looking here like the I/O border limit.. (while it's not really possible, as my SSD(s) are able to do more (verified before)..
-
then on 3GB REDO:
- 200M case is unable to follow the REDO writes and rising the 2500M limit, involving waits on a sync flush (as seen on the graph)
- 100M case is yet more interesting: we're fine with a flushing speed here, lock contentions times are not higher than with 8GB REDO, but performance is lower.. - why? - the answer is simple: each involved I/O is representing a cost + combined with lock_mutex contention resulting in performance decrease.. As well, I'm pretty sure that lock_mutex contention here is also having its effect on deviation of the flush_avg_page_rate, needs to be more investigated..
PROBLEM #2 : lock_mutex contention - Well, this one is just needed to be fixed ;-) (and I've also started this article by observing this contention - seems to be one of the next hot bottlenecks, depending, of course, on a workload).
And what is changing when we're short in memory? and instead of 64GB may allow only 16GB Buffer Pool size?..
The next graphs are representing the following workloads:
- OLTP_RW 100M, pool=16GB, redo=3GB
- OLTP_RW 200M, pool=16GB, redo=3GB
- OLTP_RW++ 100M, pool=16GB, redo=3GB
- OLTP_RW++ 200M, pool=16GB, redo=3GB
all the following tests used 3GB REDO logs size, no need a bigger one, and you'll see why:
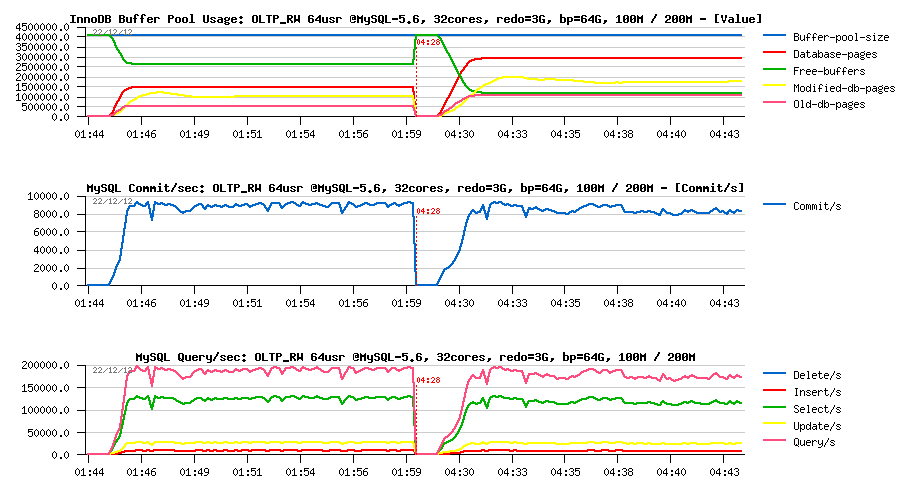
OLTP_RW and OLTP_RW++ with 16GB Buffer Pool :
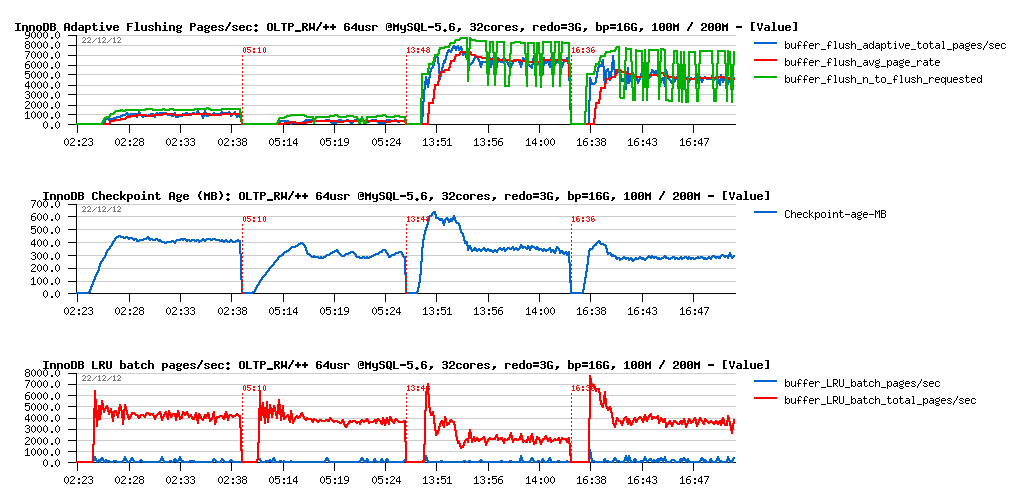
Observations :
- Checkpoint Age remains very low within all of the tests, so even 2GB REDO was more than enough here ;-),
- however flushing activity is now including also "LRU flushing" (happening mainly when InnoDB is looking for a free page in the Buffer Pool and need to recycle the most less used ones, but they are appearing to be dirty, so should be flushed first)
- and as well, bigger data volume involving a more intensive LRU flushing
- keeping in mind a low Checkpoint Age, we may already suspect performance regression (lower REDO write rate may only mean lower transactions rate)..
So, what about performance:
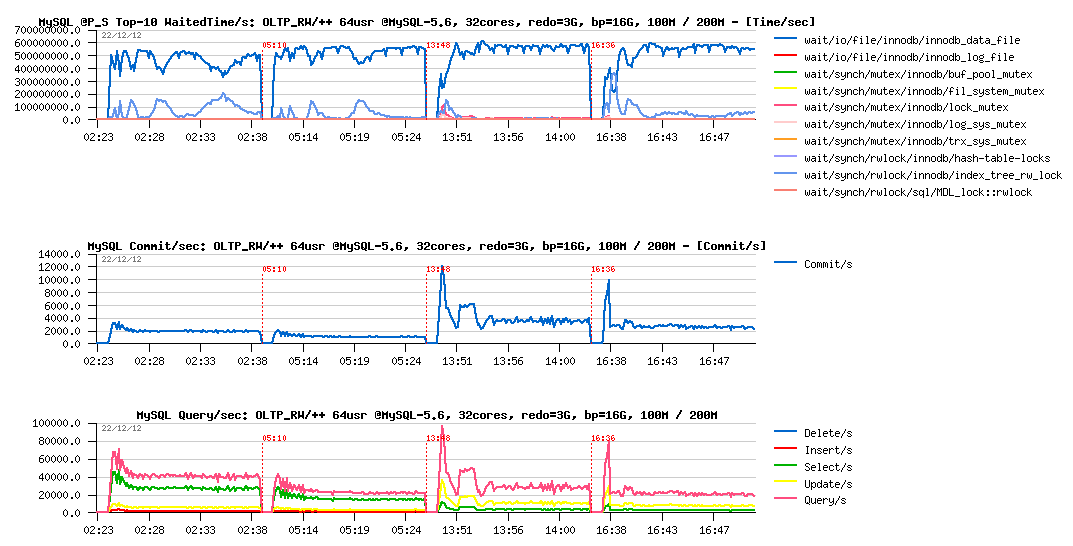
Observations :
- performance is something like x5 times worse now..
- however PFS is explaining very well why it happens: the main wait time is spent on the data reads! (and as PFS is also reporting now FILE_IO events too, I was able to go more in detail and see that for the particular Sysbench data file the read service time was several milliseconds, while OS is reporting not more than 0.3ms - so, there is something to investigate for sure)
But well, this workload is exactly the case when only faster disks may help you or using/buying more RAM (as you saw, with 64GB pool the result is x5 times better, while finding here yet more faster disks than SSD would probably not help as much)..
Then, to finish the story, let's replay something similar also on the DBT2 (very similar to TPCC-like) workload.
The next graphs are corresponding to the following test cases on DBT2 with 64 concurrent users:
- redo= 3GB, bp= 64GB, W50 (50 warehouses)
- redo= 3GB, bp= 64GB, W100
- redo= 3GB, bp= 64GB, W250
- redo= 3GB, bp= 64GB, W500
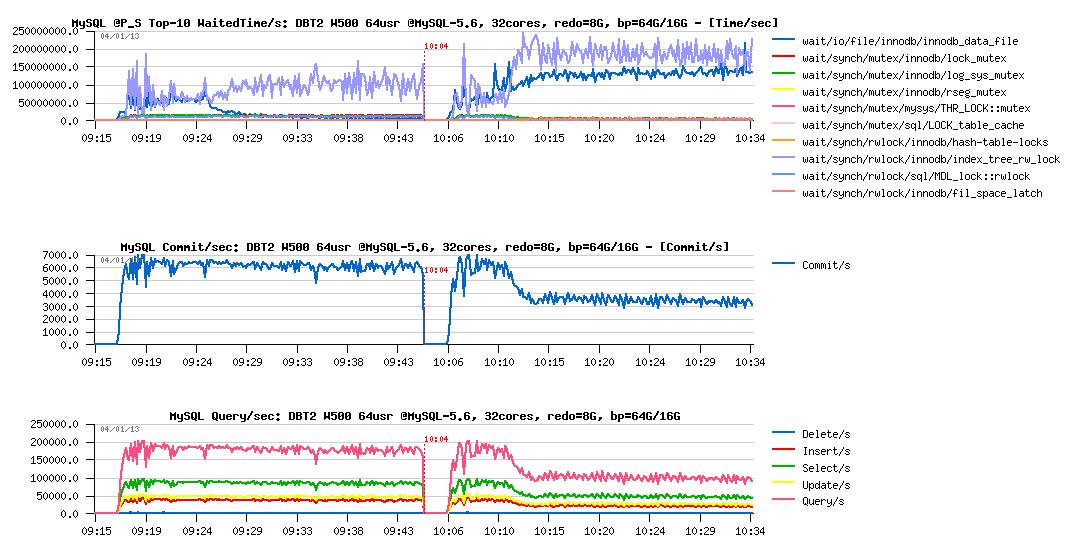
DBT2 redo=3GB, bp=64GB, W50/ W100/ W250/ W500 :
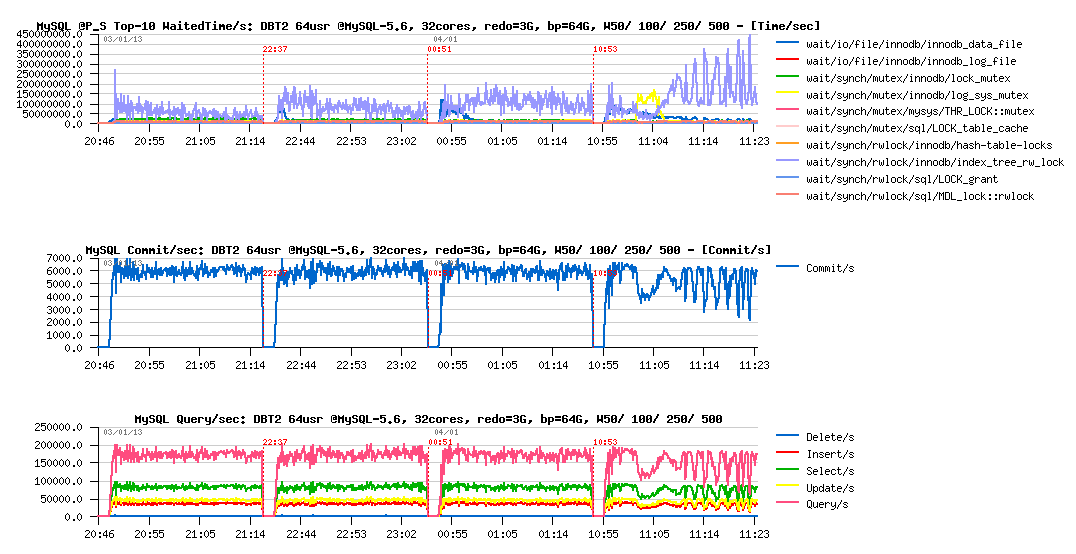
Observations :
- mutex lock contention is dominating here, and constantly growing with a bigger data volume
- up to W500 volume, performance is still remaining stable
-
but since W500:
- index lock contention seems to have a direct impact on QPS level
- looks like on the workload startup we're hitting a log_sys_mutex waits: seems flushing is not going fast enough, and Checkpoint Age is reaching the critical level, and the sync ("furious") flushing is involved (BTW, in 5.6 even "furious flushing" is not so furious as before ;-))
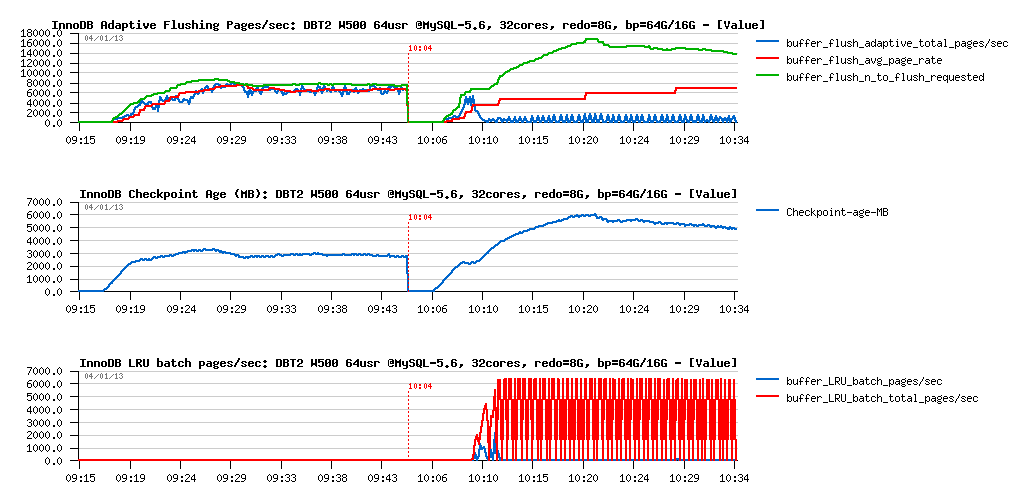
Let's get a look on the flashing activity now:
Observations :
- same here, up to W500 volume all things are looking pretty well..
-
and on W500 it becomes much more interesting:
- looks like on the beginning the flushing rate is stuck on 5K pages/sec level and don't willing to grow even we're requested up to 20K pages/sec to flush! (look on the green line with flush "requested" and blue line with adaptive total pages/sec )..
- which is leaving Checkpoint Age growing unprotectedly, reaching 2500M critical level, and involving sync flushing (and sync flushing waits)..
- once the critical period of startup is passed, flushing is reaching a stable 10K pages/sec rate (again 10K?? why 10K?? :-))
- no deviation then with avg page rate (while here too scanned pages/sec level is many times higher than flushing)
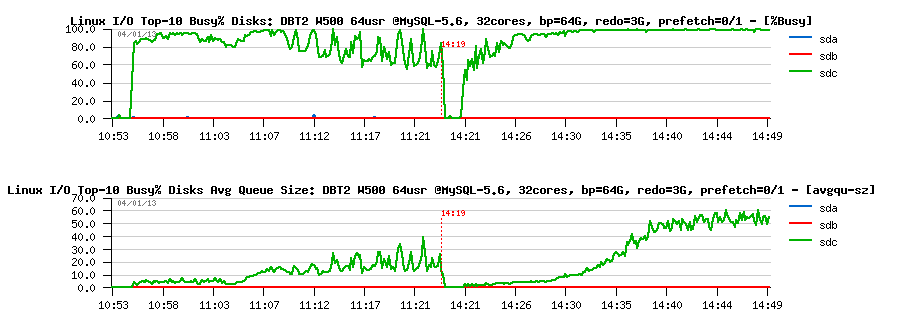
Let's focus more closely on the W500 case then.
We may easily expect that with a bigger REDO log size we will avoid sync flushing waits at least, but will it protect the workload from the QPS "waves" due mutex lock contentions?..
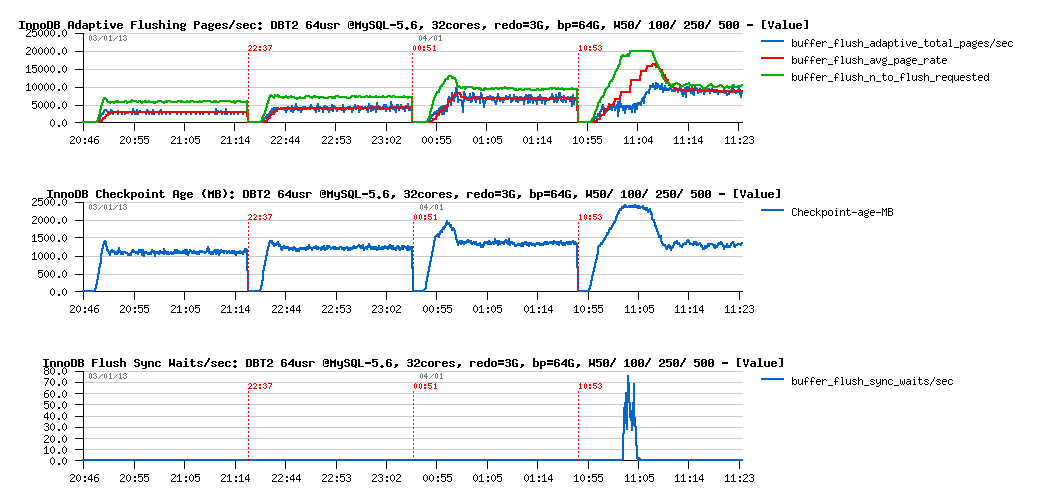
DBT2 W500 bp=64GB, redo= 8GB vs 3GB :
Observations :
- there is no more QPS drops or "waves" when 8GB REDO logs size is used (left part of graphs)
- seems like it's very directly depending on the index lock contention..
- as well there is no more log_sys_mutex contention, as expected: 8GB REDO space is big enough here to leave more marge for flushing on the test startup (note: on W1000 or W2000 volume it may be not enough again, depends on contention and storage performance)..
What about flushing:
Observations :
- things are radically different with 8GB REDO here.. - flushing rate is remaining stable on the 7K pages/sec
- but well, if index lock contentions are workload related, then we should also observe them on the 8GB REDO test too, right?..
- the feeling I have that the "waves" we observed are related to some I/O related limits.. We're hitting here something..
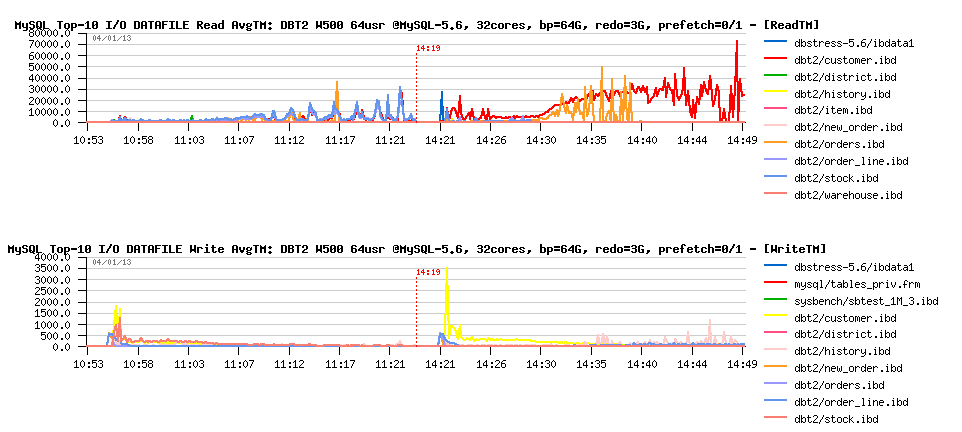
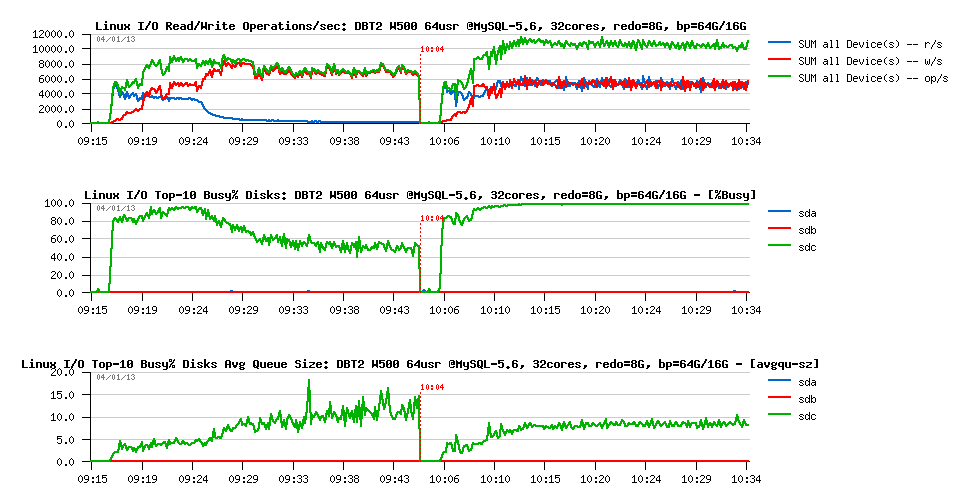
Let's get a look on the I/O operations stats during these both workloads:
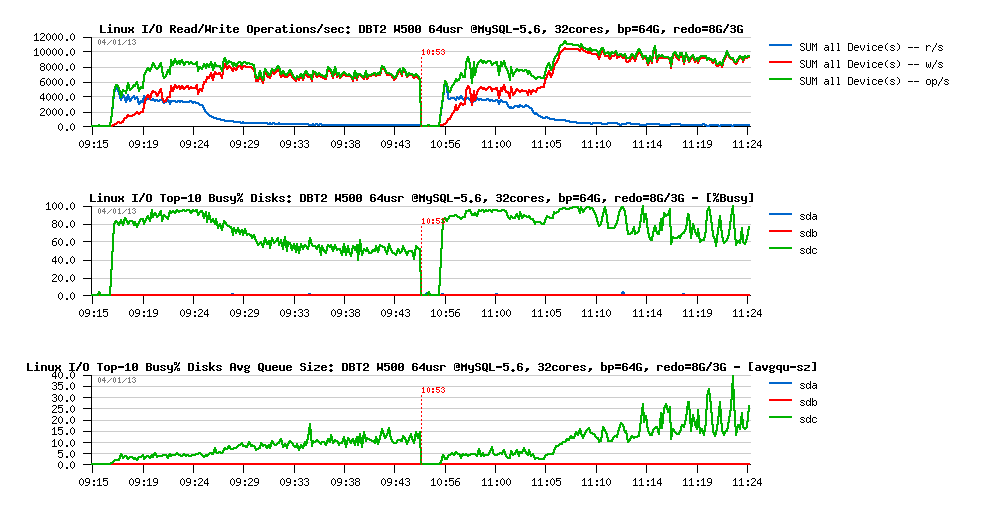
Observations :
-
we can see here clearly here the 2 phases on each workload:
- startup, when most of pages are yet reading from the disk
- and then a stable phase when most of the data arrived to the Buffer Pool, and writing become the main I/O activity
- and what is interesting that the "waves" phase is coming during a "stable" period
- however, the level of I/O operations rate is remaining pretty constant and has no such "waves"..
- so, why the "waves" are coming?..
-
the answer is coming from the I/O queue graph:
- it has "waves" (avgqu-sz), which means the number of I/O operations queued per second is varying over a time
- but the number of executed I/O operations remains the same.. - what does it mean?
- it may mean only that only a part of I/O requests from the queue was executed on time, and some of them may wait longer!
- however, OS is reporting that avg I/O service time (response time) was stable and around 0.3ms.. - but probably it's only because of writes?..
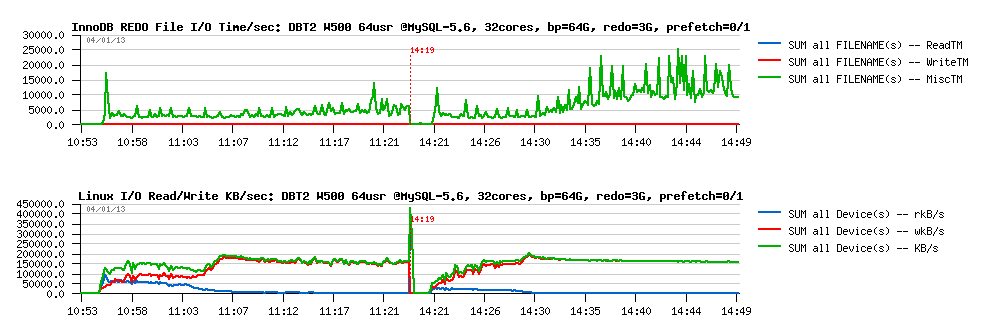
To understand if it's true or not, we may now get a help from MySQL Performance Schema (PFS) - remember that since MySQL 5.6 it reports now also various details about file I/O operations and times, and let's see it in action:
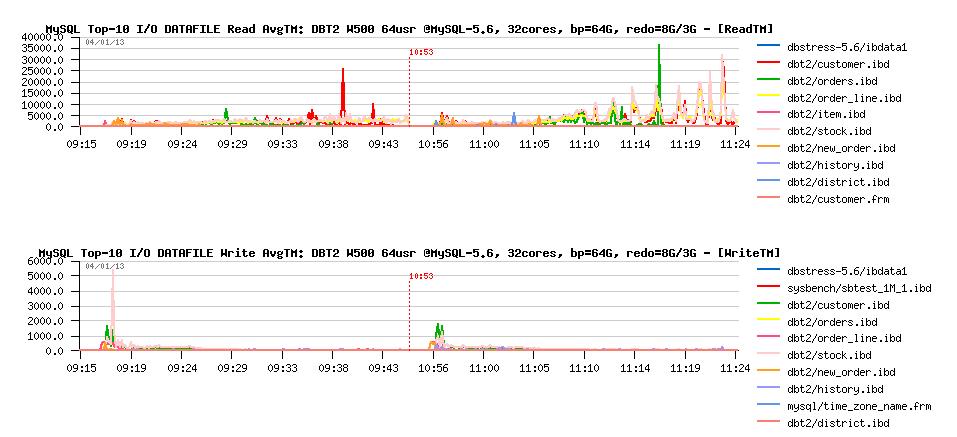
Observations :
- Bingo! if there is no any big waits on write operations, there are pretty important waits reported on reads!
- note that times are reported here in usec, means we have some spikes up to 35ms on reads... - hard to believe (specially when SSD is used), but cannot be ignored in any case (while probably a more detailed instrumentation is needed here to understand the problem better)..
However the question here is what is a main and what is a result event?
- do we have index lock "waves" because of the overloaded I/O queue?
- or because of index locks we're involving I/O requests in "burst" mode wave by wave?..
- there is something to dig here, and I'm impatient to see index lock just fixed (planned for MySQL 5.7) - it will resolve so many questions ;-))
But well, what I can try now is simply to prefetch most of the data before the test workload is started and then see what will be changed:
DBT2 W500 bp=64GB, redo=3GB, prefetch= off / on :
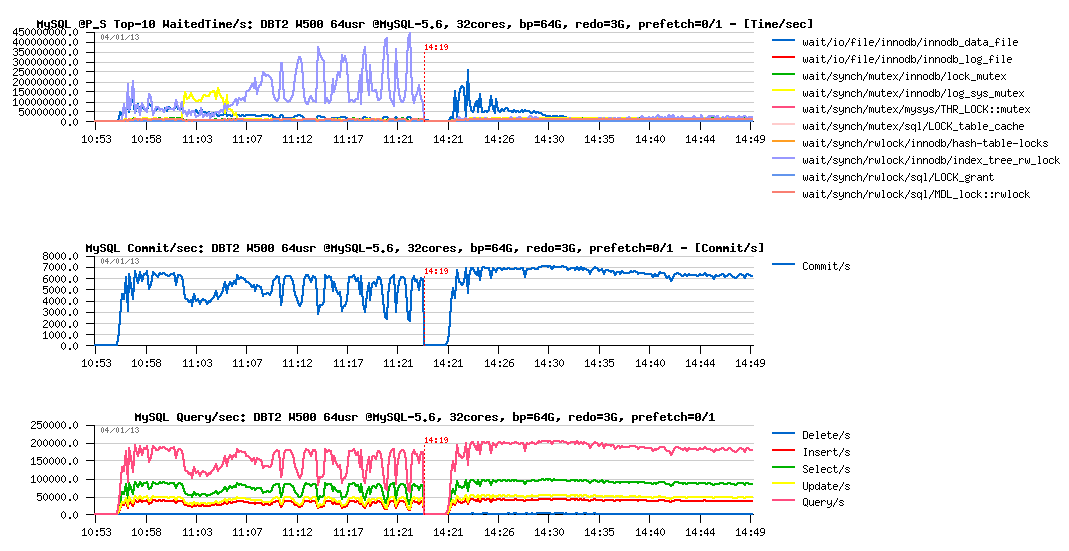
Observations :
- wow! did not expect it'll become so fun ;-)
- QPS level is just stable like never!
- performance is better (you may see that we out-passed 7000 commit/sec)
- and what is completely incredible: index lock waits are disappeared!.. - how it's even possible?..
Let's get a look on the flushing now:
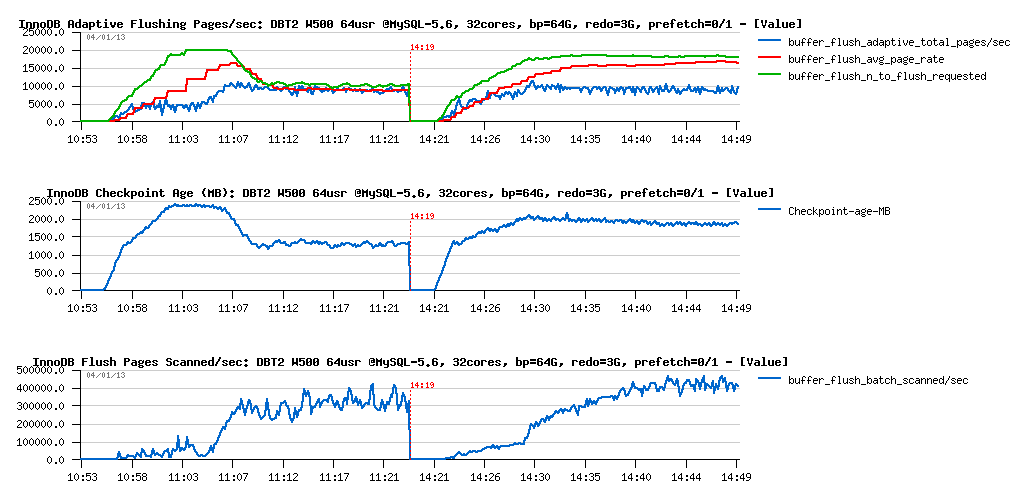
Observations :
- another surprise: flush rate is the same 10K pages/sec (again 10K? ;-), but avg page rate is deviating now..
- the flush scanned pages/sec rate increased from 300K to 400K, but may 100K more scanned pages/sec explain deviation?
- seems to me until we'll not get it fixed, we'll not have an answer..
- or maybe is nome load conditions 10K random writes/sec become a real limit of the I/O level?.. (while on pure I/O test I've observed much more)
What about I/O stats?
Observations :
- looks like my SSD(s) are fully occupied now (sdc - is /dev/sdc device corresponding to my RAID-0 from x3 SSD LUN)
- while I/O queue is out-passed 50 I/O operations and not jumping anymore..
Did we increase some I/O waits reported by PFS?
Observations :
- wow! avg read time is increased a lot on some of the data files!
- does it explain disappearing of the index lock contentions? (slower reads making less concurrency?) - very interesting ;-)
- seems to me here too a proper fix for index lock contention will really help a lot!
And what PFS is saying about I/O waits on the REDO log files?
Observations :
- wow! another surprise: we're spending more "Misc" time now on REDO logs I/O (I suppose it's about fsync(), but PFS currently grouping all non-read and non-write times under "Misc" time, so will be great to see them separately (at least fsync(), and may be some other?)
- interesting that I/O activity did not change.. -- do we really reaching the I/O limit? -- I still have impression that wait are coming not because we're hitting the I/O limitations.. - seems to me I have to trace the wait events yet more in depth..
PROBLEM #3 : index lock contention - this is not a new one either, very long dated, and the fix is pretty complex.. - so it was too short to get it ready for MySQL 5.6 timeframe. But once we'll remove this contention, I hope it'll clarify a lot of things ;-)
Well, let's not forget the test case when Buffer Pool was reduced from 64GB to 16GB. What we'll have on DBT2 W500?
DBT2 W500 redo= 3GB, bp= 64GB / 16GB :
Observations :
- ok, performance is x2 times worse (but only x2 times, so better than on Sysbench, once again confirms that regression depends on a workload)..
- however, the REDO log size is really small here, as over all test duration the log_sys_mutex contention is on the top waits position..
Better to replay it with 8GB REDO:
DBT2 W500 redo= 8GB, bp= 64GB / 16GB :
Observations :
- still x2 times performance regression
- but the main wait times now moved to the index lock contention and InnoDB data file reads (and seems to me each one depending on each other)
Flushing activity:
Observations :
- as expected, LRU flushing became dominating
- Checkpoint Age remaining stable, yet under critical level, so 8GB for REDO was enough
But well, looks like adding constant data reads now having the most important impact on performance regression:
However PFS is not reporting any important FILE IO waits:

So, looks like the I/O operations are less important here rather an overall lock contentions and LRU flushing design.. - and we definitively have something to do here (probably also implement a parallel flushing from LRU as for flushing list, or redesign it more optimally, let's see ;-))
NOTE: since MySQL 5.6 there is an option in InnoDB to tune the LRU scan depth (innodb_lru_scan_depth) to improve LRU flushing and make user thread waits mush shorter, but in the current test case it did not help due very intensive I/O reads..
INSTEAD OF SUMMARY
- While there is some mystery flying around current RW limits in MySQL, the one thing you can be sure: if your InnoDB "buffer_flush_avg_rate" constantly out-passing your "buffer_flush_adaptive_total_pages/sec" then you're hitting some limits on your dirty pages flushing!
- how to see it? - simple SELECT from InnoDB METRICS table (the avg rate is showing the current value, while the total pages is incremental, so you'll just need to do some simple maths to get pages/sec from here, probably I should write an article one day how I'm analyzing all this stuff, as every few days somebody is asking..)
- also, keep in mind that you may always reduce your flushing lag by increasing REDO logs size (while, of course, having too big REDO logs is not the only solution - just until we'll get it fixed ;-))
- then, if you're observing "lock mutex" or "index lock" (or other) contentions during your test or production workloads - please, bring us your details, it'll help us to fix them in the most optimal way (and not keeping in mind only our test cases)..
- well, MySQL 5.6 has already a lot of performance improvement, but yet more are waiting for us again to be done..
- some problems are known today, some new one yet will come (and I'm pretty sure Vadim and Peter will bring us yet more of them ;-)
- some will be fixed in MySQL 5.6, some will be fixed only in 5.7..
- but well, be sure we're taking all of them seriously, and working on them..
- so, stay tuned ;-)
to be continued...
Rgds,
-Dimitri
Friday, 16 November, 2012
MySQL Performance: InnoDB vs MyISAM in 5.6
Since the latest changes made recently within InnoDB code (MySQL 5.6) to
improve OLTP Read-Only performance + support of full text search (FTS),
I was curious to compare it now with MyISAM..
While there was no
doubt that using MyISAM as a storage engine for a heavy RW workloads may
become very quickly problematic due its table locking on write design,
the Read-Only workloads were still remaining favorable for MyISAM due
it's extreme simplicity in data management (no transaction read views
overhead, etc.), and specially when FTS was required, where MyISAM until
now was the only MySQL engine capable to cover this need.. But then FTS
came into InnoDB, and the open question for me is now: is there still
any reason to use MyISAM for RO OLTP or FTS wokloads from performance
point of view, or InnoDB may now cover this stuff as well..
For
my test I will use:
- Sysbench for OLTP RO workloads
- for FTS - slightly remastered test case with "OHSUMED" data set (freely available on Internet)
- All the tests are executed on the 32cores Linux box
- As due internal MySQL / InnoDB / MyISAM contentions some workloads may give a better results if MySQL is running within a less CPU cores, I've used Linux "taskset" to bind mysqld process to a fixed number of cores (32, 24, 16, 8, 4)
Let's get a look on the FTS performance first.
The OHSUMED test contains a less than 1GB data set and 30 FTS similar queries, different only by the key value they are using. However not every query is returning the same number of rows, so to keep the avg load more comparable between different tests, I'm executing the queries in a loop rather to involve them randomly.
The schema is the following:
 CREATE TABLE `ohsumed_innodb` (
	`docid` int(11) NOT NULL,
	`content` text,
	 PRIMARY KEY (`docid`)
 ) ENGINE=InnoDB DEFAULT CHARSET=latin1;

 CREATE TABLE `ohsumed_myisam` (
	`docid` int(11) NOT NULL,
	`content` text,
	 PRIMARY KEY (`docid`)
 ) ENGINE=MyISAM DEFAULT CHARSET=latin1;

 alter table ohsumed_innodb add fulltext index ohsumed_innodb_fts(content);
 alter table ohsumed_myisam add fulltext index ohsumed_myisam_fts(content);
And the FTS query is looking like this:
SQL> SELECT count(*) as cnt FROM $(Table) WHERE match(content) against( '$(Word)' );
The $(Table) and $(Word) variables are replaced on fly during the test
depending which table (innoDB or MyISAM) and which key word is used
during the given query.
And there are 30 key words, each one
bringing the following number of records in the query result:
 ------------------------------------------------------------
   Table: ohsumed_innodb
 ------------------------------------------------------------
  1. Pietersz             : 6
  2. REPORTS              : 4011
  3. Shvero               : 4
  4. Couret               : 2
  5. eburnated            : 1
  6. Fison                : 1
  7. Grahovac             : 1
  8. Hylorin              : 1
  9. functionalized       : 4
 10. phase                : 6676
 11. Meyers               : 157
 12. Lecso                : 0
 13. Tsukamoto            : 34
 14. Smogorzewski         : 5
 15. Favaro               : 1
 16. Germall              : 1
 17. microliter           : 170
 18. peroxy               : 5
 19. Krakuer              : 1
 20. APTTL                : 2
 21. jejuni               : 60
 22. Heilbrun             : 9
 23. athletes             : 412
 24. Odensten             : 4
 25. anticomplement       : 5
 26. Beria                : 1
 27. coliplay             : 1
 28. Earlier              : 2900
 29. Gintere              : 0
 30. Abdelhamid           : 4
 ------------------------------------------------------------
Results are exactly the same for MyISAM and InnoDB, while the response
times are not. Let's go in details now.
FTS : InnoDB vs MyISAM
The following graphs are representing the results obtained with:
- MySQL is running on 32, 24, 16, 8, 4 cores
- Same FTS queries are executed non-stop in a loop by 1, 2, 4, .. 256 concurrent users
- So, the first part of graphs is representing 1-256 users test on 32 cores
- The second one the same, but on 24 cores, and so on..
- On the first graph, once again, Performance Schema (PFS) is helping us to understand internal bottlenecks - you'll see the wait events reported by PFS
- And query/sec (QPS) reported by MySQL on the second one
InnoDB FTS :
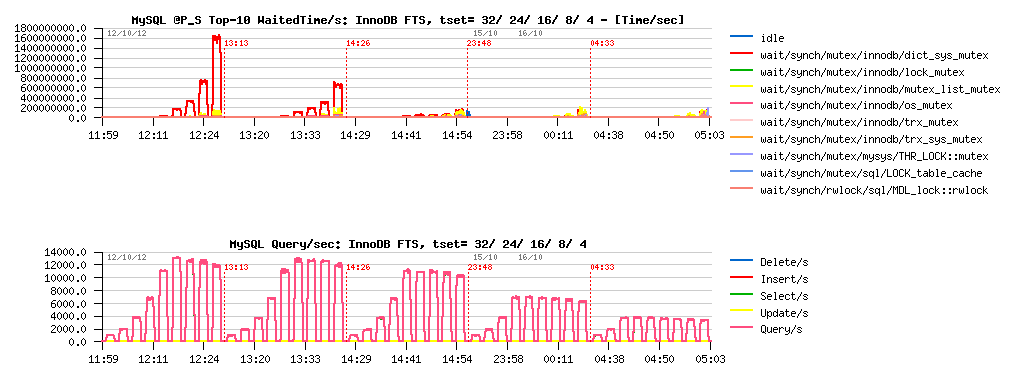
Observations :
- InnoDB FTS is scaling well from 4 to 16 cores, then performance is only slightly increased due contention on the dictionary mutex..
- However, there is no regression up to 32 cores, and performance continues to increase
- The best result is 13000 QPS on 24 or 32 cores
MyISAM FTS :
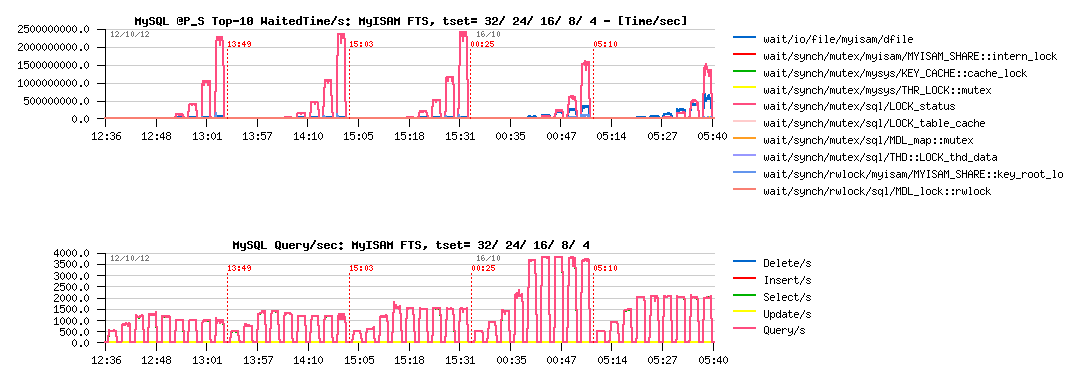
Observations :
- MyISAM FTS is scaling only from 4 to 8 cores, and then drop in regression with more cores..
- The main contention is on the LOCK_status mutex
- The best result is 3900 QPS on 8 cores
What about this LOCK_status mutex contention?.. - it gives an impression of a killing bottleneck, and if was resolved, would give an expectation to see MyISAM scale much more high and maybe see 16000 QPS on 32 cores?..
Well, I'd prefere a real result rather an expectation here ;-) So, I've opened MyISAM source code and seek for the LOCK_status mutex usage. In fact this mutex is mainly used to protect table status and other counters. Sure this code can be implemented better to avoid any blocking on counters at all. But my goal here is just to validate the potential impact of potential fix -- supposing there is no more contention on this mutex, what kind of the result may we expect then??
So, I've compiled an experimental MySQL binary having call to LOCK_status mutex commented within MyISAM code, and here is the result:
MyISAM-noLock FTS :

Observations :
- LOCK_status contention is gone
- But its place is taken now by data file read waits... - keeping in mind that all data are already in the file system cache...
- So, the result is slightly better, but data file contention is killing scalability
- Seems like absence of its own cache buffer for data is the main show-stopper for MyISAM here (while FTS index is well cached and key buffer is bigger than enough)..
- The best result now is 4050 QPS still obtained on 8 cores
-
NOTE :
- using mmap() (myisam_use_mmap=1) did not help here, and yet added MyISAM mmap_lock contention
- interesting that during this RO test performance on MyISAM was better when XFS was used and worse on EXT4 (just thinking about another point in XFS vs EXT4 discussion for MySQL) -- particularly curious because whole data set was cached by the filesystem..
So far:
- InnoDB FTS is at least x3 times faster on this test vs MyISAM
- As well x1.5 times faster on 8 cores where MyISAM shows its top result, and x2 times faster on 4cores too..
- And once dictionary mutex lock contention will be fixed, InnoDB FTS performance will be yet better!
OLTP Read-Only : InnoDB vs MyISAM
As a start point, I've used "classic" Sysbench OLTP workloads, which are accessing a single table in a database. Single table access is not favorable for MyISAM, so I will even not comment each result, will just note that:
- the main bottleneck in MyISAM during this test is on the "key_root_lock" and "cache_lock" mutex
- if I understood well, the solution to fix "cache_lock" contention in such a workload was proposed with cache segments in MariaDB
- however, it may work only in the POINT SELECTS test (where cache_lock contention is the main bottleneck)
- while in all other tests the "key_root_lock" contention is dominating and for the moment remains not fixed..
- using partitioned table + having per partition key buffer should help here MyISAM, but I'll simply use several tables in the next tests
- InnoDB performance is only limited by MDL locks (MySQL layer), so expected to be yet better once MDL code will be improved
- in the following tests InnoDB is x3-6 times faster than MyISAM..
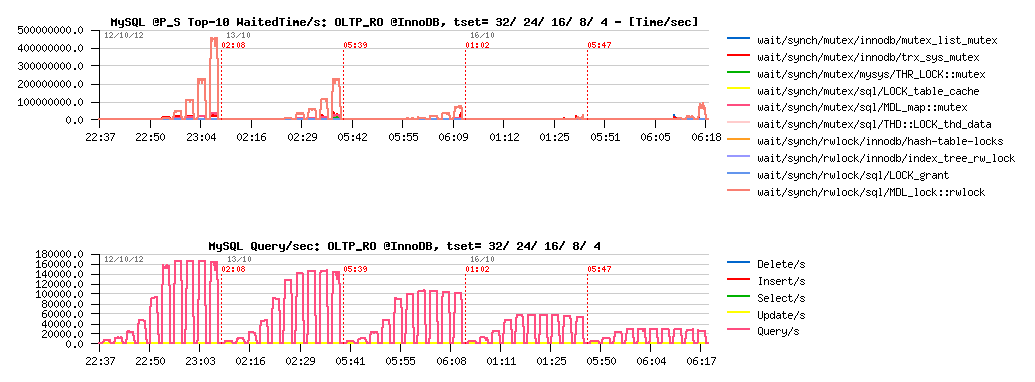
Sysbench OLTP_RO @InnoDB :
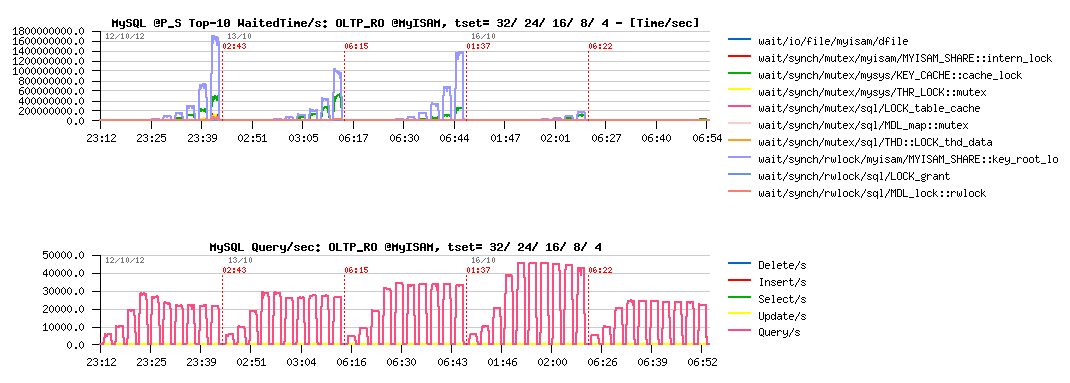
Sysbench OLTP_RO @MyISAM :
Sysbench Simple-Ranges @InnoDB :
Sysbench Simple-Ranges @MyISAM :
Sysbench Point-Selects @InnoDB :
Sysbench Point-Selects @MyISAM :
OLTP Read-Only with 8 tables : InnoDB vs MyISAM
Test with 8 tables become much more interesting, as it'll dramatically lower key_root_lock contention in MyISAM, and MDL contentions as well. However, we're hitting in MyISAM the key cache mutex contention, so there are 8 key buffers used (one per table) to avoid it. Then, scalability is pretty good on all these tests, so I'm limiting test cases to 64, 32, 24 and 16 cores (64 - means 32cores with both threads enabled (HT)). As well, concurrent users are starting from 8 to use all 8 tables at time.
Let's get a look on OLTP_RO workload first :
Sysbench OLTP_RO 8-tables @InnoDB :

Sysbench OLTP_RO 8-tables @MyISAM :
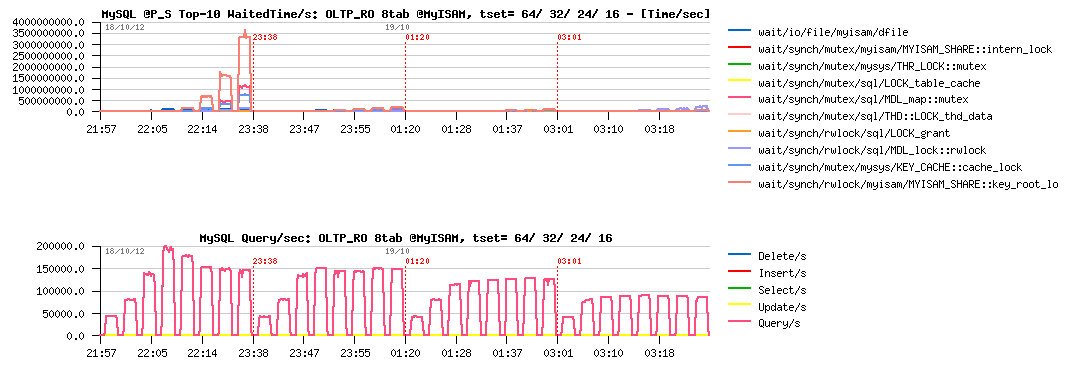
Observations :
- InnoDB is still better on OLTP_RO than MyISAM..
- for InnoDB, the main bottleneck seems to be on the MDL related part
- for MyISAM - key_root_lock is still here (not as much as before, but still blocking)
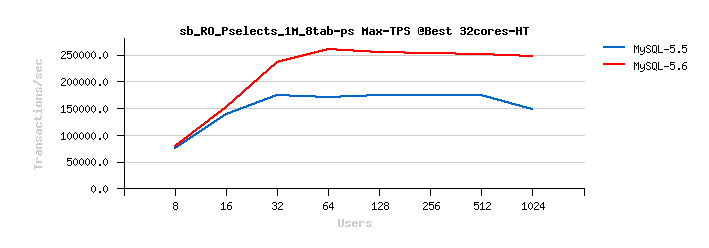
- InnoDB is reaching 215K QPS max, and MyISAM 200K QPS
- As you see, speed-up is very significant for both storage engines when activity is not focused on a single table..
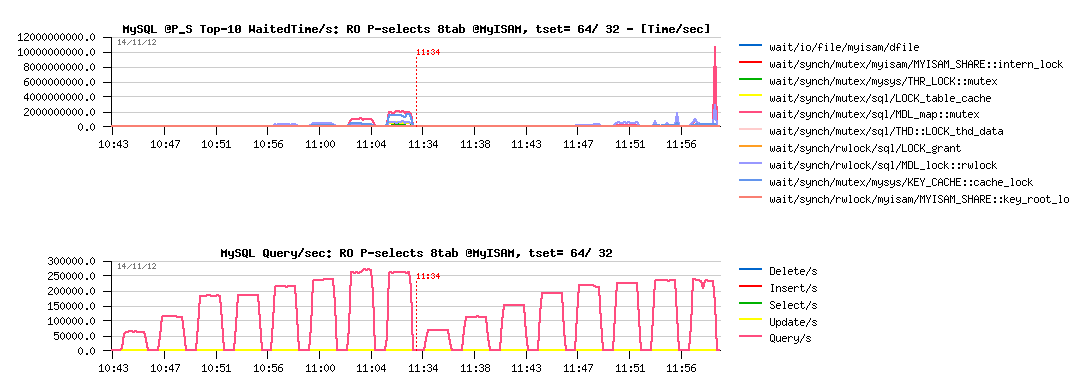
And to finish with this workload, let me present you the "most curious" case ;-) -- this test is getting a profit from the fact that within auto-commit mode MySQL code is opening and closing table(s) on every query, while if BEGIN / END transactions statements are used, table(s) are opened since BEGIN and closed only at the END statement, and as OLTP_RO "transaction" contains several queries, this is giving a pretty visible speep-up! Which is even visible on MyISAM tables as well ;-)
So, I'm just turning transactions option "on" within Sysbench OLTP_RO:
Sysbench OLTP_RO 8-tables TRX=on @InnoDB :
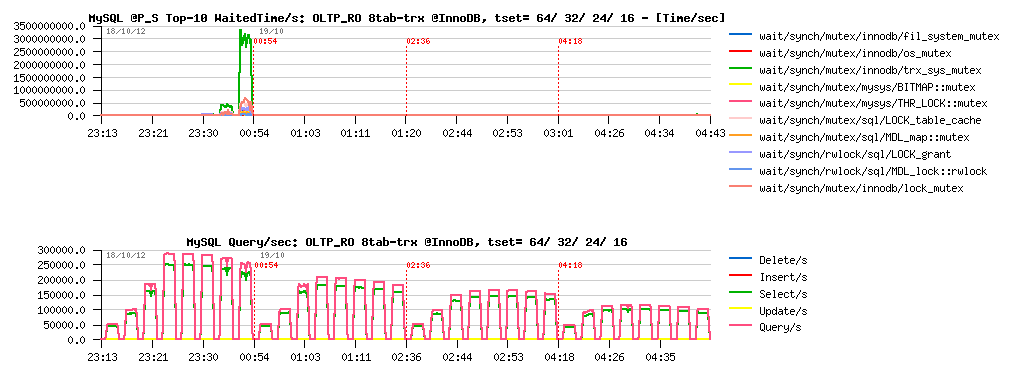
Sysbench OLTP_RO 8-tables TRX=on @MyISAM :
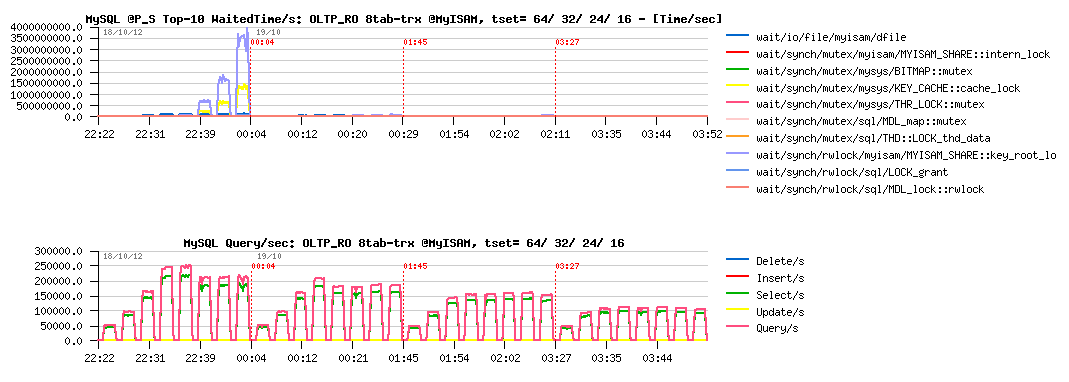
Observations :
- InnoDB is going from 215K to 250K QPS
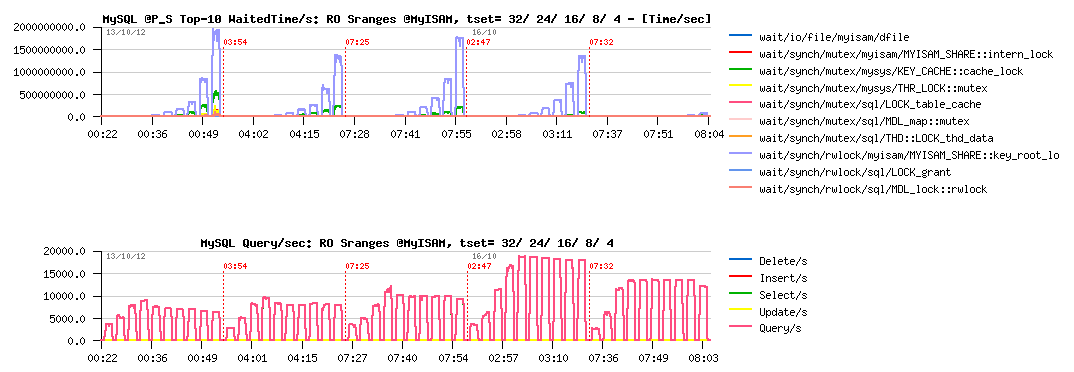
- MyISAM is going from 200K to 220K QPS
- there is definitively something to do with it.. ;-))
Now, what about SIMPLE-RANGES workload?
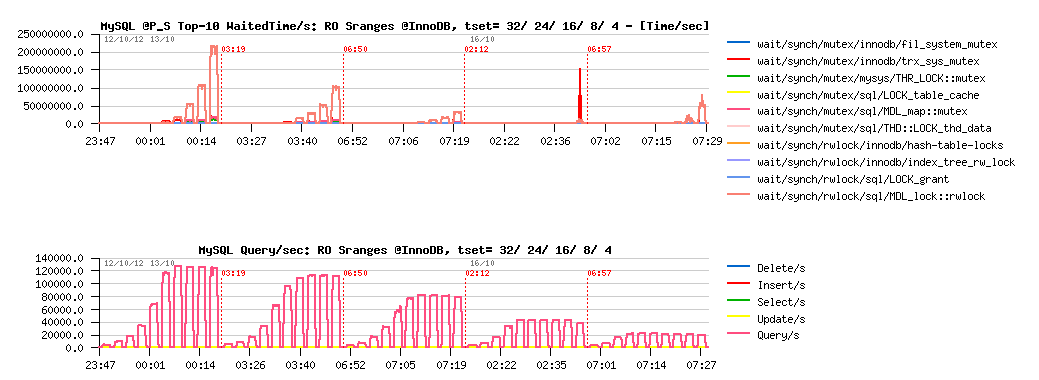
Sysbench RO Simple-Ranges 8-tables @InnoDB :
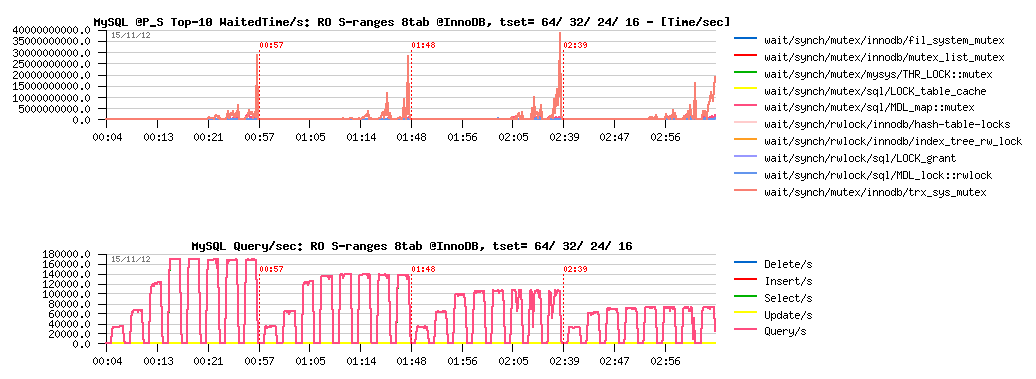
Sysbench RO Simple-Ranges 8-tables @MyISAM :
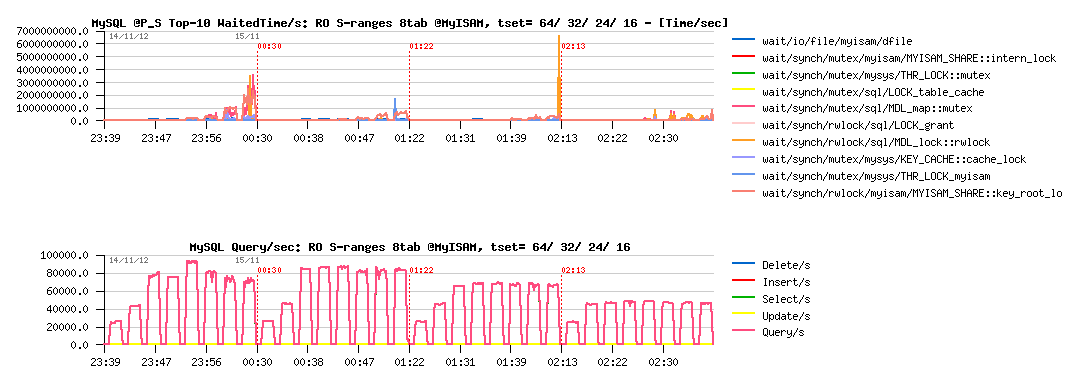
Observations :
- InnoDB is reaching 170K QPS here, mainly blocked by MDL related stuff..
- MyISAM is getting only 95K QPS max, seems to be limited by key_root_lock contention..
So far, InnoDB won over MyISAM on every presented test cases until here.
But get a look now on one case where MyISAM is still better..
POINT-SELECTS WITH 8 TABLES
I'm dedicating a separate chapter for this particular test workload, as it was the only case I've tested where MyISAM out-passed InnoDB in performance, so required more detailed analyze here.. Both storage engines are scaling really well on this test, so I'm limiting result graphs to 64 (HT) and 32 cores configurations only.
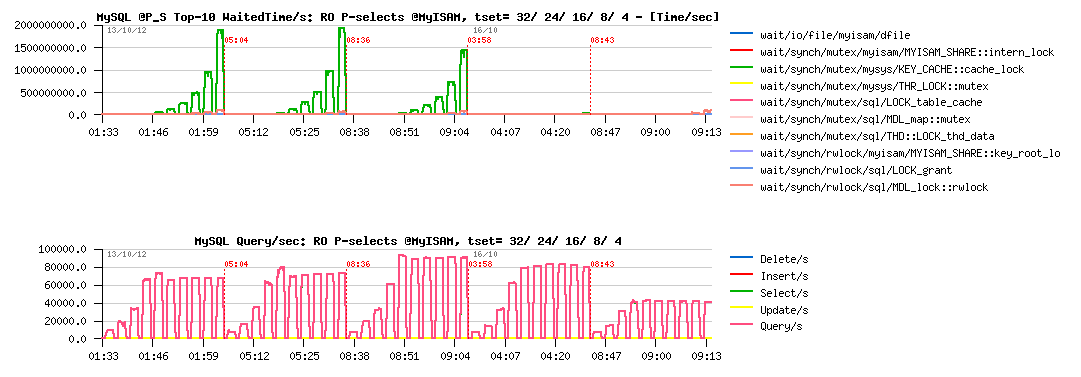
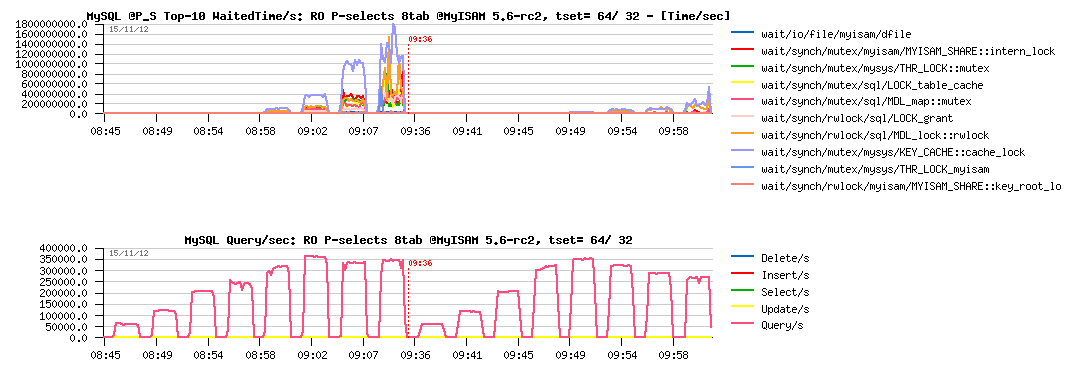
Let's get a look on MyISAM results on MySQL 5.6-rc1 :
Sysbench RO Point-Selects 8-tables @MyISAM 5.6-rc1 :
Observations :
- MyISAM is reaching 270K QPS max on this workload
- and starting to hit MDL-related contentions here!
While MySQL 5.6-rc2 already contains the first part of MDL optimizations ("metadata_locks_hash_instances"), and we may expect a better results now on workloads having MDL_map::mutex contention in the top position. So, let's see hot it helps MyISAM here.
Sysbench RO Point-Selects 8-tables @MyISAM 5.6-rc2 :
Observations :
- Wow! - 360K QPS max(!) - this is a very impressive difference :-)
- then key cache lock contention is blocking MyISAM from going more high..
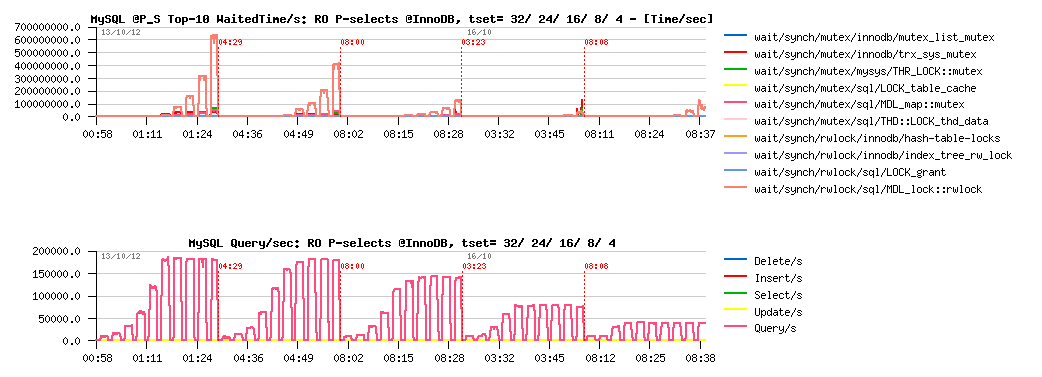
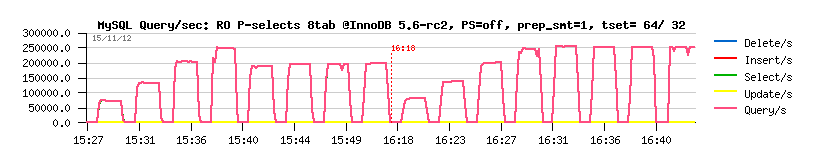
Then, what about InnoDB here?.. - the problem with InnoDB that even with getting a more light code path with READ ONLY transactions it'll still create/destroy read-view, and on such a workload with short and fast queries such an overhead will be seen very quickly:
Sysbench RO Point-Selects 8-tables @InnoDB 5.6-rc2 :
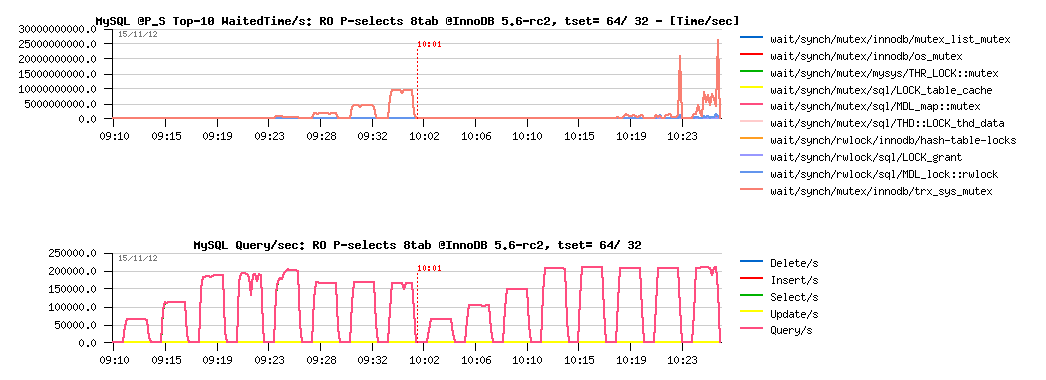
Observations :
- InnoDB is reaching only 210K QPS max on this workload
- the main bottleneck is coming from trx_sys::mutex contention (related to read-views)
- this contention is even making a QPS drop on 64 cores threads (HT), so the result is better on pure 32cores..
Such a contention is still possible to hide (yes, "hide", which is different from "fix" ;-)) -- we may try to use a bigger "innodb_spin_wait_delay" value. The changes can be applied live on a running system as the setting is dynamic. Let's try now innodb_spin_wait_delay=256 instead of 96 that I'm using usually :
Sysbench RO Point-Selects 8-tables @InnoDB 5.6-rc2 sd=256 :
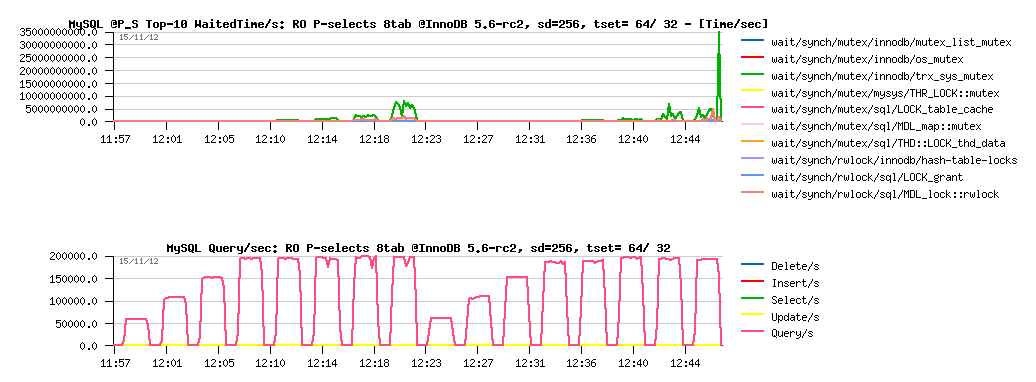
Observations :
- as you can see, the load is more stable now
- but we got a regression from 210K to 200K QPS..
So, a true fix for trx_sys mutex contention is really needing here to go more far. This work is in progress, so stay tuned ;-) Personally I'm expecting at least 400K QPS here on InnoDB or more (keeping in mind that MyISAM is going throw the same code path to communicate with MySQL server, having syscalls overhead on reading data from the FS cache, and still reaching 360K QPS ;-))
However, before to finish, let's see what are the max QPS numbers may be obtained on this server by reducing some overheads on internals:
- I'll disable Performance Schema instrumentation
- and use prepared statements to reduce SQL parser time..
Sysbench RO Point-Selects 8-tables @MyISAM 5.6-rc2 PFS=off prep_smt=1 :
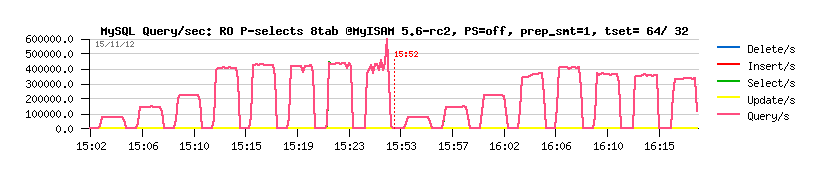
Sysbench RO Point-Selects 8-tables @InnoDB 5.6-rc2 PFS=off prep_smt=1 :
Observations :
- Wow! 430K (!) QPS max on MyISAM!...
- and 250K (!) QPS on InnoDB!
These results are great!.. - and both are coming due the great improvement made in MySQL 5.6 code.
(specially keeping in mind that just one year ago on the same server I was unable to get more than 100K QPS on InnoDB ;-))
While, anyway, I'm still willing to see something more better from InnoDB (even if I understand all these transactional related stuff constrains, and so on)..
So far, let me show you something ;-))
Starting from the latest MySQL 5.6 version, InnoDB has a "read-only" option -- to switch off all database writes globally for a whole InnoDB instance (innodb_read_only=1).. This option is working very similar to READ ONLY transactions today, while it should do much more better in the near future (because when we know there is no changes possible in the data, then any transaction related constraints may be ignored). And I think the READ ONLY transactions may yet work much more better than today too ;-))
Sunny is working hard on improvement of all this part of code, and currently we have a prototype which is giving us the following on the same workload :
Sysbench RO Point-Selects 8-tables @InnoDB 5.6-rc2-ro_patch PFS=off prep_smt=1 :
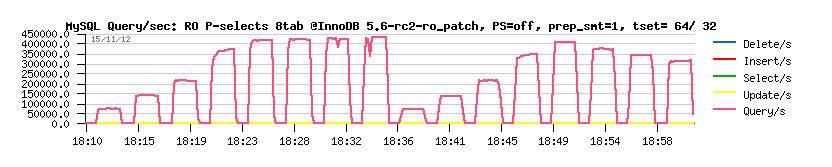
Observations :
- as you can see, we're rising 450K (!) QPS within the same test conditions!!! :-)
- and it's yet on an old 32cores bi-thread server..
- it reminds me the famous 750K QPS on "Handler Socket".. - as you see, we become more and more close to it ;-)
- and still passing by a normal SQL and keeping all other RDBMS benefits ;-)
- so, for all users hesitating to use MySQL or move to noSQL land.. - you'll yet be surprised by MySQL power ;-))
INSTEAD OF SUMMARY
- InnoDB seems to be today way faster on FTS than MyISAM
- on OLTP RO workloads InnoDB is also faster than MyISAM, except on point selects, but this gap should be removed too in the near future ;-)
- if you did not try MySQL 5.6 yet -- please, do! -- it's already great, but with your feedback will be yet better! ;-)
And what kind of performance difference you're observing in your workloads?..
Please, share!..
Monday, 05 November, 2012
MySQL Performance: Linux I/O and Fusion-IO, Part #2
This post is the following part #2 of the previous
one - in fact Vadim's comments bring me in some doubts about the
possible radical difference in implementation of AIO vs normal I/O in
Linux and filesystems. As well I've never used Sysbench for I/O testing
until now, and was curious to see it in action. From the previous tests
the main suspect point was about random writes (Wrnd) performance on a
single data file, so I'm focusing only on this case within the following
tests. On XFS performance issues started since 16 concurrent IO write
processes, so I'm limiting the test cases only to 1, 2, 4, 8 and 16
concurrent write threads (Sysbench is multi-threaded), and for AIO
writes seems 2 or 4 write threads may be more than enough as each thread
by default is managing 128 AIO write requests..
Few words about
Sysbench "fileio" test options :
- As already mentioned, it's multithreaded, so all the following tests were executed with 1, 2, 4, 8, 16 threads
- Single 128GB data file is used for all workloads
- Random write is used as workload option ("rndwr")
- It has "sync" and "async" mode options for file I/O, and optional "direct" flag to use O_DIRECT
- For "async" there is also a "backlog" parameter to say how many AIO requests should be managed by a single thread (default is 128, and what is InnoDB is using too)
So, lets try with "sync" + "direct" random writes first, just to check if I will observe the same things as in my previous tests with IObench before:
Sync I/O
Wrnd "sync"+"direct" with 4K block size:
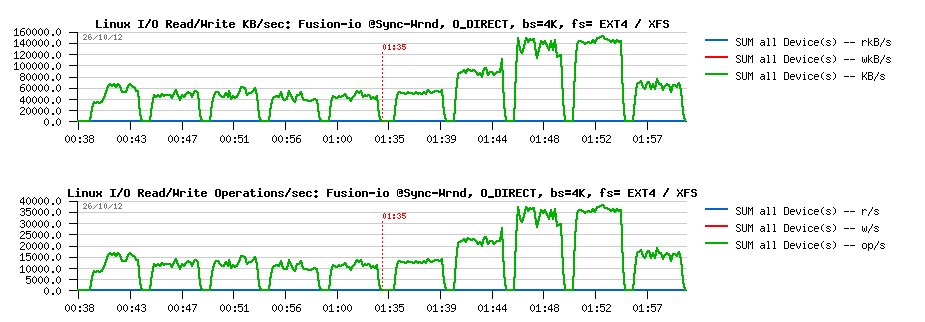
Observations :
- Ok, the result is looking very similar to before:
- EXT4 is blocked on the same write level for any number of concurrent threads (due IO serialization)
- while XFS is performing more than x2 times better, but getting a huge drop since 16 concurrent threads..
Wrnd "sync"+"direct" with 16K block size :
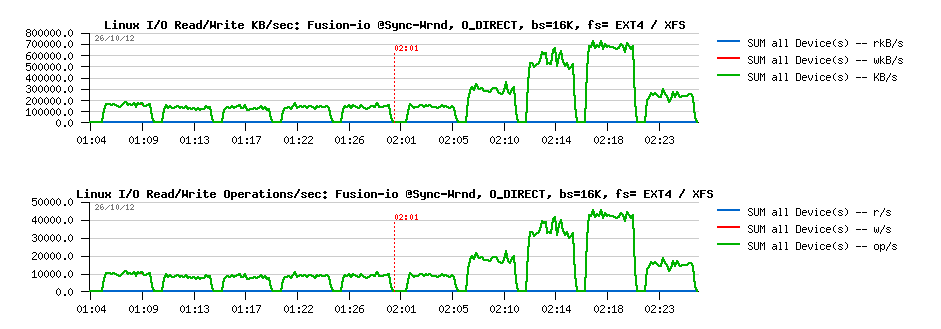
Observations :
- Same here, except that the difference in performance is reaching x4 times better result for XFS
- And similar drop since 16 threads..
However, things are changing radically when AIO is used ("async" instead of "sync").
Async I/O
Wrnd "async"+"direct" with 4K block size:
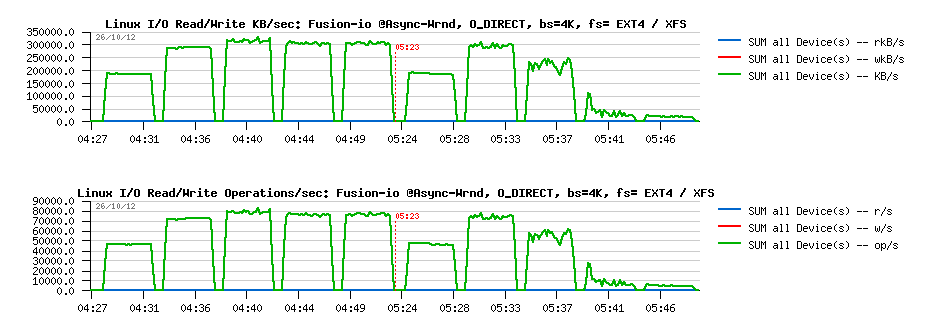
Observations :
- Max write performance is pretty the same for both file systems
- While EXT4 remains stable on all threads levels, and XFS is hitting a regression since 4 threads..
- Not too far from the RAW device performance observed before..
Wrnd "async"+"direct" with 16K block size:
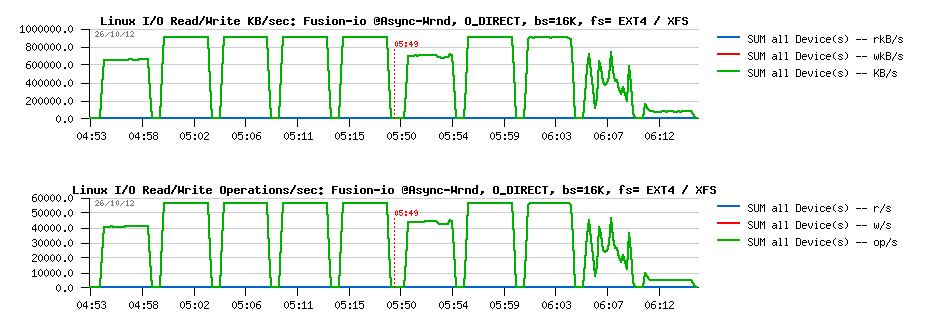
Observations :
- Pretty similar as with 4K results, except that regression on XFS is starting since 8 threads now..
- Both are not far now from the RAW device performance observed in previous tests
From all points of view, AIO write performance is looking way better! While I'm still surprised by a so spectacular transformation of EXT4.. - I have some doubts here if something within I/O processing is still not buffered within EXT4, even if the O_DIRECT flag is used. And if we'll read Linux doc about O_DIRECT implementation, we may see that O_SYNC should be used in addition to O_DIRECT to guarantee the synchronous write:
" O_DIRECT (Since Linux 2.4.10)Try to minimize cache effects of the I/O to and from this file. Ingeneral this will degrade performance, but it is useful in specialsituations, such as when applications do their own caching. File I/Ois done directly to/from user space buffers. The O_DIRECT flag on itsown makes at an effort to transfer data synchronously, but does notgive the guarantees of the O_SYNC that data and necessary metadata aretransferred. To guarantee synchronous I/O the O_SYNC must be used inaddition to O_DIRECT. See NOTES below for further discussion. "
(ref: http://www.kernel.org/doc/man-pages/online/pages/man2/open.2.html)
Sysbench is not opening file with O_SYNC when O_DIRECT is used ("direct" flag), so I've modified modified Sysbench code to get these changes, and then obtained the following results:
Async I/O : O_DIRECT + O_SYNC
Wrnd "async"+"direct"+O_SYNC with 4K block size:
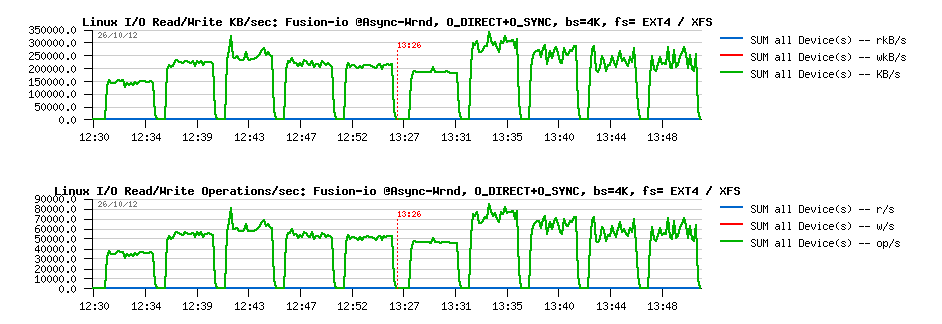
Observations :
- EXT4 performance become lower.. - 25% a cost for O_SYNC, hmm..
- while XFS surprisingly become more stable and don't have a huge drop observed before..
- as well, XFS is out performing EXT4 here, while we may still expect some better stability in results..
Wrnd "async"+"direct"+O_SYNC with 16K block size:
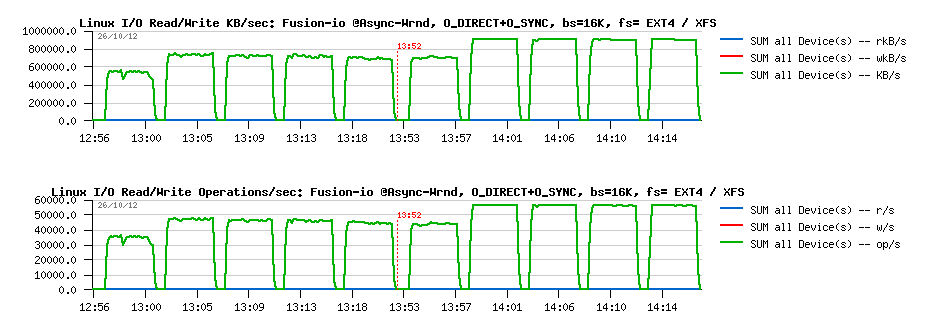
Observations :
- while with 16K block size, both filesystems showing rock stable performance levels
- but XFS is doing better here (over 15% better performance), and reaching its max performance without O_SYNC
I'm pretty curious what kind of changes are going within XFS code path when O_SYNC is used in AIO and why it "fixed" initially observed drops.. But seems to me for security reasons O_DIRECT should be used along with O_SYNC within InnoDB (and looking in the source code, seems it's not yet the case, or we should add something like O_DIRECT_SYNC for users who are willing to be more safe with Linux writes, similar to O_DIRECT_NO_FSYNC introduced in MySQL 5.6 for users who are not willing to enforce writes with additional fsync() calls)..
And at the end, specially for Mark Callaghan, a short graph with results on the same tests with 16K block size, but while the filesystem space is filled up to 80% (850GB from the whole 1TB space in Fusion-io flash card):
Wrnd AIO with 16K block size while 80% of space is filled :
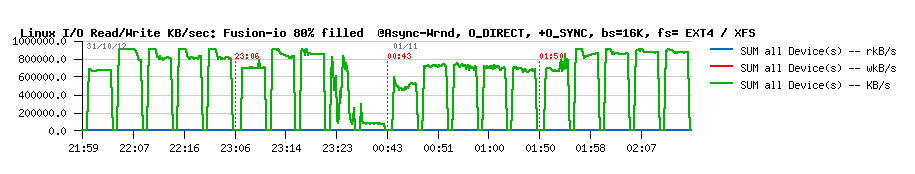
So, there is some regression on every test, indeed.. - but maybe not as big as we should maybe afraid. I've also tested the same with TRIM mount option, but did not get better. But well, to see these 10% regression we should yet see if MySQL/InnoDB will be able to reach these performance levels first ;-))
Time to a pure MySQL/InnoDB heavy RW test now..
Tuesday, 23 October, 2012
MySQL Performance: Linux I/O and Fusion-io
This article is following the previously
published investigation about I/O limitations on Linux and also
sharing my data from the steps in investigation of MySQL/InnoDB I/O
limitations within RW workloads..
So far, I've got in my hands a
server with a Fusion-io card and I'm expecting now to analyze more in
details the limits we're hitting within MySQL and InnoDB on heavy
Read+Write workloads. As the I/O limit from the HW level should be way
far due outstanding Fusion-io card performance, contentions within
MySQL/InnoDB code should be much more better visible now (at least I'm
expecting ;-))
But before to deploy on it any of MySQL test
workloads, I want to understand the I/O limits I'm hitting on the lower
levels (if any) - first on the card itself, and then on the filesystem
levels..
NOTE : in fact I'm not interested here in the
best possible "tuning" or "configuring" of the Fusion-io card itself --
I'm mainly interested in the any possible regression on the I/O
performance due adding other operational levels, and in the current
article my main concern is about a filesystem. The only thing I'm sure
in the current step is to not use CFQ I/O scheduler (see previous
results), but rather NOOP or DEADLINE instead ("deadline" was used
within all the following tests).
As in the previous I/O testing,
all the following test were made with IObench_v5 tool. The server I'm
using has 24cores (Intel Xeon E7530 @1.87GHz), 64GB RAM, running Oracle
Linux 6.2. From the filesystems In the current testing I'll compare only
two: EXT4 and XFS. EXT4 is claiming to have a lot of performance
improvements made over the past time, while XFS was the most popular
until now in the MySQL world (while in the recent tests made by Percona
I was surprised to see EXT4 too, and some other users are claiming to
observe a better performance with other FS too.. - the problem is that I
also have a limited time to satisfy my curiosity, that's why there are
only two filesystems tested for the moment, but you'll see it was
already enough ;-))
Then, regarding my I/O tests:
- I'm testing here probably the most worse case ;-)
- the worst case is when you have just one big data file within your RDBMS which become very hot in access..
- so for a "raw device" it'll be a 128GB raw segment
- while for a filesystem I'll use a single 128GB file (twice bigger than the available RAM)
- and of course all the I/O requests are completely random.. - yes, the worse scenario ;-)
- so I'm using the following workload scenarios: Random-Read (Rrnd), Random-Writes (Wrnd), Random-Read+Write (RWrnd)
- same series of test is executed first executed with I/O block size = 4KB (most common for SSD), then 16KB (InnoDB block size)
- the load is growing with 1, 4, 16, 64, 128, 256 concurrent IObench processes
-
for filesystem file acces options the following is tested:
- O_DIRECT (Direct) -- similar to InnoDB when files opened with O_DIRECT option
- fsync() -- similar to InnoDB default when fsync() is called after each write() on a given file descriptor
- both filesystems are mounted with the following options: noatime,nodiratime,nobarrier
Let's start with raw devices first.
RAW Device
By the very first view, I was pretty impressed by the Fusion-io card I've got in my hands: 0.1ms latency on an I/O operation is really good (other SSD drives that I have on the same server are showing 0.3 ms for ex.). However thing may be changes when the I/O load become more heavy..
Let's get a look on the Random-Read:
Random-Read, bs= 4K/16K :

Observations :
- left part of the graphs representing I/O levels with block size of 4K, and the right one - with 16K
- the first graph is representing I/O operations/sec seen by the application itself (IObench), while the second graph is representing the KBytes/sec traffic observed by OS on the storage device (currently Fusion-io card is used only)
- as you can see, with 4K block size we're out-passing 100K Reads/sec (and in peak even reaching 120K), and keeping 80K Reads/sec on a higher load (128, 256 parallel I/O requests)
- while with 16K the max I/O level is around of 35K Reads/sec, and it's kept less or more stable with a higher load too
- from the KB/s graph: seems with the 500MB/sec speed we're not far from the max I/O Random-Read level on this configuration..
Random-Write, bs= 4K/16K :
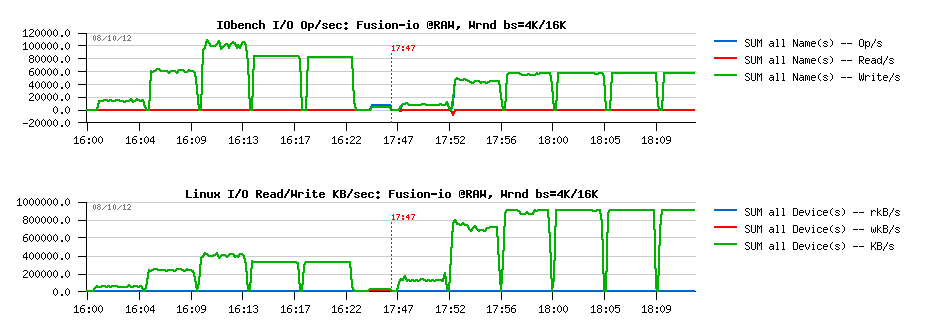
Observations :
- very similar to Random-Reads, but on 16K block size showing a twice better performance (60K Reads/s), while 100K is the peak on 4K
- and the max I/O Write KB/s level seems to be near 900MB/sec
- pretty impressive ;-)
Random-RW, bs= 4K/16K :

Observations :
- very interesting results: in this test case performance is constantly growing with a growing load!
- ~80K I/O Operations/sec (Random RW) for 4K block size, and 60K for 16K
- max I/O Level in throughput is near 1GB/sec..
Ok, so let's summarize now the max levels :
- Rrnd: 100K for 4K, 35K for 16K
- Wrnd: 100K for 4K, 60K for 16K
- RWrnd: 78K for 4K, 60K for 16K
So, what will change now once a filesystem level is added to the storage??..
EXT4
Random-Read, O_DIRECT, bs= 4K/16K :

Observations :
- while 30K Reads/sec are well present on 16K block size, we're yet very far from 100K max obtained with 4K on raw device..
- 500MB/s level is well reached on 16K, not on 4K..
- the FS block size is also 4K, and it's strange to see a regression from 100K to 70K Reads/sec on 4K block size..
While for Random-Read access it doesn't make sense to test "fsync() case" (the data will be fully or partially cached by the filesystem), but for Random-Write and Random-RW it'll be pretty important. So, that's why there are 4 cases represented on each graph containing Write test:
- O_DIRECT with 4K block size
- fsync() with 4K block size
- O_DIRECT with 16K block size
- fsync() with 16K block size
Random-Write, O_DIRECT/fsync bs= 4K/16K :

Observations :
- EXT4 performance here is very surprising..
- 15K Writes/s max on O_DIRECT with 4K, and 10K with 16K (instead of 100K / 60K observed on raw device)..
- fsync() test results are looking better, but still very poor comparing to the real storage capacity..
- in my previous tests I've observed the same tendency: O_DIRECT on EXT4 was slower than write()+fsync()
Looks like internal serialization is still taking place within EXT4. And the profiling output to compare why there is no performance increase on going from 4 I/O processes to 16 is giving the following:
EXT4, 4proc, 4KB, Wrnd: 12K-14K writes/sec :

             samples  pcnt function                                                            DSO
             _______ _____ ___________________________________________________________________ ______________

             1979.00 14.3% intel_idle                                                          [kernel]
             1530.00 11.1% __ticket_spin_lock                                                  [kernel]
             1024.00  7.4% ifio_8f406.db9914f4ba64991d41d2470250b4d3fb4c6.3.1.5.126            [iomemory_vsl]
              696.00  5.0% native_write_cr0                                                    [kernel]
              513.00  3.7% ifio_strerror                                                       [iomemory_vsl]
              482.00  3.5% native_write_msr_safe                                               [kernel]
              444.00  3.2% kfio_destroy_disk                                                   [iomemory_vsl]
...


             samples  pcnt function                                                            DSO
             _______ _____ ___________________________________________________________________ ______________

              844.00 12.2% intel_idle                                                          [kernel]
              677.00  9.8% ifio_8f406.db9914f4ba64991d41d2470250b4d3fb4c6.3.1.5.126            [iomemory_vsl]
              472.00  6.9% __ticket_spin_lock                                                  [kernel]
              264.00  3.8% ifio_strerror                                                       [iomemory_vsl]
              254.00  3.7% native_write_msr_safe                                               [kernel]
              250.00  3.6% kfio_destroy_disk                                                   [iomemory_vsl]


EXT4, 16proc, 4KB, Wrnd: 12K-14K writes/sec :

             samples  pcnt function                                                            DSO
             _______ _____ ___________________________________________________________________ ______________

             1600.00 16.1% intel_idle                                                          [kernel]
              820.00  8.3% ifio_8f406.db9914f4ba64991d41d2470250b4d3fb4c6.3.1.5.126            [iomemory_vsl]
              639.00  6.4% __ticket_spin_lock                                                  [kernel]
              543.00  5.5% native_write_cr0                                                    [kernel]
              358.00  3.6% kfio_destroy_disk                                                   [iomemory_vsl]
              351.00  3.5% ifio_strerror                                                       [iomemory_vsl]
              343.00  3.5% native_write_msr_safe                                               [kernel]
Looks like there is no difference between two cases, and EXT4 is just going on its own speed.
Random-RW, O_DIRECT/fsync, bs= 4K/16K :

Observations :
- same situation on RWrnd too..
- write()+fsync() performs better than O_DIRECT
- performance is far from "raw device" levels..
XFS
Random-Read O_DIRECT bs= 4K/16K :

Observations :
- Rrnd on XFS O_DIRECT is pretty not far from raw device performance
- on 16K block size there seems to be a random issue (performance did not increase on the beginning, then jumped to 30K Reads.sec -- as the grow up happen in the middle of a test case (64 processes), it makes me thing the issue is random..
However, the Wrnd results on XFS is a completely different story:
Random-Write O_DIRECT/fsync bs= 4K/16K :

Observations :
- well, as I've observed on my previous tests, O_DIRECT is faster on XFS vs write()+fsync()..
- however, the most strange is looking a jump on 4 concurrent I/O processes following by a full regression since the number of processes become 16..
- and then a complete performance regression.. (giving impression that no more than 4 concurrent writes are allowed on a single file.. - hard to believe, but there is for sure something is going odd ;-))
From the profiler output looking on the difference between 4 and 16 I/O processes we may see that XFS is hitting a huge lock contention where the code is spinning around the lock and the __ticket_spin_lock() function become the top hot on CPU time:
XFS, 4proc, 4KB, Wrnd: ~40K writes/sec :

             samples  pcnt function                                                            DSO
             _______ _____ ___________________________________________________________________ ______________

             3205.00 11.3% ifio_8f406.db9914f4ba64991d41d2470250b4d3fb4c6.3.1.5.126            [iomemory_vsl]
             2217.00  7.8% __ticket_spin_lock                                                  [kernel]
             2105.00  7.4% intel_idle                                                          [kernel]
             1288.00  4.6% kfio_destroy_disk                                                   [iomemory_vsl]
             1092.00  3.9% ifio_strerror                                                       [iomemory_vsl]
              857.00  3.0% ifio_03dd6.e91899f4801ca56ff1d79005957a9c0b93c.3.1.5.126            [iomemory_vsl]
              694.00  2.5% native_write_msr_safe                                               [kernel]
.....
             samples  pcnt function                                                            DSO
             _______ _____ ___________________________________________________________________ ______________

             5022.00 10.7% ifio_8f406.db9914f4ba64991d41d2470250b4d3fb4c6.3.1.5.126            [iomemory_vsl]
             4166.00  8.9% intel_idle                                                          [kernel]
             3298.00  7.0% __ticket_spin_lock                                                  [kernel]
             1938.00  4.1% kfio_destroy_disk                                                   [iomemory_vsl]
             1378.00  2.9% native_write_msr_safe                                               [kernel]
             1323.00  2.8% ifio_strerror                                                       [iomemory_vsl]
             1210.00  2.6% ifio_03dd6.e91899f4801ca56ff1d79005957a9c0b93c.3.1.5.126            [iomemory_vsl]


XFS, 16proc, 4KB, Wrnd: 12K writes/sec :

             samples  pcnt function                                                            DSO
             _______ _____ ___________________________________________________________________ ______________

            96576.00 56.8% __ticket_spin_lock                                                  [kernel]
            17935.00 10.5% intel_idle                                                          [kernel]
             6000.00  3.5% native_write_msr_safe                                               [kernel]
             5182.00  3.0% find_busiest_group                                                  [kernel]
             2325.00  1.4% native_write_cr0                                                    [kernel]
             2239.00  1.3% ifio_8f406.db9914f4ba64991d41d2470250b4d3fb4c6.3.1.5.126            [iomemory_vsl]
             2052.00  1.2% __schedule                                                          [kernel]
              972.00  0.6% cpumask_next_and                                                    [kernel]
              958.00  0.6% kfio_destroy_disk                                                   [iomemory_vsl]
              952.00  0.6% find_next_bit                                                       [kernel]
              898.00  0.5% load_balance                                                        [kernel]
              705.00  0.4% ifio_strerror                                                       [iomemory_vsl]
              679.00  0.4% ifio_03dd6.e91899f4801ca56ff1d79005957a9c0b93c.3.1.5.126            [iomemory_vsl]
              666.00  0.4% __ticket_spin_unlock                                                [kernel]
I did not find any info if there is any way to tune or to limit spin locks around XFS (while it can be on some kernel level as well, and not be related to XFS..)
And situations with RWrnd is not too much different:
Random-RW O_DIRECT/fsync bs= 4K/16K :

Observations :
- O_DIRECT is still better on XFS vs write()+sync()
- RWrnd performance is far from the storage capacities, and at least observed on a raw device
So, looking on all these EXT4 and XFS test results -- it's clear that if in MySQL/InnoDB you have OLTP RW workload which mostly hot on a one particular table (means a single data file if table has no partitions), then regardless all internal contentions you'll already need to resolve within MySQL/InnoDB code, there will be yet a huge limitation coming on the I/O level from the filesystem layer!..
Looks like having a hot access on a single data file should be avoid whenever possible ;-)
TEST with 8 data files
Let's see now if instead of one single 128GB data file, the load will be distributed between 8 files, 16GB in size each. Don't think any comments are needing for the following test results.
You'll see that:
- having 8 files brings FS performance very close the the RAW device level
- XFS is still performing better than EXT4
- having O_DIRECT gives a better results than write()+fsync()
EXT4
Random-Read O_DIRECT bs= 4K/16K :

Random-Write O_DIRECT/fsync bs= 4K/16K :
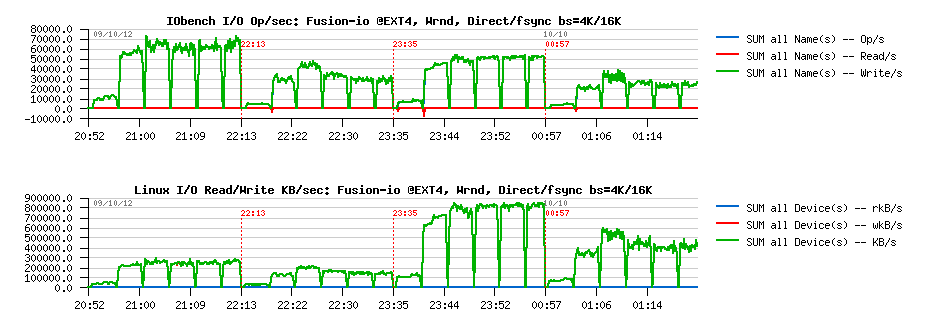
Random-RW O_DIRECT/fsync bs= 4K/16K :

XFS
Random-Read O_DIRECT bs= 4K/16K :

Random-Write O_DIRECT/fsync bs= 4K/16K :

Random-RW O_DIRECT/fsync bs= 4K/16K :

IMPACT of data file numbers
With 8 data files we're reaching very closely the RAW device performance on write I/O operations, and O_DIRECT option seems to be the must for both EXT4 and XFS filesystems. Let's see now if performance is already better with 2 or 4 data files.
EXT4 : Random-Write O_DIRECT bs=4K data files= 1/ 2/ 4

Observations :
- confirming once more a true serialization on a file access: each result is near twice as better as the previous one without any difference in results with a growing number of concurrent I/O processes..
- so, nothing surprising performance is yet better with 8 data files
EXT4 : Random-Write O_DIRECT bs=16K data files= 1/ 2/ 4

Observations :
- same tendency as with 4K block size
XFS : Random-Write O_DIRECT bs=4K data files= 1/ 2/ 4

Observations :
- only since 4 data files there is no more performance drop since 64 concurrent I/O processes..
- and having 4 files is still not enough to reach RAW performance of the same storage device here
- while it's way better than EXT4..
XFS : Random-Write O_DIRECT bs=16K data files= 1/ 2/ 4

Observations :
- for 16K block size having 4 data files becomes enough
- on 2 files there is a strange jump on 256 concurrent processes..
- but well, with 4 files it looks pretty similar to 8, and seems to be the minimal number of hot files to have to reach RAW performance..
- and near x1.5 times better performance than EXT4 too..
INSTEAD OF SUMMARY
Seems to reach the max I/O performance from your MySQL/InnoDB database on a flash storage you have to check for the following:
-
your data are placed on XFS filesystem (mounted with
"noatime,nodiratime,nobarrier" options) and your storage device is
managed by "noop" or "deadline" I/O scheduler (see previous tests for
details)
-
you're using O_DIRECT within your InnoDB config (don't know yet if
using 4K page size will really bring some improvement over 16K as
there will be x4 times more pages to manage within the same memory
space, which may require x4 times more lock events and other
overheads.. - while in term of Writes/sec potential performance the
difference is not so big! - from the presented test results in most
cases it's only 80K vs 60K writes/sec -- but of course a real result
from a real database workload will be better ;-))
- and, finally, be sure your write activity is not focused on a single data file! - they should at last be more or equal than 4 to be sure your performance is not lowered from the beginning by the filesystem layer!
To be continued...
Any comments are welcome!
Friday, 06 January, 2012
MySQL Performance: Linux I/O
It was a long time now that I wanted to run some benchmark tests to
understand better the surprises I've met in the past with Linux I/O
performance during MySQL benchmarks, and finally it happened last year,
but I was able to organize and present my results only now..
My
main questions were:
- what is so different with various I/O schedulers in Linux (cfq, noop, deadline) ?..
- what is wrong or right with O_DIRECT on Linux ?..
- what is making XFS more attractive comparing to EXT3/EXT4 ?..
There were already several posts in the past about impact on MySQL performance when one or another Linux I/O layer feature was used (for ex. Domas about I/O schedulers, Vadim regarding TPCC-like performance, and many other) - but I still did not find any answer WHY (for ex.) cfq I/O scheduler is worse than noop, etc, etc..
So, I'd like to share here some answers to my WHY questions ;-))
(while for today I still have more questions than answers ;-))
Test Platform
First of all, the system I've used for my tests:
- HW server: 64 cores (Intel), 128GB RAM, running RHEL 5.5
- the kernel is 2.6.18 - as it was until now the most common Linux kernel used on Linux boxes hosting MySQL servers
- installed filesystems: ext3, ext4, XFS
- Storage: ST6140 (1TB on x16 HDD striped in RAID0, 4GB cache on controller) - not a monster, but fast enough to see if the bottleneck is coming from the storage level or not ;-))
Test Plan
Then, my initial test plan:
- see what the max possible Read/Write I/O performance I can obtain from the given HW on the raw level (just RAW-devices, without any filesystem, etc.) - mainly I'm interested here on the impact of Linux I/O scheduler
- then, based on observed results, setup more optimally each filesystem (ext3, ext4, XFS) and try to understand their bottlenecks..
- I/O workload: I'm mainly focusing here on the random reads and random writes - they are the most problematic for any I/O related performance (and particularly painful for databases), while sequential read/writes may be very well optimized on the HW level already and hide any other problems you have..
- Test Tool: I'm using here my IObench tool (at least I know exactly what it's doing ;-))
TESTING RAW DEVICES
Implementation of raw devices in Linux is quite surprising.. - it's simply involving O_DIRECT access to a block device. So to use a disk in raw mode you have to open() it with O_DIRECT option (or use "raw" command which will create an alias device in your system which will always use O_DIRECT flag on any involved open() system call). Using O_DIRECT flag on a file opening is disabling any I/O buffering on such a file (or device, as device is also a file in UNIX ;-) - NOTE: by default all I/O requests on block devices (e.g. hard disk) in Linux are buffered, so if you'll start a kind of I/O write test on, say, your /dev/sda1 - you'll obtain a kind of incredible great performance ;-)) as no data probably will not yet even reach your storage and in reality you'll simply test a speed of your RAM.. ;-))
Now, what is "fun" with O_DIRECT:
- all your I/O requests (read, write, etc.) block size should be aligned to 512 bytes (e.g. be multiplier of 512 bytes), otherwise your I/O request is simply rejected and you get an error message.. - and regarding to RAW devices it's quite surprising comparing to Solaris for ex. where you're simply instead of /dev/dsk/device using /dev/rdsk/device and may use any block size you want..
- but it's not all.. - the buffer you're using within your system call involving I/O request should also be allocated aligned to 512 bytes, so mainly you have to allocate it via posix_memalign() function, otherwise you'll also get an error.. (seems that during O_DIRECT operations there is used some kind of direct memory mapping)
- then, reading the manual: "The O_DIRECT flag on its own makes at an effort to transfer data synchronously, but does not give the guarantees of the O_SYNC that data and necessary metadata are transferred. To guarantee synchronous I/O the O_SYNC must be used in addition to O_DIRECT" - quite surprising again..
- and, finally, you'll be unable to use O_DIRECT within your C code until you did not declare #define _GNU_SOURCE
Interesting that the man page is also quoting Linus about O_DIRECT:
"The thing that has always disturbed me about O_DIRECT is that the whole interface is just stupid, and was probably designed by a deranged monkey on some serious mind-controlling substances." Linus
But we have to live with it ;-))
And if you need an example of C or C++ code, instead to show you the mine, there is a great dev page on Fusion-io site.
So far, what about my storage performance on the RAW devices now?..
Test scenario on RAW devices:
- I/O Schedulers: cfq, noop, deadline
- Block size: 1K, 4K, 16K
- Workload: Random Read, Random Write
NOTE: I'm using here 1K block size as the smallest "useful" size for databases :-)) then 4K as the most aligned to the Linux page size (4K), and 16K - as the default InnoDB block size until now.
Following graphs are representing 9 tests executed one after one: cfq with 3 different block sizes (1K, 4K, 16K), then noop, then deadline. Each test is running a growing workload of 1, 4, 16, 64 concurrent users (processes) non-stop bombarding my storage subsystem with I/O requests.
Read-Only@RAW-device:
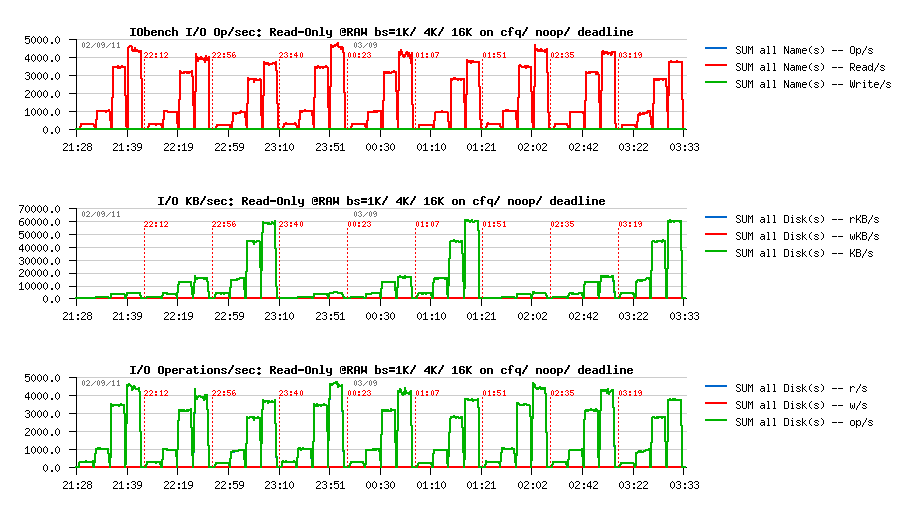
Observations :
- Random Read is scaling well for all Linux I/O Schedulers
- Reads reported by application (IObench) are matching numbers reported by the system I/O stats
- 1K reads are running slightly faster than 4K (as expected as it's a "normal" disks, and transfer of a bigger data volume reducing an overall performance, which is normal)..
Write-Only @RAW-device:

Observations :
- looking on the graph you may easily understand now what is wrong with "cfq" I/O scheduler.. - it's serializing write operations!
- while "noop" and "deadline" are continuing to scale with a growing workload..
- so, it's clear now WHY performance gains were observed by many people on MySQL workloads by simply switching from "cfq" to "noop" or "deadline"
To check which I/O scheduler is used for your storage device:
# cat /sys/block/{DEVICE-NAME}/queue/scheduler
For ex. for "sda": # cat /sys/block/sda/queue/scheduler
Then set "deadline" for "sda": # echo deadline > /sys/block/sda/queue/scheduler
To set "deadline" as default I/ scheduler for all your storage devices you may boot your system with "elevator=deadline" boot option. Interesting that by default many Linux systems used "cfq". All recent Oracle Linux systems are shipped with "deadline" by default.
TESTING FILESYSTEMS
As you understand, there is no more reasons to continue any further tests by using "cfq" I/O scheduler.. - if on the raw level it's already bad, it cannot be better due any filesystem features ;-)) (While I was also told that in recent Linux kernels "cfq" I/O scheduler should perform much more better, let's see)..
Anyway, my filesystem test scenario:
- Linux I/O Scheduler: deadline
- Filesystems: ext3, ext4, XFS
- File flags/options: osync (O_SYNC), direct (O_DIRECT), fsync (fsync() is involved after each write()), fdatasync (same as fsync, but calling fdatasync() instead of fsync())
- Block size: 1k, 4K, 16K
- Workloads: Random Reads, Random Writes on a single 128GB file - it's the most critical file access for any database (having a hot table, or a hot tablespace)
- NOTE: to avoid most of background effects of caching, I've limited an available RAM for FS cache to 8GB only! (all other RAM was allocated to the huge SHM segment with huge pages, so not swappable)..
Also, we have to keep in mind now the highest I/O levels observed on RAW devices:
- Random Read: ~4500 op/sec
- Random Write: ~5000 op/sec
So, if for any reason Read or Write performance will be faster on any of filesystems - it'll be clear there is some buffering/caching happening on the SW level ;-))
Now, let me explain what you'll see on the following graphs:
- they are already too many, so I've tried to bring more data on each graph :-))
- there are 12 tests on each graph (x3 series of x4 tests)
- each serie of tests is executed by using the same block size (1K, then 4K, then 16K)
- within a serie of 4 tests there are 4 flags/options are used one after one (osync, direct, fsync, fdatasync)
- each test is executed as before with 1, 4, 16, 64 concurrent user processes (IObench)
- only one filesystem per graph :-))
So, let's start now with Read-Only results.
Read-Only @EXT3:

Observations :
- pretty well scaling, reaching 4500 reads/sec in max
- on 1K reads: only "direct" reads are really reading 1K blocks, all other options are involving reading of 4K blocks
- nothing unexpected finally :-)
Read-Only @EXT4:

Observations :
- same as on ext3, nothing unexpected
Read-Only @XFS:

Observations :
- no surprise here either..
- but there were one surprise anyway ;-))
While the results on Random Read workloads are looking exactly the same on all 3 filesystems, there are still some difference in how the O_DIRECT feature is implemented on them! ;-))
The following graphs are representing the same tests, but only corresponding to execution with O_DIRECT flag (direct). First 3 tests are with EXT3, then 3 with XFS, then 3 with EXT4:
Direct I/O & Direct I/O

Observations :
- the most important here the last graph showing here the memory usage on the system during O_DIRECT tests
- as you may see, only with XFS the filesystem cache usage is near zero!
- while EXT3 and EXT4 are still continuing cache buffering.. - may be a very painful surprise when you're expecting to use this RAM for something else ;-))
Well, let's see now what is different on the Write Performance.
Write-Only @EXT3:

Observations :
- the most worse performance here is with 1K blocks.. - as default EXT3 block size is 4K, on the 1K writes it involves a read-on-write (it has to read 4K block first, then change corresponding 1K on changes within it, and then write the 4K block back with applied changes..)
- read-on-write is not happening on 1K when O_DIRECT flag is used: we're really writing 1K here
- however, O_DIRECT writes are not scaling at all on EXT3! - and it explains me finally WHY I've always got a worse performance when tried to use O_DIRECT flush option in InnoDB on EXT3 filesystem! ;-))
- interesting that the highest performance here is obtained with O_SYNC flag, and we're not far from 5000 writes/sec for what the storage is capable..
Write-Only @EXT4:

Observations :
- similar to EXT3, but performance is worse comparing to EXT3
- interesting that only with O_SYNC flag the performance is comparable with EXT3, while in all other cases it's simply worse..
- I may suppose here that EXT3 is not flushing on every fsync() or fdatasync(), and that's why it's performing better with these options ;-)) need to investigate here.. But anyway, the result is the result..
What about XFS?..
Write-Only @XFS:

Observations :
- XFS results are quite different from those of EXT3 and EXT4
- I've used a default setup of XFS here, and was curios to not observe the impact of missed "nobarrier" option which was reported by Vadim in the past..
- on 1K block writes only O_DIRECT is working well, but in difference from EXT3/EXT4 it's also scaling ;-) (other options are giving poor results due the same read-on-write issue..)
- 4K block writes are scaling well with O_SYNC and O_DIRECT, but still remaining poor with other options
- 16K writes are reporting some anomalies: while with O_SYNC nothing is going wrong and it's scaling well, with O_DIRECT there is some kind of serialization happened on 4 and 16 concurrent user processes.. - and then on 64 users things then came back to the normal.. Interesting that is was not observed with 4K block writes.. Which remains me the last year discussion about page block size in InnoDB for SSD, and the gain reported by using 4K page size vs 16K.. - just keep in mind that sometimes it may be not related to SSD at all, but just to some filesystem's internals ;-))
- anyway, no doubt - if you have to use O_DIRECT in your MySQL server - use XFS! :-)
Now, what is the difference between a "default" XFS configuration and "tuned" ??..
I've recreated XFS with 64MB log size and mounted with following options:
# mount -t xfs -o noatime,nodiratime,nobarrier,logbufs=8,logbsize=32k
The results are following..
Write-Only @XFS-tuned:

Observations :
- everything is similar to "default" config, except that there is no more problem with 16K block size performance
- and probably this 16K anomaly observed before is something random, hard to say.. - but at least I saw it, so cannot ignore ;-))
Then, keeping in mind that XFS is so well performing on 1K block size, I was curious to see if thing will not go even better if I'll create my XFS filesystem with 1K block size instead of default 4K..
Write-Only @XFS-1K:

Observations :
- when XFS is created with 1K block size there is no more read-on-write issue on 1K writes..
- and we're really writing 1K..
- however, the performance is completely poor.. even on 1K writes with O_DIRECT !!!
- why?..
The answer is came from the Random Reads test on the same XFS, created with 1K block size.
Read-Only @XFS-1K:

Observations :
- if you followed me until now, you'll understand everything from the last graph, reporting RAM usage.. ;-))
- the previously 8GB free RAM is no more free here..
- so, XFS is not using O_DIRECT here!
- and you may see also that for all reads except O_DIRECT, it's reading 4K for every 1K, which is abnormal..
Instead of SUMMARY
- I'd say the main point here is - "test your I/O subsystem performance before to deploy your MySQL server" ;-))
- avoid to use "cfq" I/O scheduler :-)
- if you've decided to use O_DIRECT flush method in your MySQL server - deploy your data on XFS..
- seems to me the main reason why people are using O_DIRECT with MySQL it's a willing to avoid to deal with various issues of filesystem cache.. - and there is probably something needs to be improved in the Linux kernel, no? ;-)
- could be very interesting to see similar test results on the other filesystems too..
- things may look better with a newer Linux kernel..
So far, I've got some answers to my WHY questions.. Will be fine now to get a time to test it directly with MySQL ;-)
Any comments are welcome!
Rgds,
-Dimitri
Sunday, 19 September, 2010
MySQL Performance: 5.5 Notes..
Since 5.5 is announced as Release Candidate now, I'll not compare it with 5.1 anymore - I think there was written enough about the performance gain even since introduction of 5.4 :-)
From the other side, we want to be sure that the final 5.5 will be at least as good as 5.5.4 release, and here the feedback from real users with real workloads will be very precious! So, please, don't keep quiet! :-))
After that, few notes while testing MySQL 5.5 on dbSTRESS and points for discussions..
Buffer Pool and Purge
Last month I've got some time to focus on the Buffer Pool pages management I've observed many months before with older MySQL/InnoDB versions, and now was curious if I'll reproduce the same issue with MySQL 5.5.4 too...
Few words about the tested workload:
- still dbSTRESS ;-)
- but "light" scenario which may be very common for many web servers: there are only SELECT and UPDATE statements generated during the workload (WRITE transactions are selected as UPDATE-only during scenario generation)
- UPDATE queries are not modifying any indexes and not increasing any data in size, so all UPDATE(s) are changing all data in place
- READ transactions are composed of 2 SELECT statements: first id "light", the second is "heavier", but both are joins of two tables by primary or secondary key
- no "think time" between transactions, so every user session is bombarding the database non-stop with SELECT(s) and UPDATE(s)
- 32 users (sessions) are running in parallel
- the response time of all queries is reported live by the workload (SEL1, SEL2, UPD), as well the reached TPS level too
- the READ/WRITE ratio may changed according scenario, I've focused here on RW=0 (Read-only) and RW=1 (Read+Write, one READ per each WRITE, means two SELECT per UPDATE (SEL1 + SEL2 per each UPD))
What I observed before is that even if every UPDATE is changing data in place, there is a continuous decrease of the free space in the buffer pool! - and over a time all the space is used by something else rather useful data, etc.. - means probably "useful data" are leaving the cache and filled by old page images, etc.
So far - yes, I've reproduced the same problem again and with MySQL 5.5.4 - and you may read all details about in the Buffer Pool and Purge report. But to make it short: it's once again about InnoDB purge - if purge is unable to follow your workload activity you may have many problems, and this problem is one of them :-))
I did not really think to publish this report before I have a detailed in depth explanation about everything is going on.. - But several things happened during this time:
- First of all, InnoDB Team came with so promising ideas about improvements in the page management that it made me regretting 5.5 is become RC and no new features may be included until 5.6 now :-))
- And second - sometimes the solution is also coming "by surprise" from somewhere you even not expected ;-))
Let me speak about the Linux kernel :-))
Linux Kernel impact
By some chance there was a change of the Linux kernel on the same server I've used before. By lack of chance I cannot say you what was the old kernel (I may just suppose if was newer than the current one).. - But at least I may say that the current one is: 2.6.32.21-166.fc12.x86_64 :-))
The changes came when moved to this kernel:
- No more problems with Buffer Pool on the same workload up to 128 users! - purge is working just fine :-) (probably related to a better process scheduling on a multi-core machine?)
- Curiously 32 cores configuration shows even slightly better result comparing to 16 cores (NOTE: each core has also 2 threads, so Linux is seeing 64 vcpu) - before on 32 cores the result was always slightly worse..
So my questions here:
- Which Linux do you use in your production and why?..
- Which kernel version you're keeping on your production server and why?..
I think sharing this information will help to focus on the right MySQL issues and combine best practice for every users :-)
Here is a small graph commenting my observations.
Performance on 32/ 16/ 8/ 4/ 2 cores
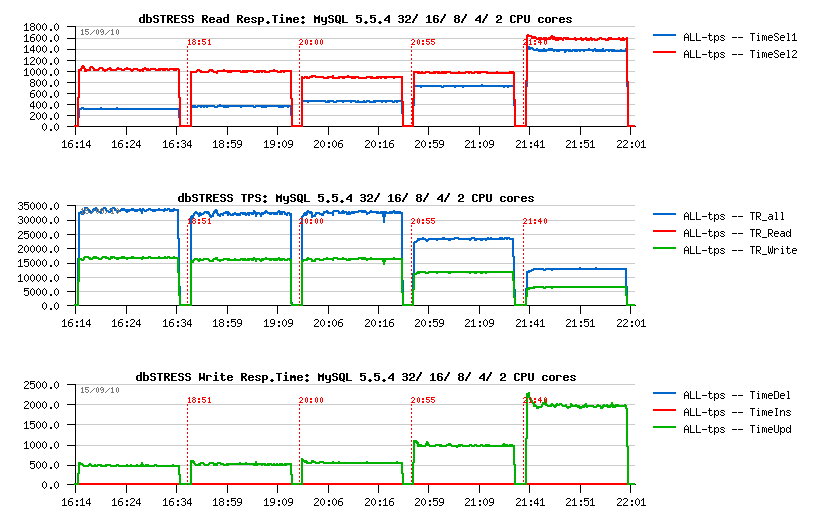
Comparing 5.5.4 and 5.5.6: flushing
There were many discussions about dirty pages flushing in 5.5 since UC2010 in April.. - On some workloads the flushing was too aggressive.. On some not aggressive enough..
Well, the 5.5.6 is came with a more "relaxed" (less aggressive) flushing which will depends a lot on your workload. And probably in many cases it'll be just fine..
On dbSTRESS, curiously, if 5.5.4 was too aggressive, then 5.5.6 seems to be too relaxed :-)
As you can see on the following graph, the 5.5.6 may miss a performance stability on the aggressive workload (like dbSTRESS):
Flushing on 5.5.4 vs 5.5.6:
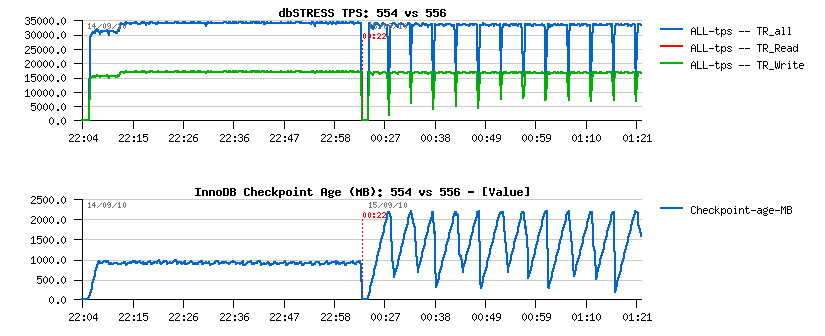
Observations:
- On the left part is 5.5.4, on the right: 5.5.6
- the 5.5.4 flushing is quite aggressive and even don't leave REDO logs to be filled more than 50% (see on Checkpoint Age courve)
- the 5.5.6 flushing is more relaxed and not flush enough, so the REDO may become out of free space, then a furious flushing is involved and bring a performance drop..
To recognize if you meet such an issue you have to monitor your Checkpoint Age in parallel with your workload activity - and if Checkpoint Age drops are corresponding to your activity drops + I/O write activity spikes = probably you're here ;-)
Again, think to report your problem! - it'll make the final release way better! :-)
Well, it was aggressive, but in memory workload.. - Let's see later what changes when the workload is IO-bound ;-))
Comparing 5.5.6 vs 5.5.6: compiling
Usually I'm compiling myself my MySQL binaries for testing, but now was curious if there any difference in performance between an "official" binary and compiled from the sources:
- Well, you may still win some 10% in performance by compiling a "light" version :-)
- For ex.: I'm using only "myisam,innodb,partition" engines list, which gives me a small (less 10MB) binary..
- Then in some cases compiling it with "tcmalloc" gives another boost (you may check its impact also by using tcmalloc via LD_PRELOAD)
The following graph is representing observed differences:
- from the left to the right: 5.5.6 from sources, 5.5.6 official binary, 5.5.4 from sources
- as you can see, avg TPS level of the 556-src is slightly higher comparing to 556-bin
- on the same time the binary version shows lower depth in performance drops..
5.5.6-src vs 5.5.6-bin:
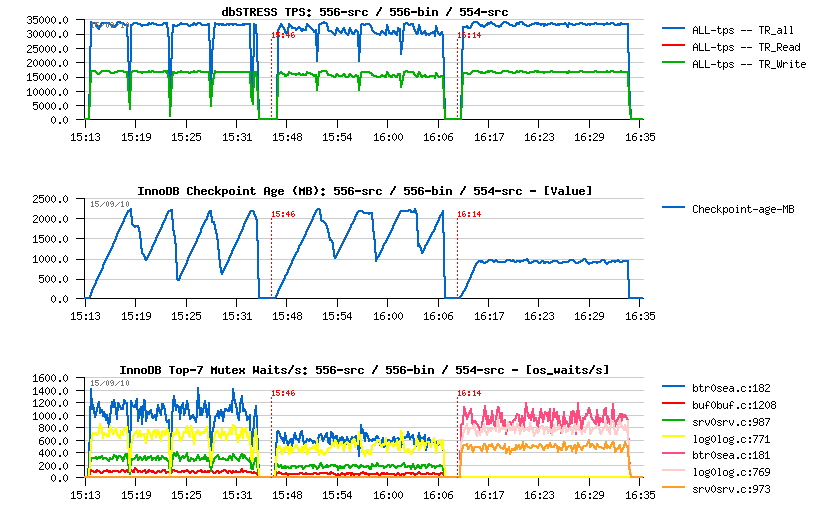
Comparing 5.5.4 and 5.5.6: scalability
What is interesting, that on the same workload 5.5.6 is keeping better the higher workload comparing to 5.5.4
dbSTRESS scenario :
- users: 1, 2, 4, .. 256
- Read/Write ratio: 1
- think time: 0
- WRITE: UPDATE-only
my.conf settings :
- innodb_thread_concurrency=0
- innodb_purge_threads=1
- ...
As you can see from the following graph, 5.5.6 is giving a higher TPS on 64, 128 and 256 users (observed on the better response time as well):
MySQL 5.5.6 scalability:
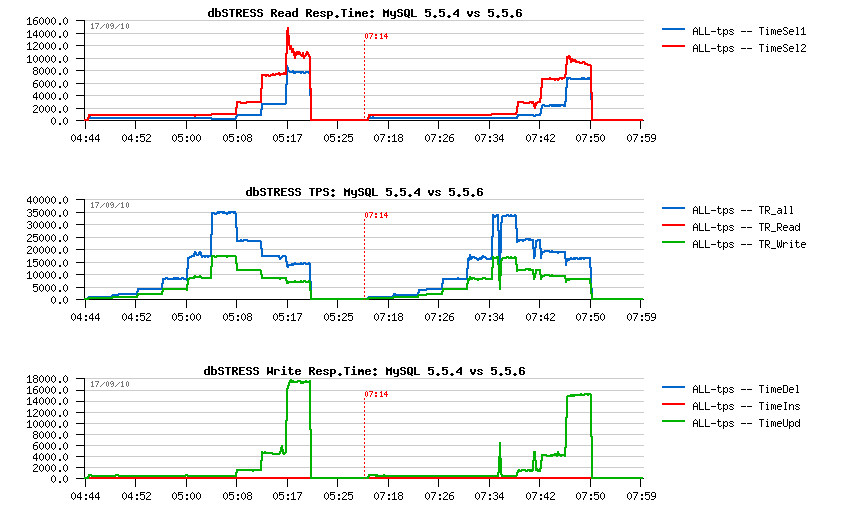
MySQL 5.5 innodb thread concurrency
From the previous graphs you may see that since 32 concurrent users/sessions there is a continuous drop in performance, and you may say - it's as expected as the innodb_thread_concurrency is set to zero. In the past to fix such an issue the solution was to set the innodb_thread_concurrency to something different from zero - for the 5.5 the most optimal value was 32 until now. The problem here is that everything as usual depends on the workload.. - And in my case, the overhead of innodb concurrency management is out-passed the potential gain! (since all performance improvements made in 5.5 its overhead may become more visible than ever)..
The overhead of the concurrency management in InnoDB is not something new - I've presented 2 output examples few years ago of the top locking on MySQL reported by Solaris "plockstat" (derivate from DTrace) - Lock waits reported by Solaris . You may see that once concurrency setting is not zero, the 'srv_conc_mutex' moving to the first place.. It was on the pre 5.4 era yet, but I don't think the concurrency code changed too much since that. And correct me if I'm wrong, but seems the waits on this mutex are not reported by "mutex status" output as it's created via "os_fast_mutex_init(&srv_conc_mutex);", so not listed in innodb mutexes and that's why I don't see it at all during monitoring (and I think the same for the same reasons it should be invisible for Performance Schema too) - and if it's so, it should be fixed..
Now, looking more in details for the observed performance difference - the following graph is representing a step by step growing dbSTRESS workload from 1 user to 256 (1,2,4..256): - on the left side 5.5.6 is running with innodb_thread_concurrency=0 - on the right side: set to 32 - changing the value of tickets is not helping here as transactions are very short and fast (that's why probably the overhead is seen so well too, don't know)..
MySQL 5.5.6 thread concurrency:
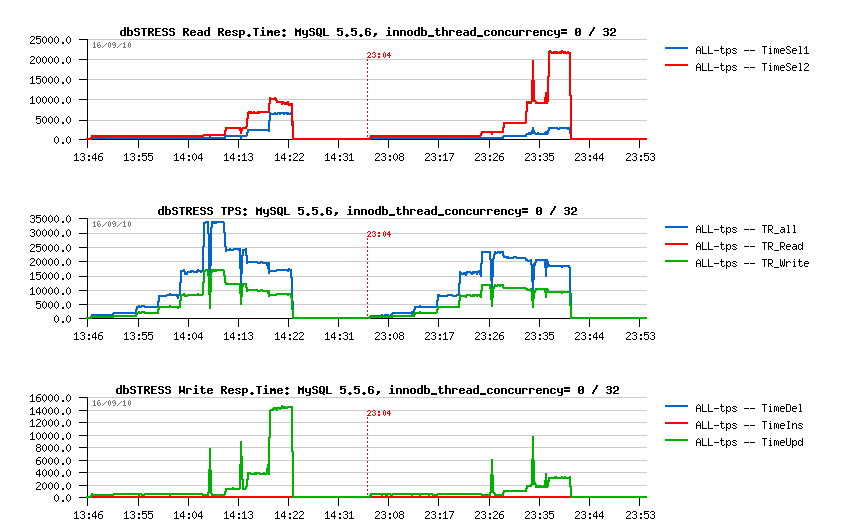
What is interesting:
- there is no difference until the concurrency is low (up to 16 users)
- the benefit is coming since 256 concurrent sessions only on this test..
-
with a growing workload performance is decreasing, but not for the
same reasons in both cases:
- with concurrency=0 it's mainly due growing time of UPDATE statements
- with concurrency=32 it's mainly due growing the second SELECT statements - so yes, it depends on the workload, and we need more visibility on internal waits to give a right advice :-)
Solutions?..
So, for the best performance results you're better to keep active sessions in your database under 32 and then set innodb_thread_concurrency=0. For example you may use an application server connection pool or other 3rd party solutions.. - nd of course having a thread pool inside of MySQL will be the most optimal :-)
Otherwise, if you may have many concurrent user sessions running on the same time you may always try to change innodb_thread_concurrency from its zero default value - this setting is dynamic, so you may quickly check the result without restarting your database server and then compare which setting is better adapted for your workload...
MySQL on I/O-bound workload
Well, until now I've focused my attention mainly on the in-memory workloads - in many cases on IO-bound workload you're simply testing your storage array performance and it doesn't help to improve MySQL performance :-)) However, now I my database is placed on the SSD disks! - how much it'll help in my workload?..
Let's start first with Read-Only workload as it's the most simple one :-)
To make my workload IO-bound I'll just reduce the AntiDEAD setting in dbSTRESS scenario (to avoid deadlock exceptions during the test, dbSTRESS has an AntiDEAD option: it gives an interval of ID to be used by each user/session, and avoids artificial deadlocks during testing). On the same time by this setting you may reduce or increase the quantity of pages which will be covered by randomization algorithm..
So far, reducing AntiDEAD from 2000 (default) to 200 I'm increasing by x10 times the number of pages accessed during the test. Other scenario settings remain the same:
- 1 to 256 users/sessions
- Read-Only transactions
- think time: 0
Then I've executed 3 tests:
- 1.) in-memory workload, AntiDEAD=2000 (as before)
- 2.) IO-bound workload, AnfiDEAD=200, data files are opened with O_DIRECT (not cached by file system)
- 3.) IO-bound workload, AnfiDEAD=200, data files are opened with fdatasync (cached by file system)
The following graphs are representing the observed 3 workloads in the same order:
MySQL 5.5 Read-Only IO-bound workload:
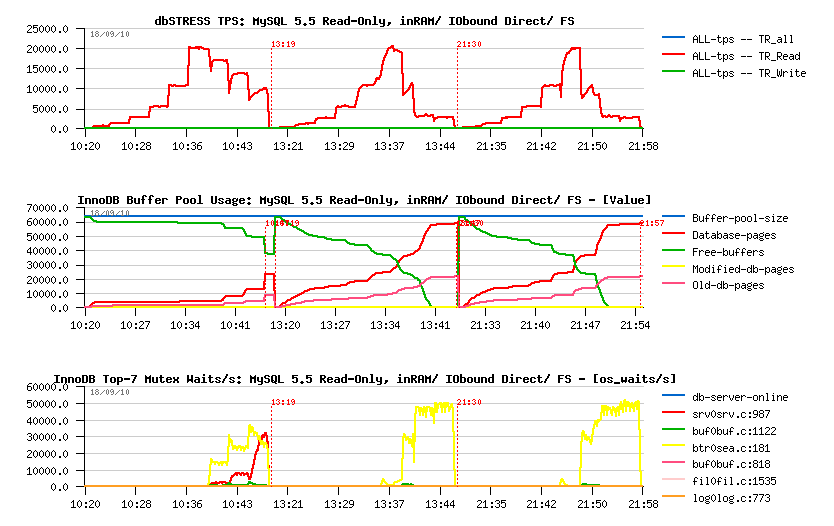
Observations:
- all three workloads reached the max 20K TPS observed initially with in-memory workload
- then with a growing workload, performance decreasing..
- however, the drop in performance is much more deeper on IO-bound workloads..
- is it because of I/O latency to the storage array?.. - not really, because even with a fully cached data by the filesystem the result is still not better ;-)
- interesting that the kernel_mutex that we see in in-memory workload is even not appearing when the workload is IO-bound..
- as well looking on the mutex waits, we may suppose the issue is coming from the btr_search_latch - but the real answer may be found with Performance Schema here ;-)
Seems things a directly depending on the page operations - with a smaller (8G) Buffer Pool performance become even worse and TPS will be limited to 10K only.. With 32G pool it's sligtly better, but in many cases you cannot put your whole database into your Buffer Pool, so there is definitively something to do here..
As you may imagine, Read+Write workload will suffer the same problems once it become IO-bound, but what is interesting that the main issues are READ transactions (as expected)..
MySQL 5.5 Read+Write IO-bound workload:
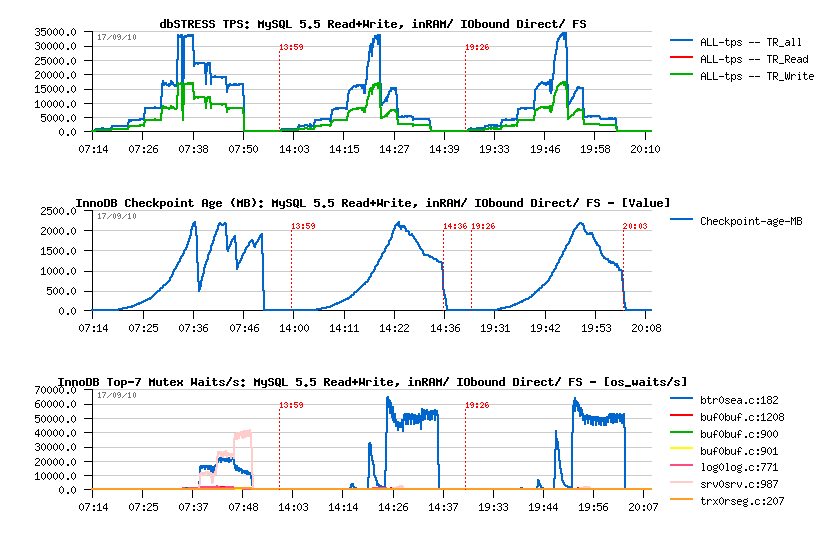
Observations:
- all three workloads reached the max ~35K TPS observed initially with in-memory workload
- similar to Read-Only decreasing performance with a growing workload..
- but what is interesting that during IO-bound workloads performance is decreased mainly due increased response time in SELECT statements! (page reading management?..)
- but from the other side: no furious flushing on the IO-bound workload.. (well, it's better to call it IO-bound reading ;-))
Some ideas...
It's quite curious to see how performance may vary depending on your data and I/O pattern..
Some points to consider:
- your database may be always way bigger than the RAM you have..
- you cannot always use most of the RAM for your database (specially if there are other applications are running on the same server)..
- in many cases file system may read much more faster the data required by the database rather the database read-ahead..
So I think we have to focus on how to speed-up the pages read within InnoDB, because even the Read-Only may look not perfect for the moment..
Well, work continues! :-))
All other details about present materials you may find in the final benchmark report: MySQL 5.5 Notes..
Any comments are welcome! :-)
Saturday, 14 August, 2010
EeePC-1005PE & openSUSE 11.2
I've started this year by acquiring a netbook EeePC-1005PE :-)

This post is to share and not forget useful tips to run Linux on EeePC netbook with a success :-)
First - I've wanted to have such a small device for a long time before, but still did not find a small and big enough on the same time :-)
- Screen become usable since 1024 pixels width, not less :-)
- Too small keyboard bring too many typos while typing :-))
- Battery autonomy is very important for freedom :-)
1005PE model (precisely PE) matched perfectly this criteria:
- Keyboard is absolutely great and usable even with my big fingers! :-)
- Touchpad is really well integrated :-)
- Screen is not glassy and very pleasant for eyes! :-)
- 12 hours of autonomy! (well, under Windows, but means more than 5 hours under Linux :-))
- Intel CPU single core bi-thread, 250GB disk and 1GB or RAM quite enough for common tasks :-)
- Intel Video with 2D acceleration randing KDE4 interface so beautiful! :-)
So far, happy owner of the mini-laptop :-)
Of course every day there was at least one colleague who asked the same question - how is it possible to work on the so small "machine".. - well, all depends what do you really need :-) people are very quickly forgetting that just 20 years ago everybody worked on 80x24 video terminal screens :-) and yet 10 years ago 800x600 laptop resolution was not yet a problem :-) - so having 1024x600 resolution makes not a big difference comparing to 1024x768.. - but of course if you cannot live without a big screen don't choose a netbook :-) Personally it's not a problem for me, and it's absolutely exciting to come in the office with a "pocket machine" :-) and keep all you need in a such small computer bag :-))
But well, the next challenge was my desktop migration - I'm using Linux over 12 years now, and since several last year a big lover of openSUSE. Since openSUSE 11.2 creation of the USB live stick was greatly simplified - all you need to obtain a live USB stick is to simply copy the LiveCD image directly to the USB device:
# dd if=/tmp/LiveCD.iso of=/dev/sdb
where "/dev/sdb" is your USB device (check it first what its name in your system once you've plugged it in)
NOTE: once the copy is finished, you may run "fdisk /dev/sdb" and create a second partition on your USB stick; then this partition will be used to save your local data when you're booting your netbook from the Live USB stick with openSUSE - means that you may keep your live configuration forever with your data and boot from any other laptop / netbook /desktop which allows to boot from USB device! :-)
Then, if you choose to install on the hard disk - installation is going fast and smoothly on 1005PE :-) mostly everything is working except some details you'll need to adjust (as in many cases when you're using Linux :-))
Following a list of my tips I've used on my netbook.
Sound
by default a sound level is very low... I've resolved
it by adding the following line:
options snd-hda-intel model=quantaintto the "/etc/modprobe.d/99-local.conf" file, after what the sound become "acceptable" :-))
Touchpad
it's very annoying to see the text you're typing to be randomly reformatted just because you've accidentally put your finger(s) on your touchpad :-)) One of the ways to disable your touchpad while typing is to start a following program from a terminal or by launcher via Alt+F2:$ syndaemon -i 1 -k -dAnd you may find other solutions as well (by installing synaptiks for ex., etc.)
Brightness
seems to be a common problem for many laptop devices: brightness levels are changing randomly when you're trying to increase or reduce your screen brightness. Following options should be added to your boot line to fix these issues:acpi_osi=Linux acpi_backlight=vendorthen you may also easily change your brightness from the command line:
$ solid-powermanagement brightness get/set 33and assign such actions to any shortcut in case if your Fn+ kays are not working or not recognized by default..
Intel Video Hang
One of the most annoying issues are system hangs due Intel Video Card.. Seems these hangs came since latest changes in the Intel driver code, etc. and can be avoided by installing an old driver, etc... The error messages in your sys log file are looking like this:... Feb 6 12:01:06 dimbook kernel: [ 4067.545514] render error detected, EIR: 0x00000010 Feb 6 12:01:06 dimbook kernel: [ 4067.545562] page table error Feb 6 12:01:06 dimbook kernel: [ 4067.545595] PGTBL_ER: 0x00100000 Feb 6 12:01:06 dimbook kernel: [ 4067.545635] [drm:i915_handle_error] *ERROR* EIR stuck: 0x00000010, masking Feb 6 12:01:06 dimbook kernel: [ 4067.545712] render error detected, EIR: 0x00000010 Feb 6 12:01:06 dimbook kernel: [ 4067.545753] page table error Feb 6 12:01:06 dimbook kernel: [ 4067.545787] PGTBL_ER: 0x00100000 ...Some people suggesting to disable KMS by booting with "nomodeset" option set, etc.. - but the workaround I've found which is 100% working for me is: never hibernate your netbook!! :-)) just use suspend to RAM or poweroff :-)) since then by suspend to RAM I've did not reboot ever several months :-)) (why reboot UNIX?.. :-)) of course you've to be sure about your battery, but this EeePC model can sleep 10 days on the battery without problem :-))
WiFi
Your WiFi connection will become much more stable if you disable the power management of your wifi card :-))# ifconfig wlan0 power off
FAN Control
Personally, I'm avoiding to use a laptop having a fan noise :-)) I even prefer it runs on 600Mhz but without any noise, rather on 2400Mhz but noisy :-)) BTW, 600Mhz is largely enough for all common tasks you're doing on your computer :-)) (well, except if your "common" tasks are CPU-bound like games or streaming, etc. ;-)) Also, a it's always easier to accept a constant low noise, rather jumping periods from silence to noise every time :-)) and the default EeePC setting I'd call pessimistic rather optimal :-)) I've found many interesting posts about fan noise on EeePC, some people even suggesting to remove the fan physically from your netbook and saying there is no any danger :-)) Well, I've found a reasonable workaround with a setting via command line - you may easily switch from BIOS (automatic) management to the manual management, and then set the fan speed according your feeling:check control (0= BIOS, 1= manual) # cat /sys/devices/platform/eeepc/hwmon/hwmon1/pwm1_enable switch to manual: # echo 1 > /sys/devices/platform/eeepc/hwmon/hwmon1/pwm1_enable switch back to BIOS: # echo 0 > /sys/devices/platform/eeepc/hwmon/hwmon1/pwm1_enable Set FAN Speed: # echo 10 > /sys/devices/platform/eeepc/hwmon/hwmon1/pwm1 # echo 40 > /sys/devices/platform/eeepc/hwmon/hwmon1/pwm1
HyperEngine
Then another optimization to increase your autonomy time while on batteries is to enable EeePC Hyper Engine: it improved my autonomy time from 6 to 8 hours! :-))Check HyperEngine state: # cat /sys/devices/platform/eeepc/cpufv where the last digit: 0= Perf 1= Default 2= Powersave (ex. x301 = Default) Enable Powersave: # echo 2 > /sys/devices/platform/eeepc/cpufv
That's all from my list..
Seems there are many improvements came with openSUSE 11.3 now, but I'm not changing a horse which is working already very well and will stick with 11.2 until nothing forcing me to upgrade :-))
If you have any other tips / findings, please share! :-))