« May 2016 | Main | December 2015 »
Tuesday, 16 February, 2016
MySQL Performance: PFS and Checksums impact on OLTP_RW Benchmark with MySQL 5.7
This article is the follow-up on discussion started around MySQL 5.7 results on OLTP_RW Benchmark.. -- the point was about the impact of PERFORMANCE_SCHEMA (PFS) enabled, and InnoDB checksums on MySQL 5.7 performance within this OLTP_RW workload.
As promised, here are the results:
Just in case if the legend naming in graphs is not obvious :
- PS-off : "performance_schema=off" was used
- PS-def : "performance_schema=on" was used (default PFS instrumentation)
- chksum0 : "innodb_checksums=0" was used
- chksum1 : "innodb_checksums=0, innodb_checksum_algorithm=crc32" was used
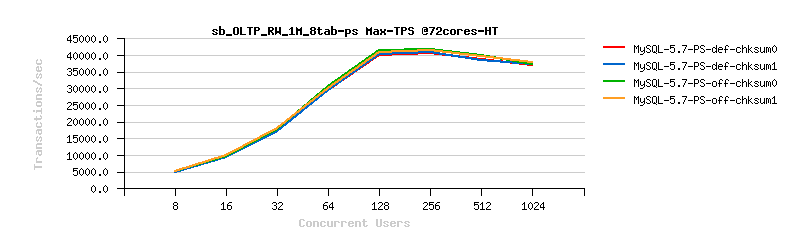
OLTP_RW 1M x8-tables MySQL 5.7 (config: trx_commit=2 double_write=0) :
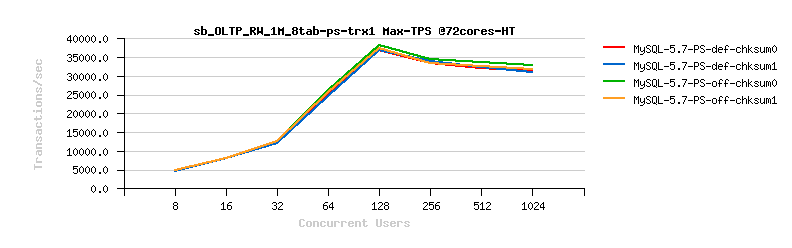
OLTP_RW 1M x8-tables MySQL 5.7 (config: trx_commit=1 double_write=0) :
OLTP_RW 1M x8-tables MySQL 5.7 (config: trx_commit=1 double_write=1) :
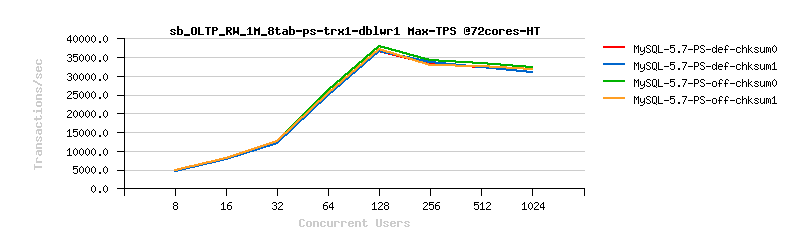
SUMMARY :
- the impact of checksums is near zero when OLTP_RW workload is running on MySQL 5.7 with a less safe config (trx_commit=2)
- the checksum impact is bigger on trx_commit=1 (but not growing more since double_write is also enabled)
- something similar goes with PFS impact as well..
- however this gives me an expectation that once we'll fix the slowdown issues due trx_commit=1, we'll lower as well PFS impact here too (like it was already happened in the past)..
- so far, the checksum impact here is around 0-2%, while PFS impact is around 3%-7% (mostly bigger on higher concurrency load)
- interesting that "combined" impact of both (checksums + PFS=on) is not really much different from just PFS=on
- NOTE : if you're really worry a lot about CPU cycles used by PFS instrumentation -- since MySQL 5.7 you can compile MySQL binary yourself with various PFS compile flags to completely disable some kind of instrumentations you're sure you'll never use (for ex. mutexes/rw-locks, etc.) -- I'm not doing so, but you can ;-))
- NOTE : from the past experience I've also observed that compiling MySQL binaries without "-fno-omit-frame-pointer" option may give you additional 5%-10% speed-up !! (however, you'll not be able anymore to get a proper stack trace from a running process or in case of crash..) -- I'm not doing so, but you can ;-))
- but well, what is important here is that with or without PFS/checksums enabled MySQL 5.7 is still reaching over 40K TPS performance level on this workload, and it's still way bigger than I've ever observed on MySQL until now ;-))
- and our challenge here is to bring trx_commit=1 to the same level as trx_commit=2, and largely reduce the impact of double_write.. (but this is another story, stay tuned ;-))
As usual, any comments are welcome! And Thank You for using MySQL! ;-))
Rgds,
-Dimitri
Tuesday, 09 February, 2016
MySQL Performance: Scalability on OLTP_RW Benchmark with MySQL 5.7
Next article from the MySQL 5.7 Performance stories, now about OLTP_RW
scalability (if you missed any previous ones, see 1.6M
SQL Query/sec (QPS) with MySQL 5.7, 1M
SQL Query/sec on mixed OLTP_RO / true
Point-Selects performance / over
100K Connect/sec Rate / Re:Visiting
nnoDB vs MyISAM Performance -- all with MySQL 5.7)..
Before
we'll start looking on OLTP_RW results, let me explain first why we
payed so many attention to MySQL 5.7 Performance in RO (read-only)
workloads (and all my previous posts were mostly about RO as well).. --
the reason is very simple: there is no great RW performance if RO is
lagging.. And also because we were pretty bad on RO before 5.7 ;-))
Let's
get a look on the following graphs :
- the graphs are representing the test results obtained more than 2 years ago..
- they are all obtained from the same 32cores-HT server (4CPU sockets, each with 8cores-HT)
- and we were looking for the best possible MySQL server performance on this host by limiting MySQL instance to be running on 1/2/4CPUs (8/16/32cores) and using/not-using CPU HyperThreading (HT) (16cores-HT vs 16cores, etc.)..
So, what we observed over 2 years when MySQL 5.7 development was just started ?..
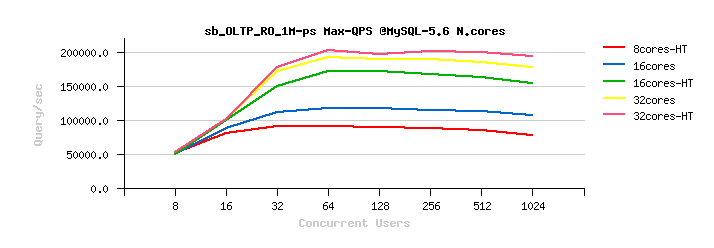
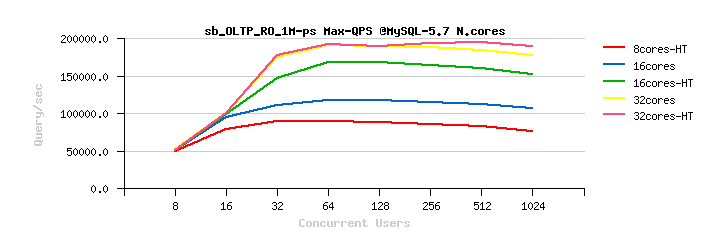
Here are the results obtained on OLTP_RO workload on MySQL 5.5 / 5.6 / and 5.7 on that time :
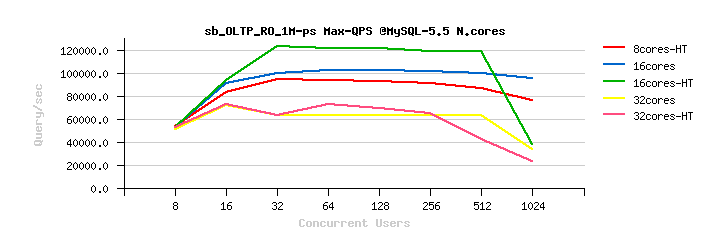
Observations :
-
on MySQL 5.5 :
- the results on 16cores-HT are x2 times better than on 32cores..
-
on MySQL 5.6 :
- the results on 32cores are just slightly better than on 16cores-HT
- as well the difference between 32cores vs 32cores-HT results is pretty small..
-
on MySQL 5.7 :
- same as on 5.6, the results on 32cores are just slightly better than on 16cores-HT
- but near no difference at all in 32cores vs 32cores-HT results..
- and, the most painful, is that an overall result is worse than on MySQL 5.6 (!)..
- this was the first painful point from where MySQL 5.7 was started over 2 years ago ;-))
- (and probably you're better understanding now why we're so happy to see MySQL 5.7 scaling really well today and easily reaching now over 1M QPS on the same OLTP_RO workload ;-))
But well, let's go back 2 years ago again, and see also what it was about OLTP_RW workload on that time :
The following are the similar test results on MySQL 5.5/ 5.6/ 5.7 , but about OLTP_RW :
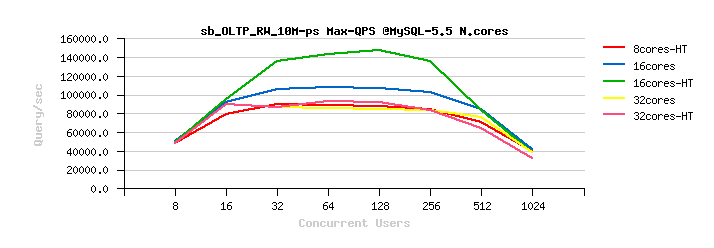
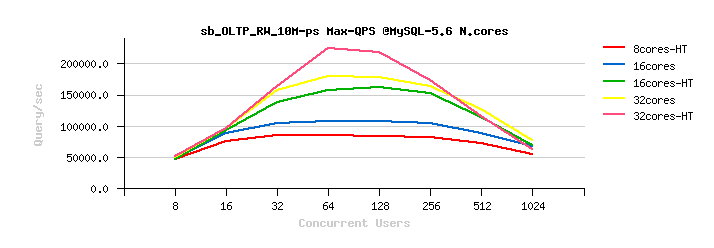
Observations :
-
I think you may observe the same tendency by yourself :
- MySQL 5.5 is scaling up to only 16cores-HT
- on MySQL 5.6 and 5.7 the results on 32cores are better than on 16cores
- the benefit from CPU HyperThreading is better seen on 32cores-HT now (but not that big as on 16cores-HT)
- however, MySQL 5.7 is better "resisting" to a higher concurrent users load
- while the Max peak TPS is still reached by MySQL 5.6, and not 5.7 ;-))
- but the most killing here is not this..
- in fact the presented OLTP_RW results are intentionally presented in QPS (Query/sec) and not in TPS (Transactions/sec)
- this is making OLTP_RW results "comparable" with OLTP_RO ;-))
-
from where you may discover the painful point #2 :
- over 2 years ago our OLTP_RW performance was better than OLTP_RO (!!!)
- and this was true for all presented MySQL versions on that time..
- NOTE : OLTP_RW workload is including OLTP_RO ;-))
- NOTE (again) : to be exact, OLTP_RW is extending OLTP_RO by adding write operations (INSERT, DELETE, UPDATE), so we're writing to the disk, we're logging every transaction, we're hitting transaction/REDO locking, and we're still reaching a higher QPS level than a pure OLTP_RO running fully in-memory... -- and this is all because our transactions management in InnoDB on that time was very heavy on locks and did not scale at all..
- Hope you can better understand now our frustration level 2 years ago, and challenges we faced on that time ;-))
That's why so many efforts were spent to improve InnoDB performance in MySQL 5.7 on RO workloads.. -- was this challenge fully completed?.. -- not yet (some specific cases (block lock, AHI, etc.) are still remaining; then many new functionality features were added in MySQL 5.7 over a time, and adding more code making an overall code path more long as well, so on low load RO workloads you may observe some slight regressions with MySQL 5.7 today.. -- however, as soon as your load is growing, you'll see a real benefit from improved MySQL 5.7 scalability ;-)) Le's say that with MySQL we got a rid of the "main scalability show-stopper" for RO workloads! - and, of course, we don't stop here, work in progress, and yet more other improvements are in our TODO list ;-))
Now, what about MySQL 5.7 Performance on RW workloads ?..
- the main InnoDB RW scalability show-stopper (generally and particularly in MySQL 5.7) is REDO log locking (log_sys mutex)
- well, to be exact, log_sys contention is the "final" show-stopper ;-))
-
while before hitting log_sys, you may hit and be blocked by :
-
index lock contention (big stopper for RW workloads, was
finally fixed since MySQL 5.7 only.. -- before the only possible
"workaround" was to use partitioning (this will split your hot
table in several tables (partitions), means split your index as
well, means split your contention by the number of partitions,
etc)..
-
transaction lock (trx_sys mutex) -- greatly improved in
MySQL 5.7 too
- lock_sys overhead -- lowered in MySQL 5.7, but need yet to be more improved..
- AHI (Adaptive Hash Index) contention (btr_search_latch RW-lock) -- there is a huge story behind it, but to make it short - you're better to disable it on RW workloads, as every data modification is involving AHI update (e.g. write lock), and you're quickly hitting a serialization here.. (work in progress to improve it)..
-
index lock contention (big stopper for RW workloads, was
finally fixed since MySQL 5.7 only.. -- before the only possible
"workaround" was to use partitioning (this will split your hot
table in several tables (partitions), means split your index as
well, means split your contention by the number of partitions,
etc)..
- but well, as soon as you're using MySQL 5.7, your main RW "scalability limit" will be mostly log_sys contention ;-))
- and, unfortunately, we were not able on MySQL 5.7 timeframe to improve this part of code as much as we made it for RO issues..
- a true fix is requiring a complete REDO log management re-design, and our timing was not favorable here..
- however, a probe prototype of the potential new solution showed us a great improvement (you can see its impact in the past LinkBench test results on MySQL 5.7)..
- the amazing part of this probe patch was that we were able to reach the same or better performance while using innodb_flush_log_at_trx_commit=1 (and flushing REDO log on every transaction) vs innodb_flush_log_at_trx_commit=2 (flushing REDO log only once per second).. -- this clearly proved that the main issue here is not the IO related fsync() of REDO log file, but the REDO log management itself..
- but well, we're not yet there ;-))
- so, while our MySQL 5.7 scalability on RW workloads got more better with innodb_flush_log_at_trx_commit=2, we're not really better with innodb_flush_log_at_trx_commit=1 yet (and on low loads / small HW configs you may see no difference vs MySQL 5.6) -- in fact getting other contentions lowered, the log_sys contention became more hot, and there is nothing to do with it, except to get it fixed, so the work in progress is here too ;-)) -- while with MySQL 5.6 you may still hit instead many other problems which were fixed only since MySQL 5.7, so the best answer here will be only your own test validation..
Well, this was about internal contentions which may limit RW scalability. While there are still few more factors :
-
trx_commit (trx) -- already mentioning before
(innodb_flush_log_at_trx_commit=0/2/1) and, of course, flushing REDO
log data to disk on every transaction commit
(innodb_flush_log_at_trx_commit=1) for sure will bring more penalty if
you're flushing REDO only once per second
(innodb_flush_log_at_trx_commit=2) -- while the risk here is to loose
the last second transaction(s) only (and maybe even nothing if your OS
& storage did not crash or if you're using semi-sync replication, or
even less than last 1 sec (because in reality REDO log with
innodb_flush_log_at_trx_commit=2 is still flushed more often than once
per second), and even many "serious companies" are doing so, etc.etc.)
-- but well, you're always better to evaluate what is valid for your
own production ;-))
-
flush_method -- as you're writing to disk, you have to choose
the way how your page writes will be flushed to the disk.. -- InnoDB
has several options here (and you may find many discussions around and
different people defending different option preferences, etc.) -- I'd
say from all the past experience and fighting various issues with FS
cache, my preferred option here will be to use O_DIRECT (or
O_DIRECT_NOFSYNC when available) combined with AIO
(innodb_flush_method=O_DIRECT_NOFSYNC and innodb_use_native_aio=1).
And, curiously, I'm still prefer EXT4 (while many are claiming XFS is
better) -- will post my observations later about ;-))
-
double_write (dblwr) -- the only solution InnoDB has to protect
your data from partially written pages on system crash (so, InnoDB
will write each page twice: first on dblwr buffer disk space (sys
tablespace), and once the write is confirmed, the page is written on
its own place (and if on that write the system will crash, the valid
page copy will be recovered from dblwr)) -- while I often hear that on
the "modern HW" not need to care about, the risk is still here ;-))
and it's still up to you to decide will you turn this protection ON or
OFF (innodb_doublewrite=1/0). However, there are several alternatives
are possible:
- you may buy Fusion-io flash card and use their NVMFS filesystem which is supporting "atomic IO writes" (so each page write is confirmed to be fully written) -- MySQL 5.7 is supporting this card automatically (combined with O_DIRECT)
- you may use "secured" by-design FS (like ZFS for ex. or ZFS Appliance) -- such a storage solution by definition will garantee you'll never loose any bit of your data ;-)) (on the same time don't be surprised your writes are going slower -- each write (and read!) is hardly verified) -- while this may still be faster than the current dblwr..
- or use FS with data journal (like EXT4, but you have to use O_DSYNC with it, so some FS cache related surprises are potentially possible ;-))
- etc..
-
I'd say the HW-based "atomic IO writes" solution is looking as the
most strong.. -- but we're working here as well to bring yet more
possible options, so stay tuned ;-))
-
purge -- a kind of "garbage collector" in InnoDB, running in
background, can be configured with several "purge threads", however
you may still see it lagging in your RW workload (can be observed as a
growing or remaining high "History List" via "show engine innodb
status" or via InnoDB METRICS table) -- the problem with constantly
lagging purge is that your data space can be finally completely filled
up with a "trash", and your whole database processing will be stopped
due no more free disk space available.. The good news with MySQL 5.7
that if even purge is lagging during a high load, it'll be still able
to catch up once the load become low and "auto-magically" free
the disk space used by UNDO images (this is available only since
MySQL 5.7, and in all previous versions the only solution to get all
this disk space back was to drop the whole InnoDB instance and restore
it from a backup or import from a dump).. -- so, it's important to
configure several purge threads to make such a space recovery faster
(innodb_purge_threads=4)
-
adaptive flushing -- I'll not go too much in details here as
the topic is extremely interesting and worth a dedicated article
about, so here will just mention that since MySQL 5.7 you can have
several "flushing threads" (cleaners) working in parallel -- the
initial analyze about what is going odd was made yet more than 3 years
ago with MySQL 5.6 (see: http://dimitrik.free.fr/blog/archives/2012/10/mysql-performance-innodb-buffer-pool-instances-in-56.html
for details) -- however this was only the first step in this
adventure, and a more advanced design was required ;-)) -- well, we're
not yet "perfect" here, yet more to come, will just mention here that
using 4 threads is usually ok (innodb_page_cleaners=4), then the IO
capacity setting should be adapted to your workload and your storage
(ex. innodb_io_capacity=2000 innodb_io_capacity_max=10000), and there
is no more danger to use bigger REDO log files (recovery processing is
going much more faster now than before, as well only a "really needed"
REDO space is used, as well a previously existing "read-on-write"
issue on REDO logs was fixed since MySQL 5.7, so using 8GB REDO, or
bigger is no more a problem (innodb_log_file_size=1024M
innodb_log_files_in_group=8) -- well, sorry to skip the details here,
will provide them all later..
-
checksums -- as soon as you're using crc32 option, you're fine
;-)) however, keep in mind that this is not impacting your scalability
limits, this is a pure "overhead" (your performance levels will still
scale with the same tendency, just that the response times will be
higher)..
- there are some other points/tuning/etc. are coming in the game as well, but let's keep the list short just with the most important ones ;-))
After all this "preface", let's focus now on the OLTP_RW benchmark testing (hope it was not too much boring until now ;-))
So far, my main goal on the following testing is to mainly analyze the scalability of MySQL 5.7 on OLTP_RW workload :
- means, I don't need a too big database (I'm not testing the storage here ;-))
-
so, the dataset should be :
- not too small to run fully on CPU caches level ;-))
- and not too big either to not involve IO reads (otherwise, again, we're testing the storage performance ;-))
My HW platform :
- for my tests I'll use the 72cores-HT server running OracleLinux-7.2 and having flash storage
- why 72cores ?..
- in fact this is a 4CPU sockets server (18cores-HT per CPU socket)
- so, I can easily test scalability on 1CPU (18cores-HT), 2CPU (36cores-HT) and 4CPU (72cores-HT) by binding my MySQL server to run exclusively on these CPU cores..
- then, these CPUs are the latest CPU chips from Intel, they are really way more powerful comparing to what I have on my older machines..
- and this is where the whole HW tendency is going -- you'll see these CPUs on all "big" and "commodity" HW, and even 18cores-HT per CPU is not a limit either, so there are really fun times are coming (and if you're still thinking that "commodity" HW is a host with 4cores -- it's a good time to wake up ;-))
While my main interest here is about MySQL 5.7, I'm also curious to see what are the limits on the other MySQL Engines as well, and I have the following on my list :
MySQL Engines :
- MySQL 5.7
- MySQL 5.6
- MySQL 5.5
- Percona Server 5.6
- MariaDB 10.1
Test Scenario :
- from the previous OLTP_RO test I've already observed that all engines are worse vs MySQL 5.7 when a single table only is used in OLTP test.. -- so, no need to waste a time again to point to the same problem..
- let's focus then on x8-tables OLTP_RW Sysbench test workload, each table of 1M
- before each test the database is completely restored from its backup (clean dataset for each test)
- the load is progressively growing from 8, 16, 32, .. up to 1024 concurrent users
- each load level is kept at least for 5min (was enough to get an understanding about scalability limits, while I'd prefer more longer steps, while in the current case there was no way to run more longer iterations, as to cover all planned test conditions the whole testing already took over 2 weeks non-stop running ;-))
-
each MySQL Engine is tested within the following configurations :
- trx2 -- innodb_flush_log_at_trx_commit=2 && innodb_doublewrite=0 (default)
- trx1 -- innodb_flush_log_at_trx_commit=1 && innodb_doublewrite=0
- trx1-dblwr1 -- innodb_flush_log_at_trx_commit=1 && innodb_doublewrite=1
-
each configuration is also tested with the following tuning
combinations :
- ccr0-sd6 -- innodb_thread_concurrency=0 (default) && innodb_spin_wait_delay=6 (default)
- ccr64-sd6 -- innodb_thread_concurrency=64 && innodb_spin_wait_delay=6
- ccr0-sd6 -- innodb_thread_concurrency=0 && innodb_spin_wait_delay=96
- ccr64-sd6 -- innodb_thread_concurrency=64 && innodb_spin_wait_delay=96
- and, finally, all configurations + all tuning combinations are tested on 1, then 2, then 4 CPU sockets (18cores-HT, 36cores-HT, 72cores-HT)..
- the best obtained results for each Engine from any tested combinations then used to compare performance in different configurations (best-to-best comparison)..
I think I need to explain here a little bit more in details the impact of the mentioned tuning options :
-
thread_concurrency : a well known InnoDB tuning to limit the
amount of concurrently running threads (usually no more required since
MySQL 5.7 for RO workloads, but still helping for RW -- as we're
writing and for sure will involve IO operations + manage various
raw/data locking (via mutexes/RW-locks, etc.) -- there is still a
significant benefit possible with an "optimal" thread concurrency
limitation. Which setting could you consider optimal?.. -- I'd say you
need to analyze which peak performance level you're reaching on your
workload without concurrency limit (innodb_thread_concurrency=0) and
see how many concurrent user sessions are running during this period
-- this will be then your main concurrency target (by not allowing
more than N concurrent threads you'll be able to keep your performance
stable even with a higher load (well, at least not to see it quickly
going down ;-)) -- in my cases the most optimal setting was 64 until
now (innodb_thread_concurrency=64), while in your case it may be
something different as well (this tuning is fully dynamic, so you may
do live experiments on any running workload at any time you want ;-))
- spin_delay : and this tuning is directly related to how internal lock primitives (mutexes/RW-locks) are "spinning" on a lock wait (threads waiting on a lock will "sleep" a given delay between spins before to re-try to acquire a lock again) -- the important point here is that a waiting thread in InnoDB will not really "sleep" on delay, but rather execute a "pause" instruction to CPU, so the CPU will switch to execute another thread(s), and waiting thread will come back as soon as its "pause" is finished (for this reason "show mutex" output about mutex/RW-locks spins/waits is better reflecting as for today InnoDB internal waits stats (as the time spent on a wait is not really wasted)). The question is then which value will be the most optimal here?.. -- again, you can get it only by testing by yourself ;-)) (this tuning is also dynamic) -- the 6 is default value, and I'm usually using 96 (innodb_spin_wait_delay=96) for big enough systems. Again, for RO workloads since MySQL 5.7 it's no more required, while for RW workloads we'll hit log_sys mutex contention for sure, and such a tuning usually may help.. The only problem here is that this setting is applied to all lock primitives together, so you really need to do experiments yourself to see what is better for you. However, by getting rid of hot contentions with every new improvement in InnoDB, we're progressively making the need of such a tuning obsolete.. (work in progress, stay tuned ;-))
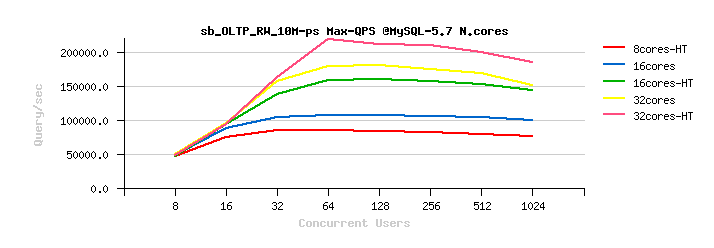
Now, let me show the impact of this tuning by example :
- the following graph is representing MySQL 5.7 results on OLTP_RW test
- there are 4 results for the same MySQL 5.7, just with different concurrency/spin_delay tuning settings: ccr=0 / 64, sd=6 / 96
Observations :
- as you can see, tuning the spin_delay for this Engine in this workload giving the most important impact..
- with spin_delay=6 (sd6) we're getting a better performance up to 64 concurrent users
- however with spin_delay=96 (sd96) we're going more far up to 128 users, and then able to keep near the same level of performance on a higher load as well..
- interesting that in this case tuning thread concurrency helps only for sd6 setting, and has no impact on sd96
- (but by the past experience I know it helps a lot on IO-bound workloads, so no reason to not test it ;-))
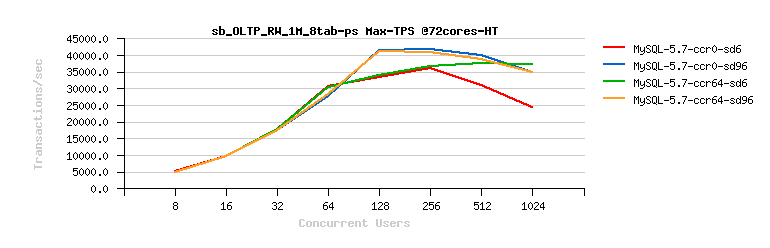
The same tuning was applied to all other Engines, and then the best obtained results collected (Max(QPS) or Max(TPS)) for each test case.
Now, if you're curious, let me show you yet few more details about :
- so, the next following graphs is representing "live" stats data corresponding to the obtained above results
-
from the left to the right you can see 4 tests with the same MySQL
5.7, but configured with :
- #1) sd6, ccr0
- #2) sd6, ccr64
- #3) sd96, ccr0
- #4) sd96, ccr64
- the first graph is showing reached Commit/sec rate (TPS)
- the second one is the amount of concurrent user sessions
- and the third graph is showing corresponding mutex/RW-locks spin waits reported by InnoDB :
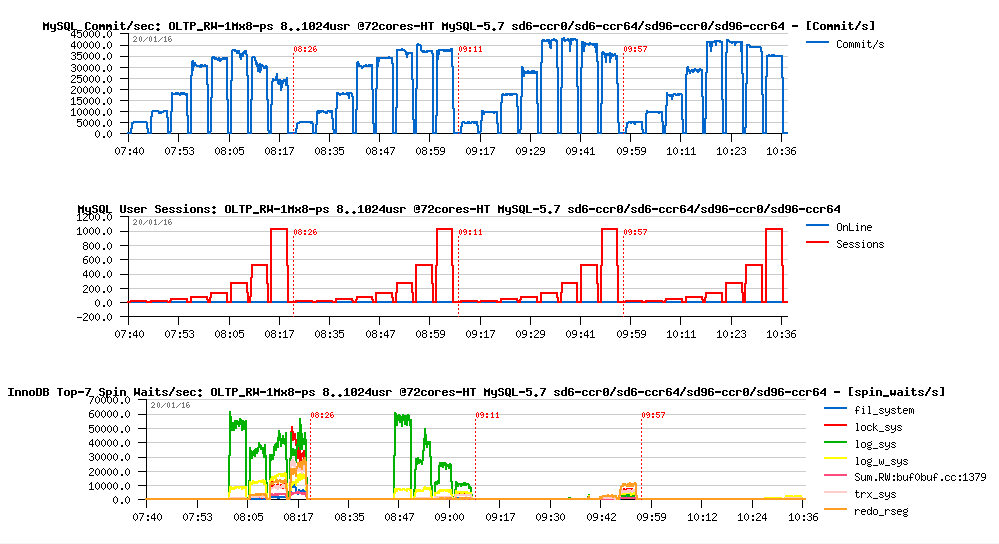
Observations :
- as you can see the default #1) case is hitting the highest lock contentions and reaching the lowest TPS..
- tuning concurrency=64 in the case #2) is helping to lower waits on other locks, except log_sys, and also helps to avoid a TPS drop on a higher load..
- tuning spin_delay=96 in case #3) lowering finally log_sys and giving us the highest TPS result here
- adding concurrency=64 in case #4) lower spin waits yet more, but then the processing becomes "too relaxed", and TPS results is not better, while becomes more stable ;-))
While if we will go yet more in details about observed spin waits we may discover the following (adding CPU Usage% and Perf Profiler stats):
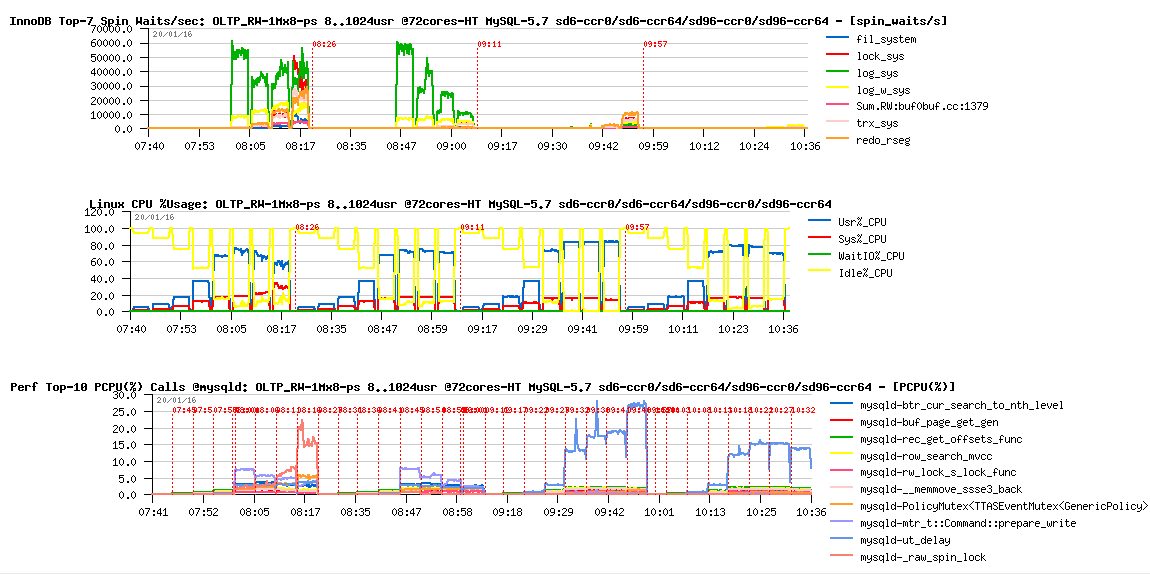
Observations :
- well, just to show you that only once spin_delay was set to 96 we're starting to use CPU time fully..
- however, we're spending 15%, 20%, or over 25% in the "sleeping" code (ut_delay())
- and this is where our future potential gain is ;-))
Very hope the next MySQL/InnoDB version will get a rid of all these lock contentions and use HW way more efficiently.. -- let's see ;-))
Now, let's go back to the beginning of all this story (over 2 years ago), and get a look where we're finally today!
So far, just as a reminder, here are the results on OLTP_RO workload obtained on the all mentioned MySQL Engines on the same 72cores-HT server (and published before) :
Sysbench OLTP_RO 1M x 8-tables @72cores-HT (QPS) :

As you can see, MySQL 5.7 is reaching here 1M QPS, while MySQL 5.6 (and other "5.6 based") Engines are blocked around 400K QPS...
Now, what about OLTP_RW ?..
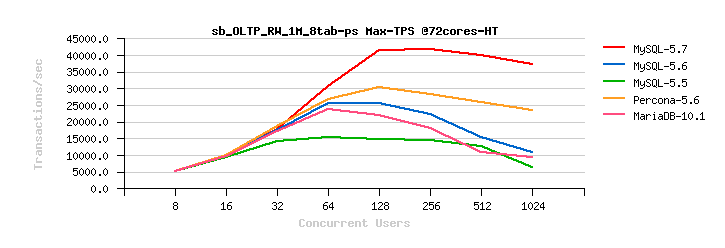
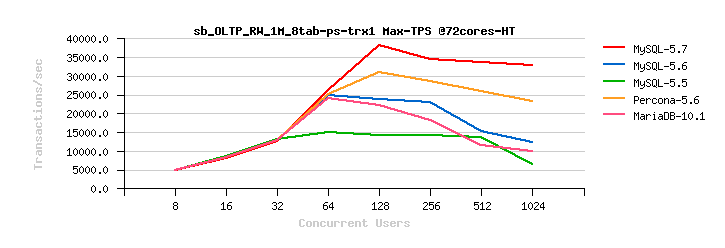
Sysbench OLTP_RW 1M x 8-tables @72cores-HT, config: trx_commit=2 dblwr=0 (QPS) :

Observations :
- NOTE : this is OLTP_RW results with Engines configured with trx_commit=2 and dblwr=0, so the max possible OLTP_RW performance is reached here..
- NOTE : the results are presented in QPS (and not TPS) to be "compatible" with OLTP_RO
- so far MySQL 5.7 is reaching 800K QPS here, the best result from all Engines, and its OLTP_RW result is lower than 1M QPS OLTP_RO (as naturally should be "expected")
- Percona Server 5.6 is on the second positions with its not far from 600K QPS, and way higher than its 400K QPS obtained on OLTP_RO..
- the 3rd is MySQL 5.6, 500K QPS on OLTP_RW, while 400K QPS on OLTP_RO
- 4th is MariaDB 10.1 with 450K QPS on OLTP_RW and higher result as well than on OLTP_RO..
So far, the OLTP_RO vs OLTP_RW target was finally reached by MySQL 5.7 only. Time for other challenges, work in progress ;-))
Let's now go back to OLTP_RW results more in details and see the impact of all tested configurations.
Sysbench OLTP_RW 1M x 8-tables @72cores-HT, config: trx_commit=2 dblwr=0 (TPS) :
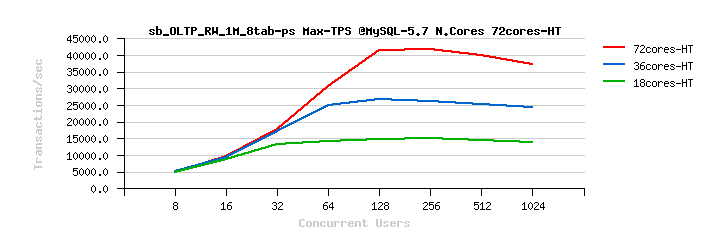
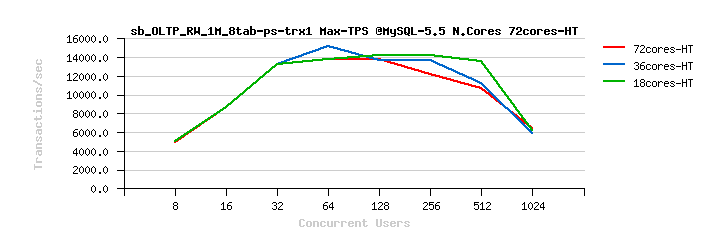
MySQL 5.7 Scalability @Sysbench OLTP_RW 1M x 8-tables @72cores-HT, config: trx_commit=2 dblwr=0 (TPS) :
MySQL 5.6 Scalability @Sysbench OLTP_RW 1M x 8-tables @72cores-HT, config: trx_commit=2 dblwr=0 (TPS) :
MySQL 5.5 Scalability @Sysbench OLTP_RW 1M x 8-tables @72cores-HT, config: trx_commit=2 dblwr=0 (TPS) :
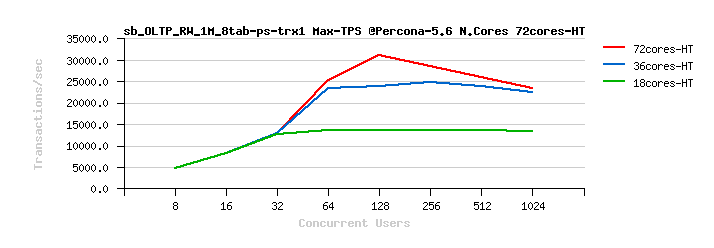
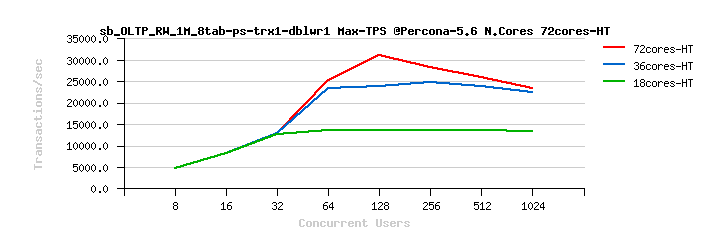
Percona Server 5.6 Scalability @Sysbench OLTP_RW 1M x 8-tables @72cores-HT, config: trx_commit=2 dblwr=0 (TPS) :
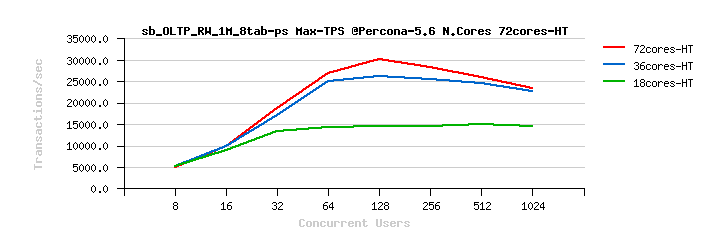
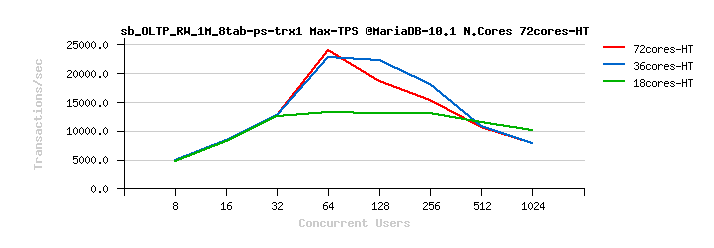
MariaDB 10.1 Scalability @Sysbench OLTP_RW 1M x 8-tables @72cores-HT, config: trx_commit=2 dblwr=0 (TPS) :
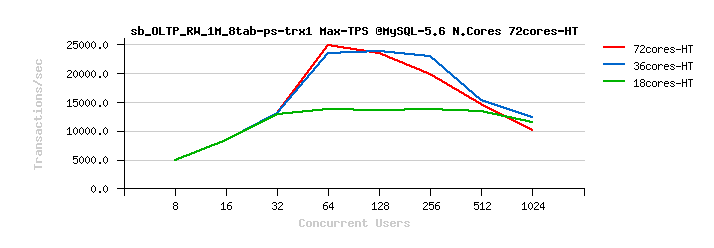
Sysbench OLTP_RW 1M x 8-tables @72cores-HT, config: trx_commit=1 dblwr=0 (TPS) :
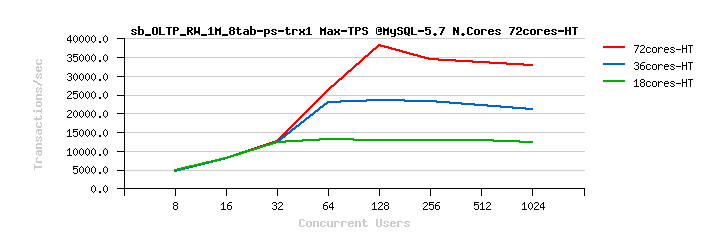
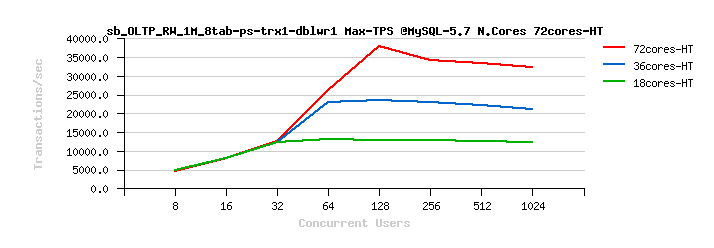
MySQL 5.7 Scalability @Sysbench OLTP_RW 1M x 8-tables @72cores-HT, config: trx_commit=1 dblwr=0 (TPS) :
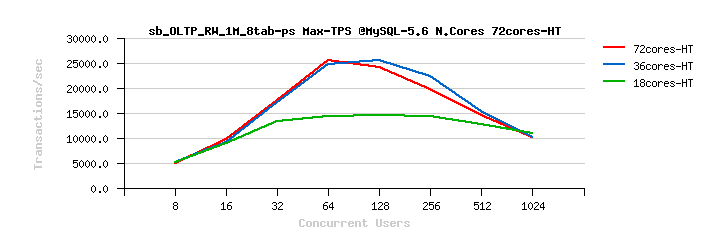
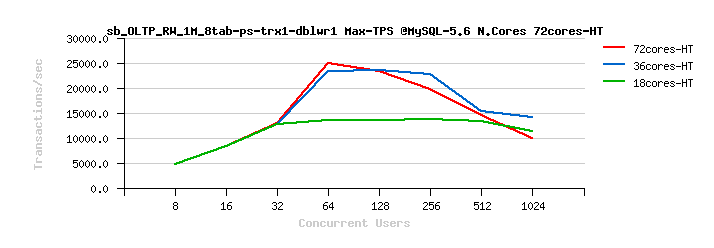
MySQL 5.6 Scalability @Sysbench OLTP_RW 1M x 8-tables @72cores-HT, config: trx_commit=1 dblwr=0 (TPS) :
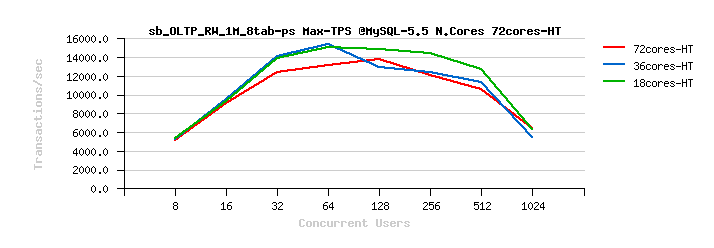
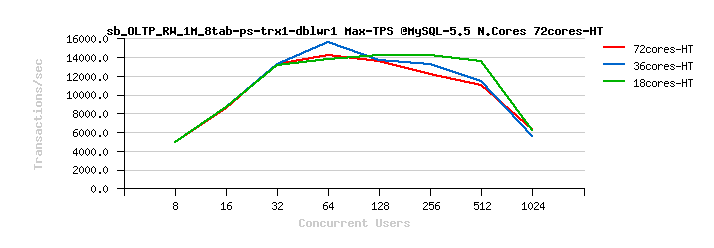
MySQL 5.5 Scalability @Sysbench OLTP_RW 1M x 8-tables @72cores-HT, config: trx_commit=1 dblwr=0 (TPS) :
Percona Server 5.6 Scalability @Sysbench OLTP_RW 1M x 8-tables @72cores-HT, config: trx_commit=1 dblwr=0 (TPS) :
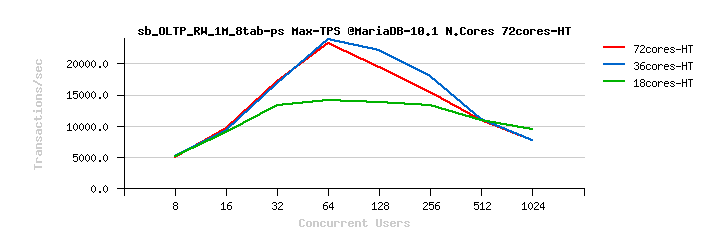
MariaDB 10.1 Scalability @Sysbench OLTP_RW 1M x 8-tables @72cores-HT, config: trx_commit=1 dblwr=0 (TPS) :
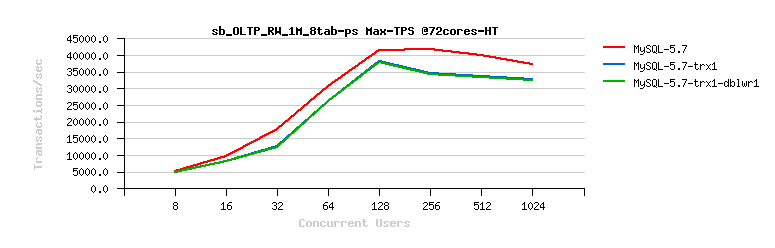
Sysbench OLTP_RW 1M x 8-tables @72cores-HT, config: trx_commit=1 dblwr=1 (TPS) :

MySQL 5.7 Scalability @Sysbench OLTP_RW 1M x 8-tables @72cores-HT, config: trx_commit=1 dblwr=1 (TPS) :
MySQL 5.6 Scalability @Sysbench OLTP_RW 1M x 8-tables @72cores-HT, config: trx_commit=1 dblwr=1 (TPS) :
MySQL 5.5 Scalability @Sysbench OLTP_RW 1M x 8-tables @72cores-HT, config: trx_commit=1 dblwr=1 (TPS) :
Percona Server 5.6 Scalability @Sysbench OLTP_RW 1M x 8-tables @72cores-HT, config: trx_commit=1 dblwr=1 (TPS) :
MariaDB 10.1 Scalability @Sysbench OLTP_RW 1M x 8-tables @72cores-HT, config: trx_commit=1 dblwr=1 (TPS) :
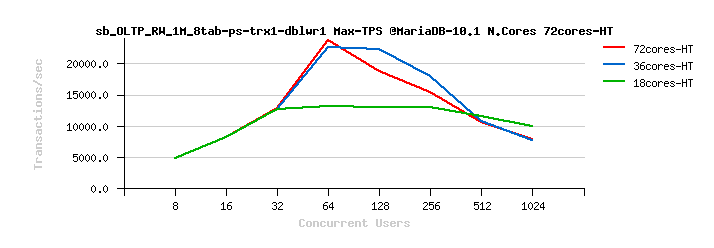
From the presented above OLTP_RW results you can see that :
- switching trx_commit=1 is giving the biggest impact on performance..
- adding dblwr=1 here is not impacting too much due a relatively not too hard flushing involved by the tested workload (not too hard for the used flash storage)
- with trx_commit=2 the absolute winner is MySQL 5.7
- with trx_commit=1 on 72cores the winner is MySQL 5.7, while on 36cores is Percona Server 5.6 (small, but visible gain), and on 18cores rather MySQL 5.5 (surprise! ;-)) just that it has a drop on 1024 users
- with trx_commit=1 + dblwr=1 the result is not much different from just trx_commit=1 :
INSTEAD OF SUMMARY :
- there was a really huge gain made in scalability improvement in MySQL 5.7 !..
- reaching over 40K TPS on OLTP_RW is the highest ever result I've seen on MySQL until now ;-)
- however, there is yet more to do in MySQL for efficiency and further scalability improvements in RW workloads..
- the main challenges are around REDO log management
- while on heavy IO-bound RW workload the double_write becomes a huge problem as well (more about later, in the next articles)..
- well, work in progress, stay tuned ;-))
As usually, any comments are welcome! And thank you for using MySQL! ;-))
Rgds,
-Dimitri
APPENDIX
The Sysbench command used to run OLTP_RW test via IP port (starting 8 processes in parallel):
$ LD_PRELOAD=/usr/lib64/libjemalloc.so /BMK/sysbench --num-threads=$1 \
        --test=oltp --oltp-table-size=1000000 \
        --oltp-dist-type=uniform --oltp-table-name=sbtest_1M_$n \
        --max-requests=0 --max-time=$2 --mysql-host=127.0.0.1 --mysql-port=5700 \
        --mysql-user=dim --mysql-password=dim --mysql-db=sysbench \
        --mysql-table-engine=INNODB  --db-driver=mysql \
        run  > /tmp/test_$n.log &
the my.conf I've used during the tests :
[mysqld]
# general
  table_open_cache = 8000
  table_open_cache_instances=16
  back_log=1500
  query_cache_type=0
  max_connections=4000

# files
  innodb_file_per_table
  innodb_log_file_size=1024M
  innodb_log_files_in_group=3
  innodb_open_files=4000

# buffers
  innodb_buffer_pool_size= 32000M
  innodb_buffer_pool_instances=32
  innodb_log_buffer_size=64M

# tune
  innodb_checksums=0
  innodb_doublewrite= 0 / 1
  innodb_support_xa=0
  innodb_thread_concurrency=0 / 64
  innodb_flush_log_at_trx_commit=2 / 1
  innodb_flush_method=O_DIRECT_NOFSYNC
  innodb_max_dirty_pages_pct=90
  innodb_max_dirty_pages_pct_lwm=10
  innodb_lru_scan_depth=4000
  innodb_page_cleaners=4
  join_buffer_size=32K
  sort_buffer_size=32K
  innodb_use_native_aio=1
  innodb_stats_persistent = 1
  innodb_spin_wait_delay=6 / 96

# perf special
  innodb_adaptive_flushing = 1
  innodb_flush_neighbors = 0
  innodb_read_io_threads = 4
  innodb_write_io_threads = 4
  innodb_io_capacity=2000
  innodb_io_capacity_max=4000
  innodb_purge_threads=4
  innodb_max_purge_lag_delay=30000000
  innodb_max_purge_lag=0
  innodb_adaptive_hash_index=0

# Monitoring
  innodb_monitor_enable = '%'
  performance_schema=OFF