« July 2011 | Main | January 2011 »
Friday, 29 April, 2011
MySQL Performance: 5.6.2 and Performance Schema
Last year I've published a post about Performance
Schema overhead which involved many (and sometimes very hot :-))
e-mail discussions and finally resulted in a massive code improvements
in MySQL Performance Schema (P_S) released by Marc
Alff.
Don't know if I was right, but in my mind the logic of
P_S "usability" should be matching following statements:
- There is no tracing or monitoring possible with a zero overhead, period.
- The overhead may be only lighter or heavier, depending on amount and kind of information we expecting to retrieve..
- Then, as such overhead is inevitable, a user should have some ways to minimize it whenever possible
- The most lightweight self-monitoring solution is probably to use event counters
- In many cases the cost of a simple incremental operation of a counter will be lower than condition check (IF operation), so the most light counters may remain active all the time incrementing their values on every corresponding event..
- Then measuring a time spent between or within various event will for sure bring additional cost..
- Then obtaining more detailed information may bring more overhead..
- So far - as soon as the overhead is predictable, a user may enable/disable any kind of tracing dynamically (on-demand), while a basic monitoring (with counters) should remain very lightweight - this will give you a possibility to keep a basic accounting always active even in production systems, and according reported information dynamically activate more detailed data collection when required..
Initial P_S implementation was already ready for any kind of dynamic activation of various event monitoring, but the overhead of even minimal data was really huge and it was hard to say if we observing the events because they are really present within MySQL activity or these events came due P_S overhead..
Improved Performance Schema
Mark made an enormous work to redesign P_S code (it should be probably not far from completely rewriting it again?) and made P_S overhead "managable" by user:
- there is no overhead if P_S is OFF
- there is near no overhead if P_S is ON but all CONSUMERS are disabled
- very low overhead when only global counters are enabled
- still low overhead when only global counters + timed are enabled
- then more overhead is coming since other instrumentations are also enabled..
Such an approach matched all my expectations and I was more than happy to replay the same workload tests with a new "prototype" code. The most important overhead is coming due mutex instrumentation - as mutex contention within MySQL and InnoDB is already very hot, adding few instructions more around mutexes is only increasing contentions, but, from the other hand, only self-instrumentation may bring you all needed information to understand your mutex contention on any HW/SW platform.. Other events instrumentation is having much less overhead, so it was logical for me to split events into 2 groups: "mutexes" and "not mutexes" :-)
The following results I've obtained on the "prototype" P_S overhead:
| Workload \ Case# | #1 | #2 | #3 | #4 | #5 | #6 | #7 |
| Read-Only | 2-3% | 3-4% | <5% | 5% | 7% | 5.5% | 7.5% |
| Read+Write | 2-3% | 3-4% | 4% | 5% | 7% | 10% | 19% |
where:
- case #1: P_S=ON, but all CONSUMERS=OFF (P_S infrastructure overhead)
- case #2: P_S=ON, Global instrumentation=ON, "non-mutex" INSTRUMENTS=ON & TIMED=OFF (only counters)
- case #3: P_S=ON, Global instrumentation=ON, "non-mutex" INSTRUMENTS=ON & TIMED=ON (counters & time)
- case #4: P_S=ON, Global instrumentation=ON, "mutex" INSTRUMENTS=ON + TIMED=OFF
- case #5: P_S=ON, Global instrumentation=ON, "mutex" INSTRUMENTS=ON + TIMED=ON
- case #6: P_S=ON, Global instrumentation=ON, "all" INSTRUMENTS=ON + TIMED=OFF
- case #7: P_S=ON, Global instrumentation=ON, "all" INSTRUMENTS=ON + TIMED=ON
all results were observed on 32 cores server running MySQL 5.5 under 32 non-stop concurrent sessions @dbSTRESS scenario - focusing on such a peak performance we observing probably the worst possible case of the possible P_S overhead..
What was very positive:
- you may run any server with P_S enabled by default with less than 3% overhead
- and if you don't need to monitor mutexes & rw-locks, you may monitor any other global instrumentation events (counters + times) with less than 5% overhead!
- then you may still go more in depth in your observations still keeping P_S overhead less than 5-10%
- and what was important: overhead was proportional !! - there was no one mutex contention for ex. reported by InnoDB jumped way higher than others (like it was in the initial code) - so it was finally possible to believe P_S observations!! :-)) (as contention did not become hotter due P_S itself)..
These results I've obtained last summer, but the code was not yet public and it was too late to get it included within MySQL 5.5 as it was prepared for GA.. So my results waited for the next official release :-))
The "improved" P_S code was shipped with MySQL 5.6.2 now, and I was ready to replay my tests again and expected to see even better results! :-)) (well, the time was against me as there were many performance issues on 5.6.2 itself, and P_S testing should yet wait and I've started my tests only after Collaborate & UC events..)
Improved Performance Schema within MySQL 5.6.2
Well, from the very first test I've got a feeling there is a bug somewhere.. - and here is why: it's absolutely abnormal to observe a 10% performance drop while P_S is enabled but all CONSUMERS are set to OFF! - there is simply no reason to have such an overhead.. - there is a problem here for sure!..
Then of course, having such a "starting" overhead the things may be only worse once you enable any other event monitoring..
Here are results I've obtained on using only Global instrumentation, but following the same test cases as before, except that I'm also presenting the "case #0" - means the performance results with P_S=OFF.
So, you'll see graphs corresponding with a series of tests for each workload:
- Read-Only (only SELECTs)
- Read+Update (only SELECTs & UPDATEs)
- Read+Write (SELECTs, DELETEs, INSERTs, UPDATEs)
There are 8 cases on each graph (the first one with P_S=OFF, then case #1, #2 .. #7 as described before)
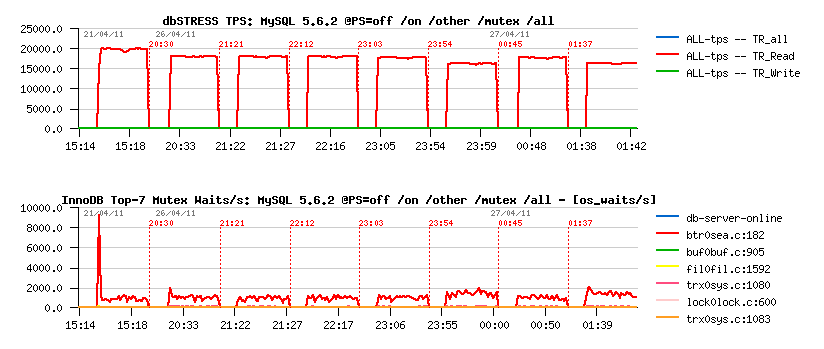
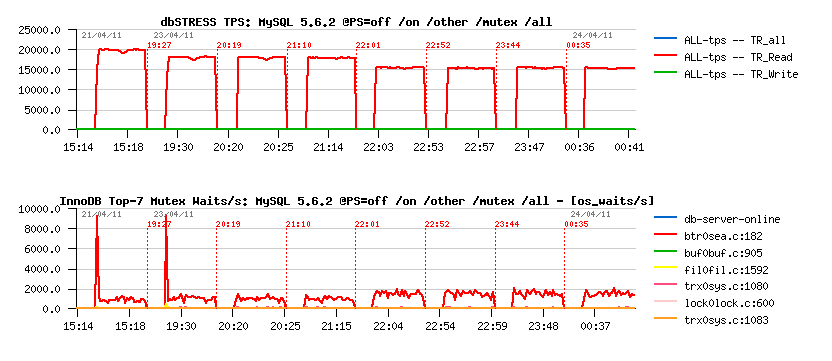
The first graph is representing TPS level, and the second one "mutex waits" reported by InnoDB (via show mutex status)
Only General Instrumentation
Read-Only:
Read+Update:

Read+Write:

Including Thread Instrumentation
Read-Only:
Read+Update:

Read+Write:

SUMMARY
Read-Only Workload:
- 10% performance degradation just by enabling Performance Schema (even with all CONSUMERS=OFF)
- few more % if mutex counters are monitored
- 20% if mutex counters and times are monitored
- if thread instrumentation is enabled, even enabling mutex counters monitoring gives 25% performance degradation..
- looks like the contention is increasing on "btr_search_latch" (and it's the main wait event reported by P_S)
Read+Update:
- 11% performance degradation just due P_S=ON (while all CONSUMERS=OFF)
- same degradation with non-mutex monitoring
- 14% if mutex counters are monitored..
- 20% if mutex times are monitored..
- 25% if thread instrumentation is enabled..
- same "btr_search_latch" mutex contention seems to be increased (and also reported by P_S as the main wait event)
Read+Write:
- Read+Write workload looks like the most confusing here.. - seems the "index mutex" contention is amplified a lot once P_S is used
- I've got even a case when 50% performance regression was observed by a simple P_S=ON and all CONSUMERS=OFF, but it was only once, and as "index mutex" contention may vary depending on pages/data distribution, I've replayed same tests many times over many days to get a repeatable cases..
- so, 10% performance degradation just due P_S=ON (while all CONSUMERS=OFF)
- 50% performance degradation if any instrumentation is enabled - and this one is really bad.. - and another bad thing is that "index mutex" seems to be completely missed within P_S wait events!! - get a look on the following outputs:
After 15min of Read+Write activity:
- Global instrumentation enabled only & only counters:
mysql> select EVENT_NAME, COUNT_STAR, SUM_TIMER_WAIT
    from events_waits_summary_global_by_event_name  where COUNT_STAR > 0 order by 2 desc limit 9;
+-----------------------------------------------+------------+----------------+
| EVENT_NAME                                    | COUNT_STAR | SUM_TIMER_WAIT |
+-----------------------------------------------+------------+----------------+
| wait/synch/rwlock/innodb/btr_search_latch     |  194213885 |              0 |
| wait/synch/mutex/sql/THD::LOCK_thd_data       |  130483762 |              0 |
| wait/synch/rwlock/sql/MDL_lock::rwlock        |  117961162 |              0 |
| wait/synch/mutex/innodb/log_sys_mutex         |   99512532 |              0 |
| wait/synch/rwlock/innodb/trx_sys_lock         |   99232511 |              0 |
| wait/synch/mutex/innodb/lock_mutex            |   90526333 |              0 |
| wait/synch/mutex/innodb/trx_mutex             |   85860887 |              0 |
| wait/synch/mutex/innodb/os_mutex              |   75809522 |              0 |
| wait/synch/mutex/innodb/log_flush_order_mutex |   70425453 |              0 |
+-----------------------------------------------+------------+----------------+
- Now the same but also with TIMED=ON:
mysql> select EVENT_NAME, COUNT_STAR, SUM_TIMER_WAIT
    from events_waits_summary_global_by_event_name  where COUNT_STAR > 0 order by 3 desc limit 9;
+-------------------------------------------+------------+------------------+
| EVENT_NAME                                | COUNT_STAR | SUM_TIMER_WAIT   |
+-------------------------------------------+------------+------------------+
| wait/synch/rwlock/innodb/btr_search_latch |  181682131 | 1643655865693815 |
| wait/synch/mutex/innodb/log_sys_mutex     |   98647709 | 1575232422898909 |
| wait/synch/mutex/innodb/lock_mutex        |   90097450 |  511454993752395 |
| wait/io/file/innodb/innodb_log_file       |   16497696 |  338811884697501 |
| wait/synch/rwlock/innodb/trx_sys_lock     |   98949223 |  199377660204555 |
| wait/synch/mutex/sql/MDL_map::mutex       |   36595181 |   89693003023907 |
| wait/synch/rwlock/sql/MDL_lock::rwlock    |  117280165 |   74224835060149 |
| wait/synch/mutex/sql/LOCK_open            |   66895239 |   68799893812315 |
| wait/synch/mutex/innodb/os_mutex          |   75309279 |   59309074401932 |
+-------------------------------------------+------------+------------------+
As you can see, "index mutex" is not present here within top 9 wait
events even in counters (while InnoDB is reporting it to be the mutex
with the higher waits).. - that's why I think this mutex is simply
missed within P_S accounting (should be easy to fix I think). In
parallel, it's interesting to remark that time spent on waits on
"log_sys_mutex" is similar to time of "btr_search_latch" !! - while
there is 2 times more waits on the "btr_search_latch".. - it's a clear
advantage of P_S potential to report true contentions over a whole MySQL
code, but before it'll become "usable" the overhead should be fixed
first..
So far:
-
there is no any reason to have %10 performance degradation just by
enabling Performance Schema while all CONSUMERS are disabled - should
be fixed, 10% is too much, 2% will be acceptable (and it was already
so in "prototype")..
-
there should be no mutexes (from MySQL or InnoDB) missed within
Performance Schema instrumentation, otherwise we're not observing a
whole picture of wait events and may get a wrong conclusion ("index
mutex" is one of examples)..
- also, I don't think having all instrumentations enabled "by default" is a good idea!! - I think by default only global instrumentation + counters should be enabled and nothing else! - it'll avoid unexpected surprises from users who just started MySQL with P_S=on without looking too much into details about and just was told that P_S is cool :-) (same like InnoDB is a default engine now instead of MyISAM)..
Then, I'm very sorry to be not as fast on writing as I'd prefer, if I've published this article sooner it'd probably reduce work for Vadim to measure Performance Schema overhead and save some money for a "Well Know Social Network" :-)) - but it was so hard for me to believe there is a problem again within P_S code that I firstly suspected my own workloads rather P_S itself.. - and only once I was sure about repeatable results I was ready to publish them (but again, I'm not writing fast enough :-))..
Well, as I've already saw Performance Schema working really well, I think it's now only a question of time to get it fixed.. ;-))
Tuesday, 12 April, 2011
MySQL Performance: 5.6 Notes, part 5 - Fixing Adaptive Flushing..
This is the 5th part of the MySQL 5.6 Performance Notes started from here.
Adaptive Flushing implementation is maybe one of the hottest topics discussed around MySQL 5.5 and InnoDB performance (and even way before 5.5) - if you will "google" for "furious flushing" you'll find many interesting things.. But well, the problem is still here for the moment, in 5.6 too, even if 5.6 is looking much more better facing it.. But well, it'll be great to fix it and then forget about.. - I think it's a time now, no?.. :-))
Fixing Adaptive Flushing in MySQL 5.6.2
Honestly, it's a pity to see Adaptive Flushing to be not so "adaptive" within MySQL 5.5 and 5.6 for the moment.. I very hope this situation will change very soon ;-)) And as there will be many versions of the "fix" to consider, here is mine..
First of all, let me summarize all previous discussions I've already presented in the past in various blog posts and benchmark reports, and try to finalize it now into a "something".. ;-)) I don't think there is something new in understanding of the problem, but a short summary will help to be aligned with a proposed solution :-))
What is the real problem with all this flushing issues?.. - The true problem is a presence of "furious flushing" when InnoDB is starting to flush too much at some moments and independently to the load that the whole "user land" work is freezing.. Then, what is the real source of the problem with a "furious flushing"?.. - the problem is coming from the state when InnoDB is realizing that it's short in free space within REDO logs and it needs to flush the oldest pages as soon as possible to make a room of free space.. - there is a very good overview with nice pictures about this situation presented by Vadim in his recent blog post (http://www.mysqlperformanceblog.com/2011/04/04/innodb-flushing-theory-and-solutions/) - so to summarize in few words:
- The goal is to "never leave Checkpoint Age to out-pass Async limit" within InnoDB !..
Now, how can we achieve it?.. - and there are 2 self-barriers:
Barrier #1: we have to flush fast enough to keep oldest page modification within a room of Checkpoint Age before Async..
Barrier #2: I may imagine the situation that we're unable to flush as fast as we're writing REDO logs due storage limitations (HW problem) - in this case we have to slow down REDO writes too keep equilibrium.. - Personally I never meet such a situation, but looks like we can now track it with P_S and at least point on when it happens, but then should keep in mind and have a solution to prevent out-passing Async limit..
There is still another issue which may also involve an intensive flushing following by freeze of user sessions - it's LRU flushing (when you have to flush oldest dirty pages to make a room of free space within a Buffer Pool), but with introducing on the Page Scanner thread since 5.6 this problem should be gone.. (need yet to be tested)..
Now all about #1 Barrier..
When we're flushing?..
- Adaptive flushing: should be "adaptive", so an average flushing, not too hard, not too slow, just as needed..
- Dirty pages max percentage: 100% IO capacity, may be hard..
- Async (short in free REDO logs space): very aggressive, but non blocking..
- Sync (very short in free REDO logs space): very aggressive, blocking all..
It's clear that Sync and Async flushing are not our friends :-))
For a "normal tuning" we have only Dirty pages percentage and Adaptive flushing to play with.
Dirty pages: globally it's not a problem to have many dirty pages within InnoDB Buffer Pool - all changes are secured by REDO log records, and there is no really need to urge to flush them until we're not too short with free space in REDO logs.. But with 32GB or 64GB Buffer Pools we may keep way more dirty pages than corresponding records can be kept within 4GB REDO log space.. So, with a big Buffer Pool sizes we probably may never see max dirty pages level hitting its max as the flushing may be involved way ahead via Async or Sync flushing (due REDO space).. - and we get "furious flushing"..
Then it's still possible to set the Max Dirty pages percentage too low, but it'll be hard to find an optimal value for it as the load may vary, and flushing may become more aggressive in other conditions..
And it's still possible to increase the max 4GB limit for REDO logs and it'll help - as the Async limit will be more far, and then reaching Max Dirty pages percentage we'll flush for sure! - however this flushing may be quite aggressive as it'll involve a 100% IO capacity burst.. - but still better than "furious flushing" :-))
Adaptive Flushing, however, should play the best role here as an option, but what is a difficulty to implement?..
First of all, it's hard to estimate a number of dirty pages corresponding to N records in REDO log.. - for ex. for 2000 REDO records there may be 2000 modified pages or one single page with 2000 in place modifications, or 20 pages with 100 modified rows in each :-))
When your modifications are widely spread over pages, there will be maybe even no need to have too big REDO logs to keep their changes as as soon as you you'll read new pages into your Buffer Pool you'll hit the Max Dirty pages percentage or will be short in free pages within your Buffer Pool and will hit LRU flushing - and in both cases your Checkpoint Age will be still be far away from the Async limit and "furious flushing" will never happen (and as LRU flushing is involved by Pages Scanner since 5.6 it'll not involve any freeze on user threads anymore)..
So, the real problem is coming only in cases when the changes are "focused" on some amount of pages and the dirty pages number remaining still low, while the Checkpoint Age may grow fast.. - having a bigger than 4GB REDO log space will help here as it'll avoid to flush pages before the "focus" did not move to other pages (and then previously modified pages will be flushed only once instead of being flushed per each modification for ex.).. However if the "focus" is not moving, we'll still reach the Async limit even with a bigger than 4GB REDO logs - each space has its limits :-))
To summarize:
- Max Dirty pages percentage will guarantee ahead flushing if modifications are not "focused"
- Over 4GB REDO logs will reduce flushing operations of "focused" modification
- Adaptive flushing should keep flushing active in cases where Max Dirty pages percentage will not work..
So, what is wrong with Adaptive Flushing?..
As said before, it's hard to "estimate" the correspondence between dirty pages and REDO records.. - and it's what we're trying to do (and Percona in some cases).. And finally why try to "estimate" something which is completely random??..
I think that instead of estimation we should simply "adapt" our flushing speed according "observations" on the Checkpoint Age and Max Dirty pages percentage:
Avoid a 100% IO capacity burst flushing due Max Dirty pages percentage:
- when Dirty pages percentage is reaching 1/4 of Max we may already involve a 5% IO capacity flush
- for 1/2 of Max => 25% of IO capacity
- and so on..
Then on Checkpoint Age:
- let's keep the 1/2 before Async limit as a Goal (G-point)
- also we have to track the LSN speed of REDO writes (accounted as AVG over current and past changes)
- then up to G-point we may adapt flushing progressively from 1 to 100% of IO capacity
- so, on G-point we're flushing 100% IO capacity
- then on each flush request we have to precise the max LSN (instead of "max integer" currently) to flush just as needed according the AVG LSN speed..
- then since Checkpoint Age is out-passing G-point, the flushing speed is increased with acceleration, say: flushing= IO_capacity + IO_capacity * P * P / 10 (where P is a percentage of out-passing G-point, so if we'll reach Async limit it'll be with 11x times of IO capacity)
- then if on 70% of out-passing of G-point we still observing Checkpoint Age growing, then we may suppose the storage subsystem is unable to keep required write load and it's time to slow down REDO log writes to avoid Async flushing... (Barrier #2)
Why G-point is on the half-path to the Async limit?.. - I simply think about every DBA and Performance Consultants who will try to tune MySQL in production according their observations.. - such a tuning should be "simple" and predictable and not based on some kind of "magic calculation" which in some cases working, in some cases not..
So, what it'll be such a tuning like?..
- IO capacity setting is involved within many "maintenance" tasks such as light background flushing when activity is low, etc..
- REDO log size 4GB limitation will be gone since the next 5.6 version (code is already in the public trunk)..
- then you simply know that once Checkpoint Age is reaching the half of the Async limit your database is already involving a flushing on 100% IO capacity speed..
-
and then you have 2 options:
- you're monitoring yourself your database and if Checkpoint Age remaining always low you may simply decrease the IO capacity to reduce flushing (IO capacity is a dynamic option) NOTE: as we'll also track LSN speed over time within Adaptive Flushing code, in any case it will not flush a bigger amount of pages than the age shift corresponding to the LSN speed..
- or use an "auto" option, and leave Adaptive Flushing to auto-adaptively decrease its "own" IO capacity to keep Checkpoint on G-point, or increase it up to the "configured" IO capacity if the load is growing.. - but at any moment you may monitor its "own" IO capacity and correct it if needed
(partially I've already published the results with it before on 5.5: http://dimitrik.free.fr/blog/archives/2010/07/mysql-performance-innodb-io-capacity-flushing.html - it's just a continuation..)
Let's see now how well it works with 5.6 now.. ;-)
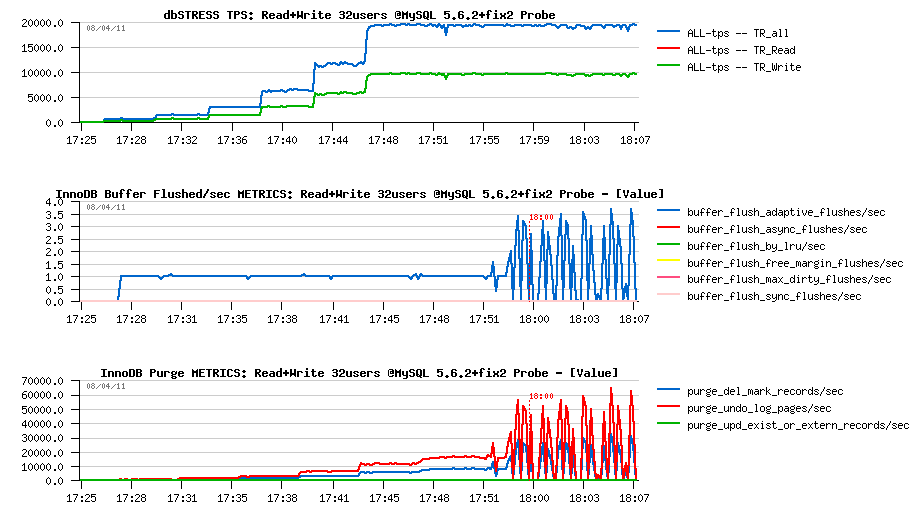
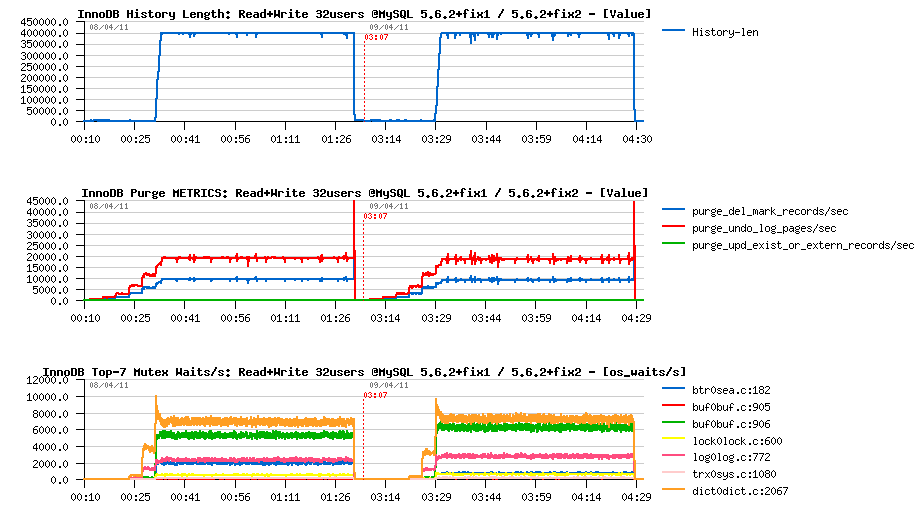
First Probe on 32 users Read+Write test
First probe test gave me the same performance level as before, but completely eliminated any presence of async flushing!! However, time ti time I've also observed flush calls burst which were also aligned with purged pages burst.. - Initially I've suspected there is something wrong with server "activity" counter increments (which is now a function since 5.6) and it looked like fixed the issue, but then I've observed it again and supposed that it's possible that something is wrong with METRICS table.. - well, it's a point yet to investigate :-) because according the I/O activity there was no purge burst for example..
But well, let's call it now "fix2" (so, "fix2" is including "fix1" too) and compare the changes..
Comparing fix2 improvements
First observations :
- async flushing is gone!
- performance is slightly lower due a higher I/O activity..
- Checkpoint Age is stable and probably may be bigger, but I'll keep the same IO capacity setting to be compatible with all previous tests too
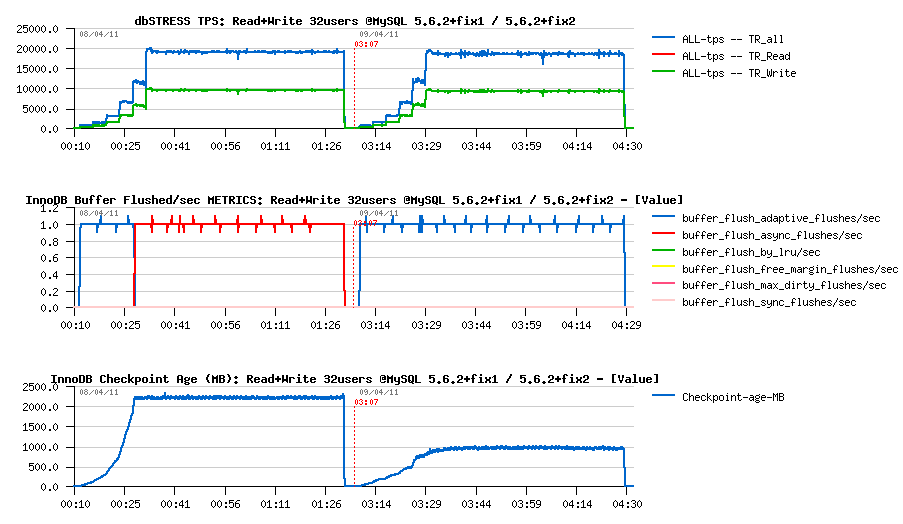
Next :
- max purge lag is still 400K, so the History Length remains stable..
- purge activity also remains the same..
- interesting that contention on "btr_search_latch" was reduced.. ;-))
I/O Level :
- however, my SSD disk is looking too fast.. - it's accepting burst writes as well as a constant write load
- at least we may see the write bursts are not present either..
- and it's quite strange to see the disk to be not busy at all.. - what a progress in technology ;-))

Well, time for a full test now.. :-)
Full Test on 1-256 users
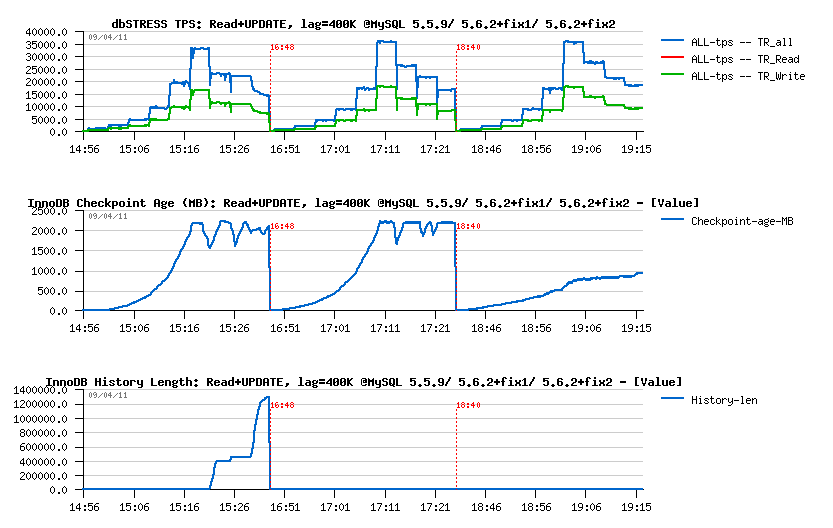
Let's compare now 5.5.9, 5.6.2+fix1 and 5.6.2+fix2 on a higher workload - will run the test only up to 256 users to make it shorter. What is important: all databases are running with innodb_max_purge_lag=400000 setting, so let's see what the result will be on the forced to work correctly configuration..
-
Read+UPDATE:
- Performance on 5.6 is better than on 5.5, then "fix2" is removing drops and, curiously, even slightly improving performance
- Only 5.6 is keeping History Length low.. - interesting
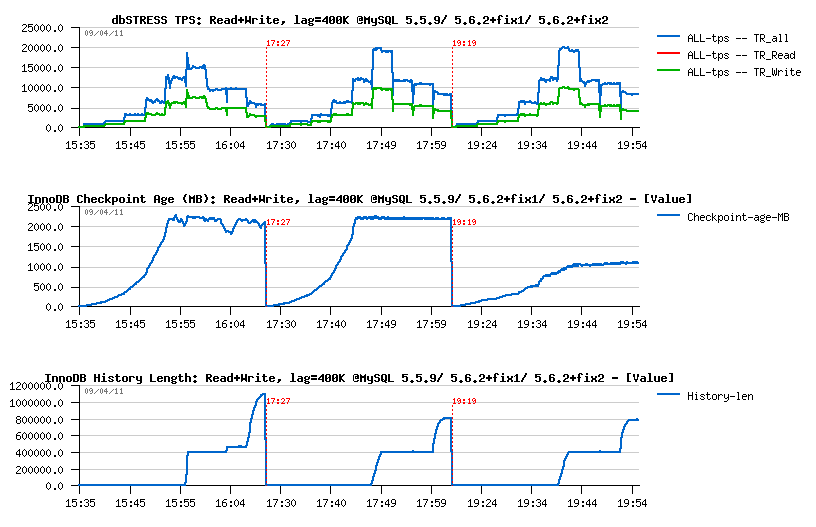
-
Read+Write:
- Performance gain is even more important here on 5.6 as 5.5 was able to keep only 16K TPS on 32 users
- Then, seems like on 5.5 History Length is continuing to grow (need to run on 256 users longer to see if it'll reach some stable level or still not..) - while 5.6 seems to find a purge stability much more easier..
- Interesting also that on 5.6.2+fix2 the Checkpoint age is not changing too much with a growing load.. - looks like SSD performance helps a lot here ;-))
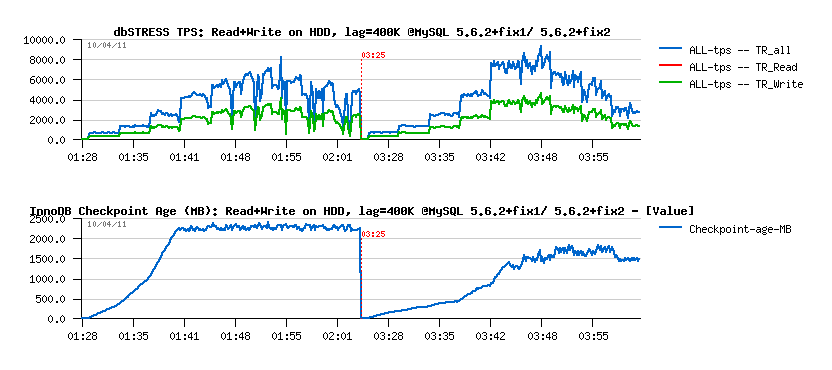
Looking on like SSD is helping, I've executed the same Read+Write test, but placing my data on a RAID with simple disks (software RAID, no controller or cache) - just for fun and to see what will be the difference..
Read+Write Test on HDD
Observations :
- we're far away now from previously seen 20.000 TPS :-) as there is only 9.000 TPS in peak, but in stable max is only 8.000 TPS..
- "fix2" is giving still a more stable performance, but it's also higher! (slightly surprised here)
- even the disks are slow, there is still no async flushing..
Well, I still have many questions here and have to run more tests to clarify things and see if there will be no any background issues, but already what I saw is looking very positive! :-))
And InnoDB team is already progressing in fix of these issues!..
To summarize :
- purge problem is confirmed, fix is available and coming with next 5.6 version
- adaptive flushing improvement: work in progress..
- the reason of contention on "btr_search_latch" was found, work in progress..
- "trx_sys": work in progress, very promising probe results..
- sync array: work in progress, very promising results too..
- there are also other locks became more hot since the "kernel_mutex" contention gone..
It's the final part of the series of "MySQL 5.6 Performance Notes" (other parts are here: 1 , 2 , 3 , 4 )
Any comments are welcome! And if you're lucky to be currently in Orlando, you may come and ask your questions directly - tomorrow I'm presenting "Demystified MySQL Performance Tuning" session Wed, 13th Apr at 10:30am, #305B room.
MySQL Performance: 5.6 Notes, part 4 - Fixing Purge issue..
This is the 4th part of the MySQL 5.6 Performance Notes started from here.
All about Purge now.. ;-))
Fixing the Purge issue in MySQL 5.6.2
Sunny is a "purge guru" within InnoDB team, and he pointed me to the code which is currently commented as "FIXME" in 5.6.2: in the current code the purge is involved periodically after short sleeps, and the sleep delay was chosen too big (as it's yet experimental and more testing is expected before to get its final implementation available). Currently Sunny has at least two solutions for the next 5.6 version, however I wanted to see 5.6.2 fixed near "as it" with minimal changes (if possible) and simply replaced the 60ms sleep delay by zero (never sleep until there is something to purge, as it was in the original InnoDB code). This small change make me much more happy because it made a huge difference! ;-))
NOTE: my 48 cores AMD server crashed finally due HW issues, so all the following testing was executed on the 32 cores Intel server..
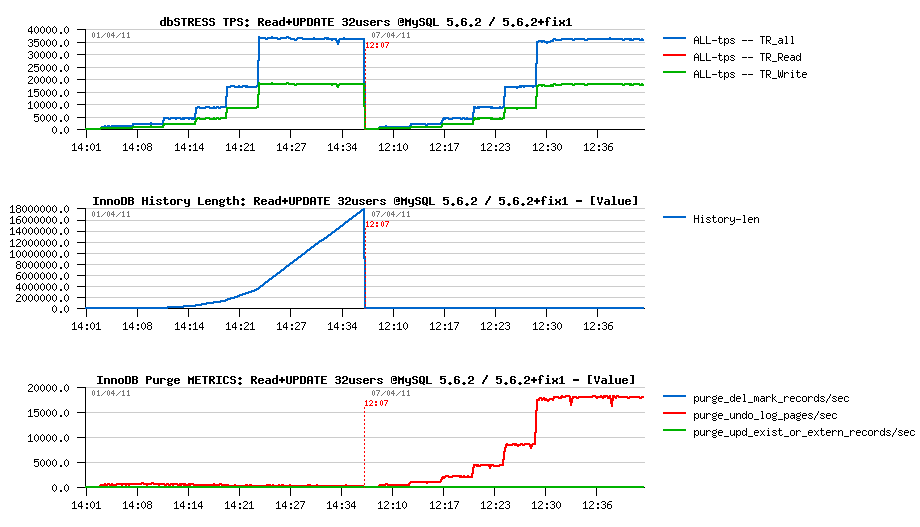
Read+UPDATE Workload
Already on Read+Update workload was seen that the fix worked pretty well - on the following graphs I've compared the original 5.6.2 version vs 5.6.2 with a "fixed" purge code (let's call it 5.6.2+fix1), and as you can see:
- History Length is not growing anymore (similar to 5.5 now)
- Purge activity reported from METRICS table growing now with a growing workload!!
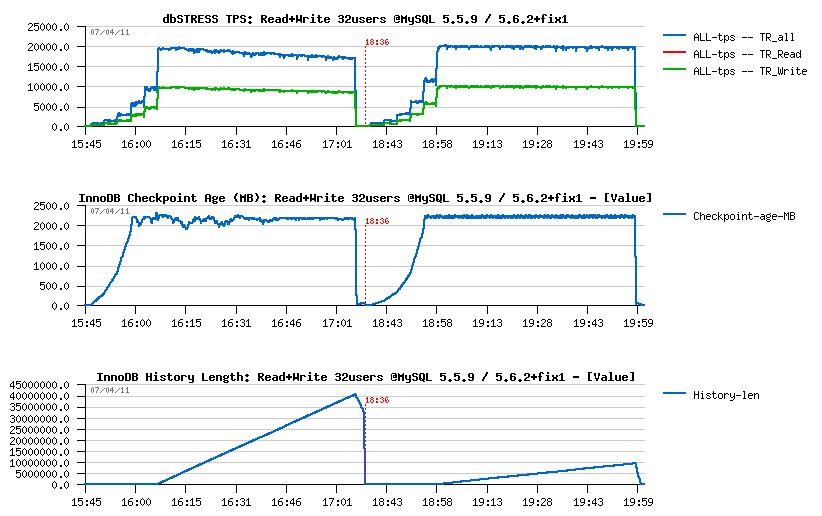
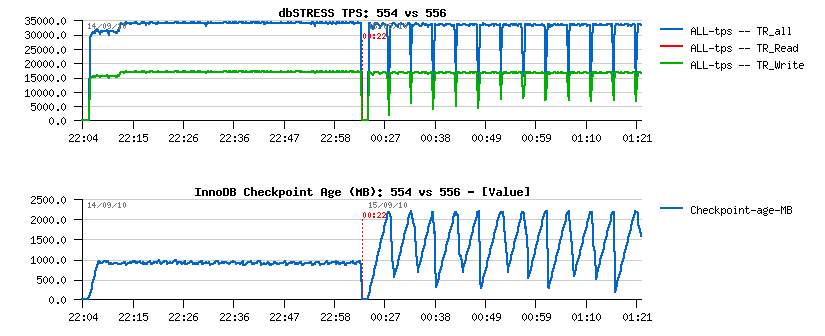
Comparing with 5.5.9 on Read+Write
On Read+Write workload the thing become more interesting:
- on 32 concurrent sessions 5.6.2 is reaching 20K TPS level and keeping it stable till the end of the test (one hour), while 5.5.9 is also reaching 20K TPS on the beginning, but then slowly decreasing performance and within one hour reaching already only 16K TPS..
- then another thing which is very important - History Length is growing slower now on 5.6.2+fix2 comparing to 5.5.9: within one hour it reached 10M level while 5.5.9 grown up to 40M!.. - it's a true victory of the 5.6.2 implementation, because its superior performance was not because of a lowering purge activity.. ;-)) (if you disable purge completely within InnoDB you may get a very important performance improvement, but then very quickly "un-purged" data will makes troubles for you, so having a database in production with a constantly growing History List is not acceptable.. - that's why during benchmark testing it's important to monitor purge lag to avoid any kind of "wrong tuning" :-))
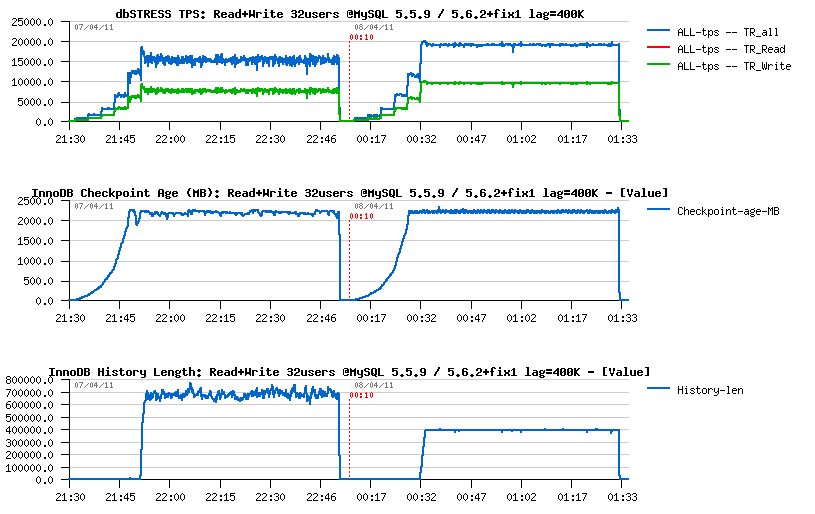
And now with innodb_max_purge_lag=400K
As in the previous test the purge lag is still continuously growing, what will be a difference once we'll apply the Max Purge Lag setting?.. The following graphs are representing the same Read+Write test but now with innodb_max_purge_lag=400000:
- on 32 sessions 5.5.9 keeps a stable 16K TPS level until the end of the test, while 5.6.2+fix1 keeps 19.5K TPS within the same conditions, and we're loosing really few in performance (2.5% only) while improving a lot in purge stability!
- NOTE: there was something wrong with 5.5.9 code because its History Length out-passed 400K, but it should not happen, but it did not grow for sure, so I did not retest it..
So far, Purge issue is fixed, but for a real stable work we need to get Adaptive Flushing fixed too :-))
To be continued in part 5...
Monday, 11 April, 2011
MySQL Performance: 5.6 Notes, part 3 - More in depth..
This is the third part of the MySQL 5.6 Performance Notes started from here.
Now let's get more in depth and analyze performance results on more "focused" workload scenarios.. - for the moment MySQL/InnoDB is scaling up on 32 cores and most optimally working with up to 32 concurrent sessions where no any severe contention is not yet happening. So the 32 users workload on 32 cores will enter in the focus in the following part, but this time it's a full troubleshooting rather benchmarking.. ;-))
NOTE: there was a question what is the difference between "Read+UPDATE" vs "Read+Write" test? - "Read+Write" is doing 3 DML queries within a one operation (in reality there are 3 transactions within 1 Write) - DELETE, INSERT and UPDATE. While "Read+UPDATE" is executing only UPDATE query within Write operation, that's why to keep in mind this difference I'm calling it "Read+UPDATE".. - and one moment is very important within an UPDATE query used in this test: it's involving "in place" modification of data and without touching any index, so it fires at once any potential issues (if any) in purge, as there is only UNDO images to purge, and it "plays" with different InnoDB internal contentions as well ;-))
Analyzing Read+Write Workload @32users
Test scenario :
- Workloads: Read-Only (just warmup), Read+Update, Read+Write (Write = Delete + Insert + Update)
- Configurations: 32 cores
- Concurrent users: 32 (running 20min on each RW test, constant load)
- Think time: 0 sec
-
Points of interest :
- there is no yet any serious mutex contention on the 32 users workload, so the main interest here to verify that MySQL/InnoDB is running as expected:
- Checkpoint Age: should remain stable on such a stable workload
- TPS: should remain stable too, no "furious flushing"
- History Length: should remain low (or zero), and in any case should not grow!..
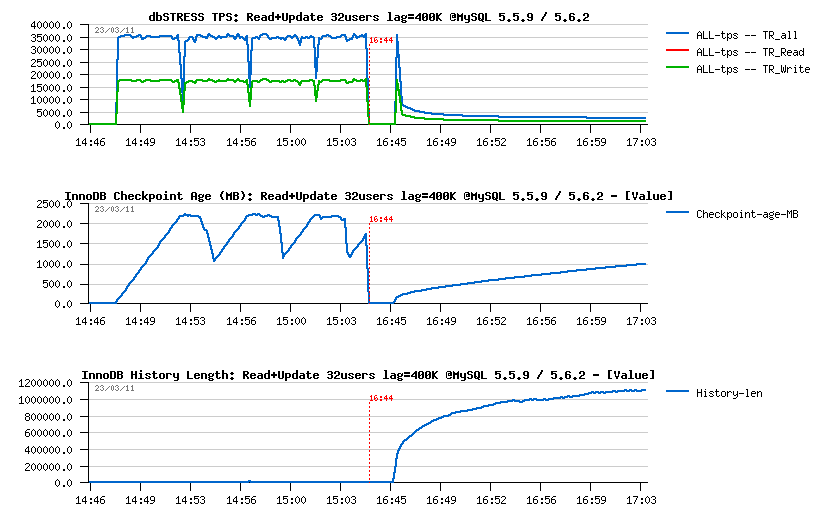
Read+Update Workload :
 Observations
:
Observations
:
- MySQL 5.5 has constant periodic performance drops due a "furious flushing", while MySQL 5.6 has these drops only on the beginning (but much more severe, and this severity is amplified by the presence of contention on the "log_sys" mutex..) - once it's passed, performance on 5.6 is looking more stable..
- Only 5.6 have a History Length growing here.. - not good at all..
- TPS level looks the same on all engines, but results on 5.6 may be different due a lower purging..
- NOTE: using 2 or 4 purge threads in MySQL 5.6 did not change absolutely nothing..
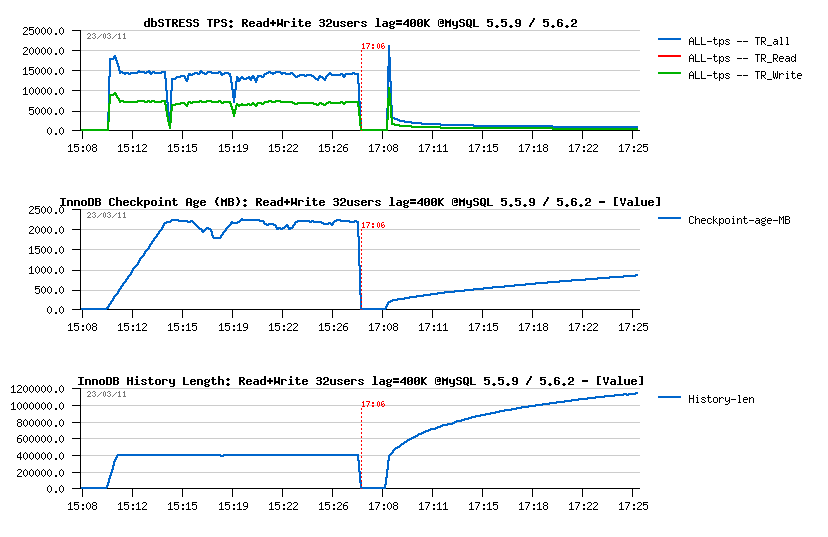
Read+Write Workload :
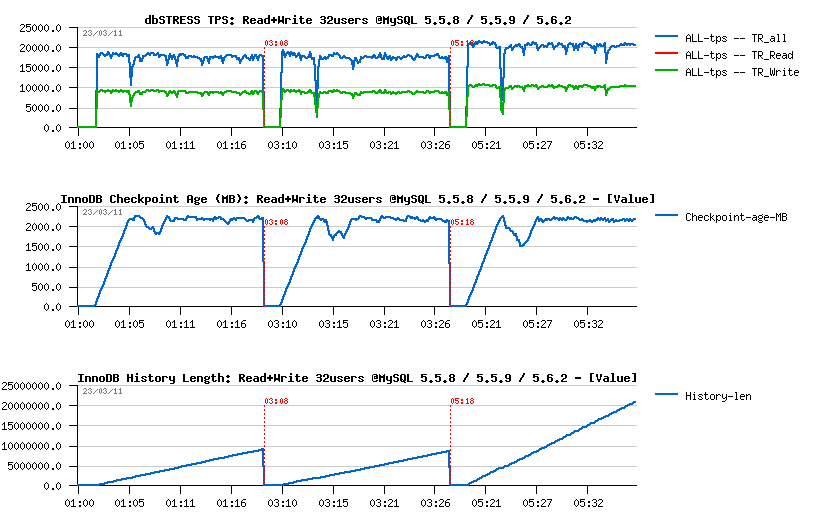 Observations
:
Observations
:
- both MySQL 5.5 and 5.6 having a performance drop on the beginning, this drop is less seen in 5.5.8 comparing to others..
- both 5.5 and 5.6 are having History Length growing, however i nMySQL 5.6 it's growing x2 times faster!! (not good for both)
- TPS level in 5.6 is higher comparing to others, but it's probably just due a lower purging..
- NOTE: using 2 or 4 purge threads in MySQL 5.6 did not change absolutely nothing..
- NOTE: so, after only 20min of activity we reaching a level of 20M(!) records in the History Length! - then, once the test is finished, it takes over 5min of constant aggressive background flushing before the History Length become zero and dirty pages too.. - and to be able to keep all these non-purged data the whole database size after all my tests was increased from 50GB to 72GB.. (near 50% bigger!)
Note about Adaptive Flushing in MySQL 5.5 - since 5.5.6 release the InnoDB adaptive flushing became more "relaxed" comparing to 5.5.4 version, and seems this behavior remain the same up to the MySQL 5.5.9 (and MySQL 5.6 need yet to be investigated).. The "relaxed" nature of the flushing in 5.5.6 I've reported before in my MySQL 5.5 Notes and the following graph explaining very well the issue:
Personally, I'd prefer a more "aggressive" flushing rather "relaxed", but nobody is perfect ;-))
But well, since adaptive flushing is not flushing enough to avoid "furious flushing", we may still increase the flushing by lowering the percentage of dirty pages setting (and again, it'll be more optimal to simply increase the size of the redo log files, but this feature will be available only in the next 5.6 release..)
So, my current dirty pages percentage setting is 50%. What if I'll set it now to 10%? then 20%?..
Read+Update :
- 50% was not enough..
- 10% is probably too much..
- 20% is looking better ;-)
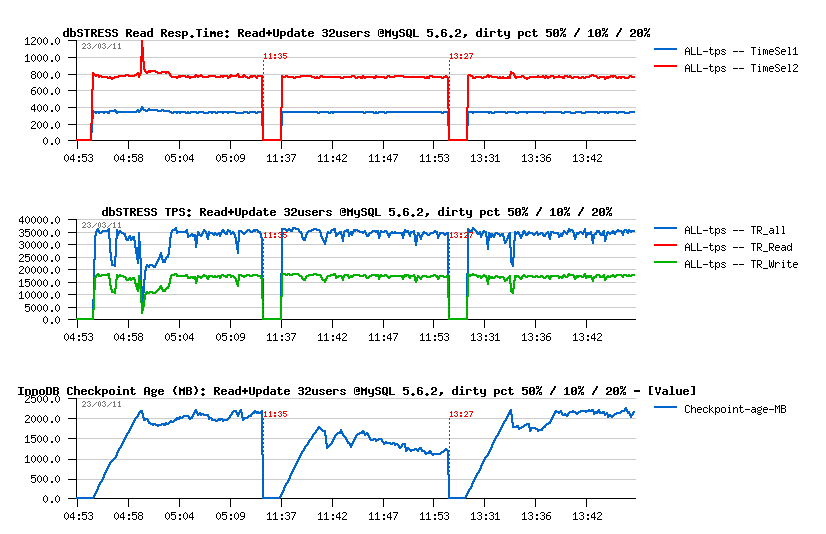
Read+Write :
- 50% was finally not so bad.. ;-))
- 10% - is really too much, even performance become worse..
- 20% - not better either..
- NOTE: History Length continues to grow within all tests, not good..
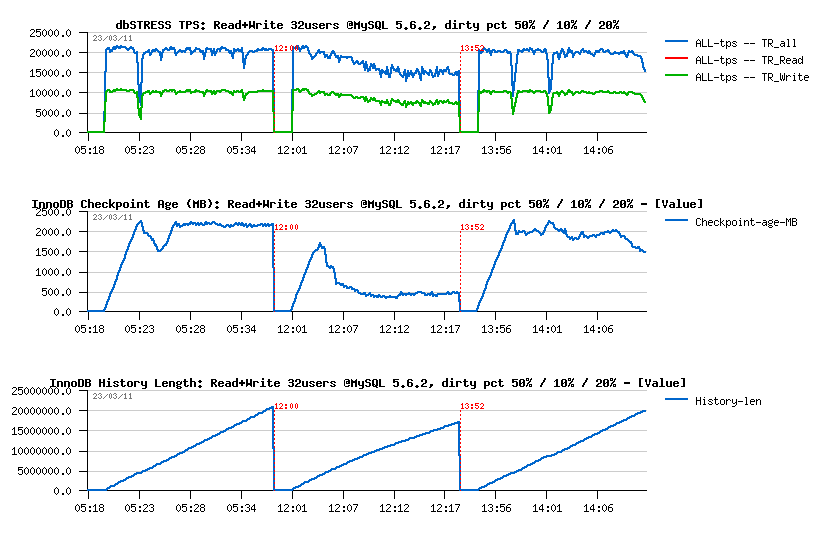
Well, seems like by lowering a dirty pages percentage we may bring more stability in workload, but of course it'll be better to have adaptive flushing working correctly to avoid such a tweaking :-)) Another possible solutions:
- reduce redo logs (it'll involve "furious flushing" more often, but it'll be shorter :-)) and of course performance will be worse (but stable :-)))
- increase redo log files way more (but it'll be possible only since next 5.6 version)..
- well, for the moment lowering dirty pages percentage is looking as more optimal..
Analyzing Purge Activity
Ok, so far and what about this growing History Length?.. - it's looking like we have an issue with a purge processing..
- Having purge thread enabled did not help..
- Having 2 purge threads did not help too..
- Having 4 purge threads did not help either..
So, there is a problem for sure.. And the only solution may help here is to use a "max purge lag" setting. But to make it working a little hacking is needed in the code - just to comment out the check for a presence of consistent read when the max purge lag condition is verified, otherwise it'll be never involved.. (BUG #60776 (http://bugs.mysql.com/bug.php?id=60776)). The idea of this feature is to delay DML statements for some milliseconds if the purging is not fast enough and cannot follow the workload activity (and bigger the lag is, a bigger delay will be used (calculated dynamically))..
I've "fixed" both MySQL 5.5.9 and 5.6.2 versions, and let's see now what is the result (in all following test I've used innodb_max_purge_lag=400000 (400K is quite big enough "normally", at least it's what I've used before in the previous tests in the past)..
Read+Update :
- There was no purge lagging on MySQL 5.5.9 during this test before, so it did not change anything for 5.5.9
- However, there is a real problem with 5.6.2 - History Length still out-passing 400K, and performance is dramatically dropped..
- As purge lag is continuing to grow in 5.6.2, I may suppose there is a huge problem within a purge code...
Read+Write :
- For MySQL 5.5.9 the "fix" is working: History Length remains stable on 400K, however it's not free - performance was reduced from ~20.000 to ~15.000 TPS.. - it's a price for a "stable" and as expected processing, and that's why any performance result obtained with a constantly growing purge lag should be simply ignored as a result...
- For MySQL 5.6.2 things are much worse again.. - TPS is x20 times lower and purge lag still continue to grow..
Seems more investigation is needed on the purge implementation within MySQL 5.6. There is a real problem here..
More in depth with Purge and Flushing issues
To get a more close look on the Purge and Flushing issues I'll change my test scenario to the following:
- Configurations: 32 cores
- Concurrent users: 1, 2, 4 .. 32
-
Workload:
- Read-Only (just warmup) but from 1 to 32 users, 4min each step
- Read+Update from 1 to 32 users, 4min each step, then keep 32 users running yet more for 20min
- Read+Write (Writes=Delete, Insert, Update) from 1 to 32 users, 4min each step, then keep 32 users running yet more for 60min
- Think time: 0 sec
-
Points of interest :
- I'm curious to see since which moment flushing and purge problems are appearing (and it'll be more a debugging here rather a testing, but there is no debugging possible without testing either ;-))
- All "key values" to monitor remaining the same (TPS, Checkpoint Age, History Length)
- Then I'll also add some additional stats coming from the newly available InnoDB METRICS table (since 5.6)
Also, in parallel, I've discovered that there may be some background effects due a data blocks moving when I'm testing 5.6 after 5.5 tests (as well it may be just a simple "feeling" without any objective reason :-)) - but anyway, all the following "debug" tests were executed on the freshly restored database from a zero state backup..
Let's get a look on the MSQL 5.5.9 performance first.
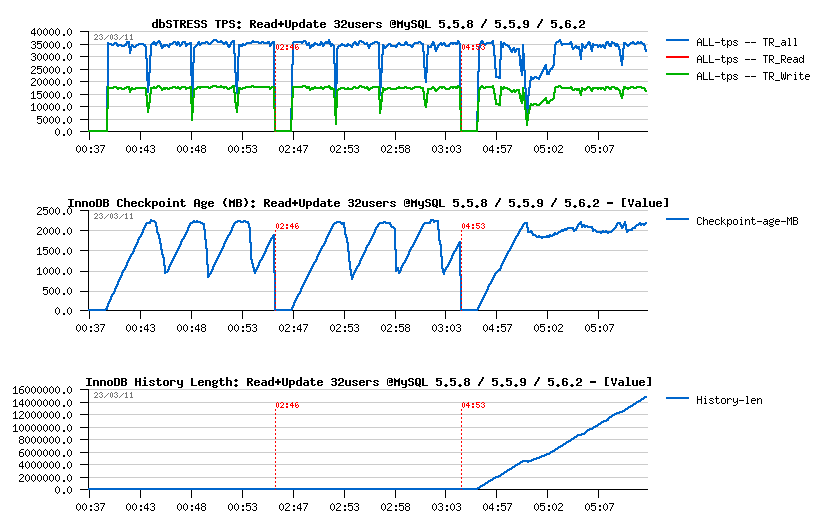
Read+Update Debug Workload @MySQL 5.5.9
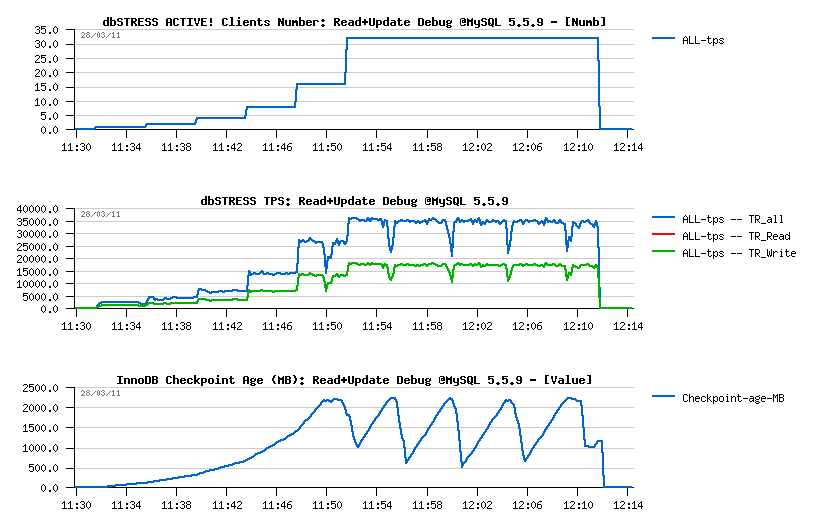
Observations :
- Number of concurrent users (Clients) is growing progressively from 1, 2, ... to 32, and TPS level continue to grow too..
- 35.000 TPS on 32 users as before I've observed last year on another server with 32 cores
- TPS drops are perfectly corresponding to the Checkpoint Age drops when we reaching a critical amount of REDO free space and the "furious" flushing is involved then.. - seems these drops are not having a bigger depth just because my storage is fast enough here..
- Adaptive FLushing is not looking here to be really adaptive.. - even on 16 users it already got its first performance drop.. - need a fix for sure!
Then, from the following graphs:
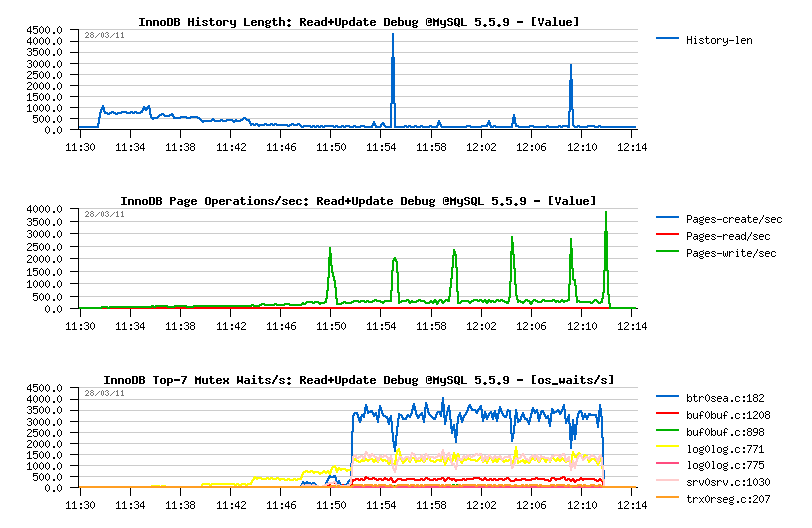
Observations :
- History Length remains very low and quite stable, so purge is working well..
-
Mutex waits:
- up to 32 concurrent users the main wait is on the "log_sys" mutex
- then since 32 users it's moving to the "btr_search_latch" mutex
- NOTE: once again "btr_search_latch" is present.. - while on this workload UPDATE is executed in place and not changing any indexed field.. - so the contention is coming mainly from the reads (as on the Read-Only workloads before), and once again all the data are already cached within a buffer pool, and there is no more page reads during this workload..
Except the adaptive flushing issue, Read+UPDATE workload still looks fine on MySQL 5.5.9.
Read+Write Debug Workload @MySQL 5.5.9
To make it shorter, I'm presenting 2 results on the same graph
- the first one is obtained with max purge lag configured to zero (default)
- the second one - with max purge lag = 400K (innodb_max_purge_lag=400000), NOTE: you'll need a fix applied from the (#BUG) to get purge lag DML delay working properly..
So far:
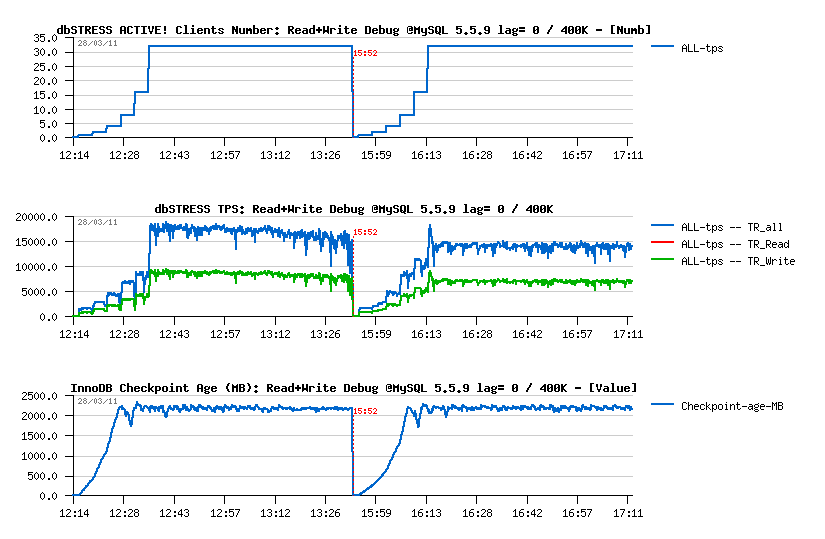
Observations :
- Adaptive flushing is still not optimal here, but the TPS drops shorter in depth..
- With a max purge lag=0 the max TPS level is higher, however it's not stable and continuing to decrease over a time from 18.000 to 16.000 TPS.. (interesting that on the "previous" server last year I've obtained 20.000 TPS on 32 users on the same workload)..
- Then having max purge lag=400K gives a lover performance - 14.000 TPS, but more stable result as there was no TPS degradation over a testing period (1 hour for 32 users)..
Then History Length graph is explaining all:
As you see:
- History Length remains stable on 400K during the second test, which is reducing overall work around pages operations..
- Page writes are lower and not growing in the second case too (so a flushing should be also more stable)..
- Interesting that the Mutex Waits pictures are also looking different: while contentions on buffer pool mutex and index mutex are presented in both cases, the second configuration is avoiding a growing contention on the kernel_mutex..
Well, globally using max purge lag=400K is quite benefit is you're not running for an "absolute max" possible performance, but seeking for a stable one like me ;-)) and after all comparing 16.000 TPS and 14.000 TPS it's just little bit more than 10% performance regression, however the gain in stability is simply huge! ;-))
And what about MySQL 5.6 now?..
Few comments first:
- I've increased the buffer pool size from 16G to 32G to avoid any LRU flushing issues during following tests (I'm not tracking it yet, so let's avoid to have more problems than expected ;-))
- New stats about Purge and Flushing activities were added from the InnoDB METRICS table newly integrated into MySQL 5.6
Read+UPDATE Debug Workload @MySQL 5.6.2
- First and very positive surprise - there is no any performance drops on MySQL 5.6.2 under this workload: (looks like using a freshly restored database for 5.6 makes a difference here)
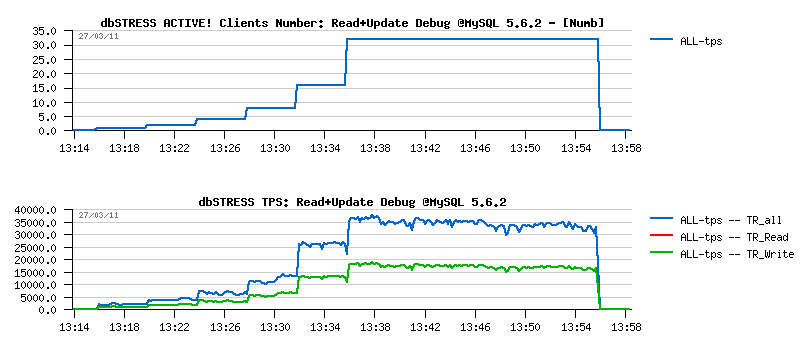
-
And it seems because of the "stable" adaptive flushing - Second
Surprise! :-)
- Checkpoint Age remains low
- Only 2 "async" flushes over all period! (stats are coming from METRICS):
-
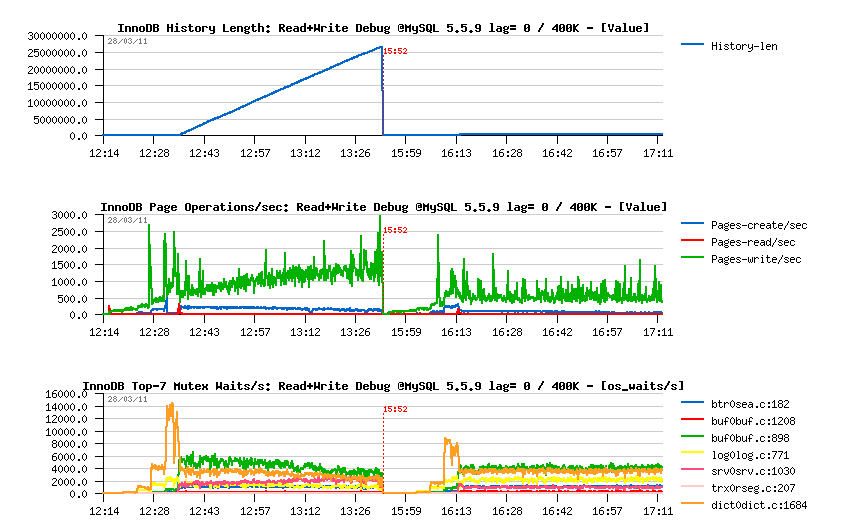
Then the Third, and very negative surprise - Purge is looking
like completely "absent"..
- History Length is constantly growing..
- Pages are manly purged at the end, once the workload is finished..
- It's clearly seen that purged "pages" as only undo log images (as there is no DELETE on this workload) - stats are obtained from the METRICS table:
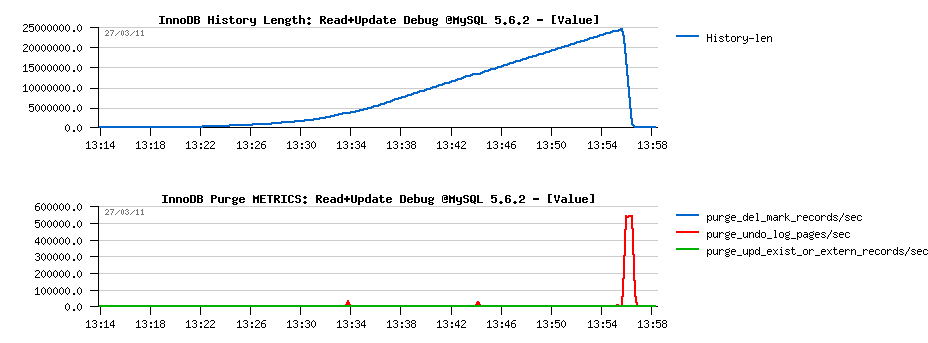
-
Then regarding Mutex Waits, it looks similar to 5.5.9, except:
- the "kernel_mutex" waits are no more present now..
- "log_sys" mutex is more seen now (normal)
- and interesting that "btr_search_latch" mutex contention is finally arriving here on the top position too..
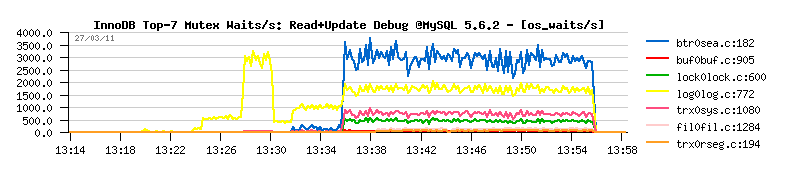
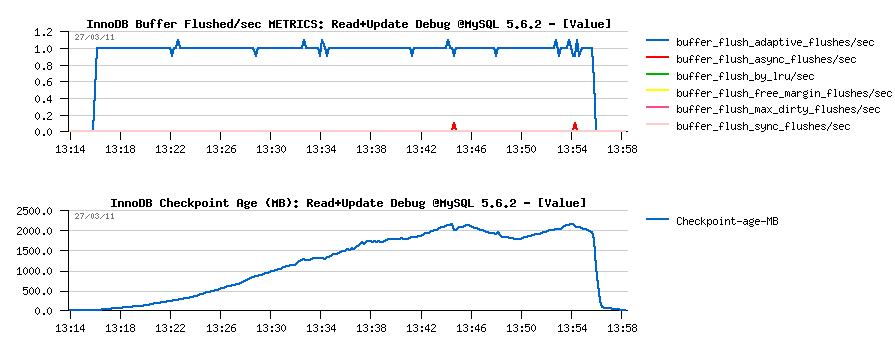
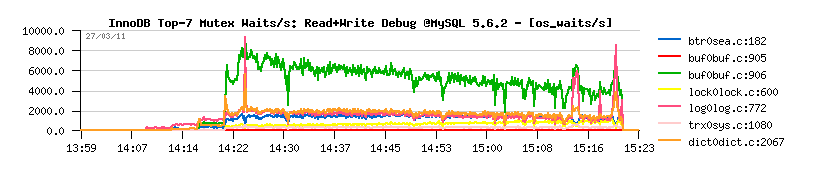
Read+Write Debug Workload @MySQL 5.6.2
-
Well, no surprise here about performance stability on this test:
- the only one thing is positive that TPS level looks higher than on 5.5.9, but it's very possible that it's just due a non purging..
- then TPS drops are well present..
- and TPS level is decreasing over a time:
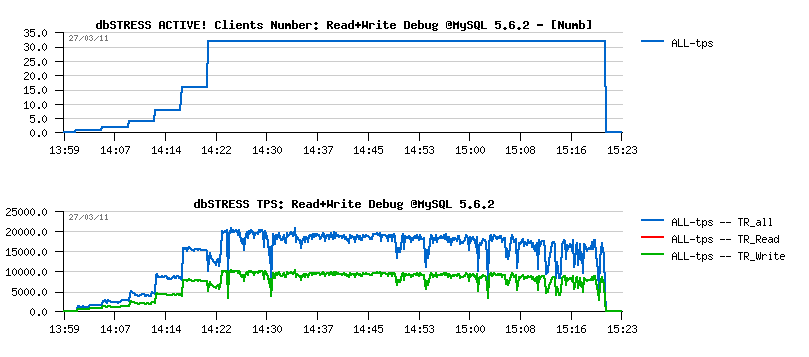
-
Flushing issue is well explained by flush related stats reported by
METRICS:
- adaptive flushing is well active, but seems simply to not flush enough..
- "async" flushing is involved every time when the free REDO space reached a critical level..
- note that there were several "async" calls to reduce the Checkpoint Age..
- interesting that there was no one "sync" call over all the test duration..
- well, it's clear there is a room for improvement for the adaptive flushing:
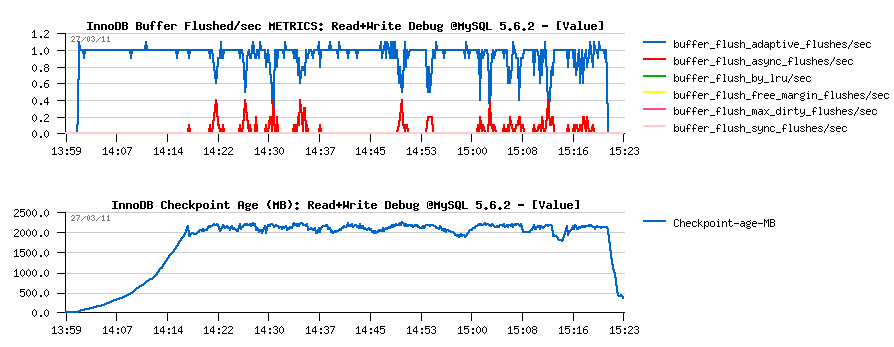
-
Then once again, Purge is giving an impression to be "absent":
- History Length is still growing over a test
- Purge activity is "waking up" at the end (what is interesting that "del mark" records are reported now by METRICS as there are DELETE statements within this workload):
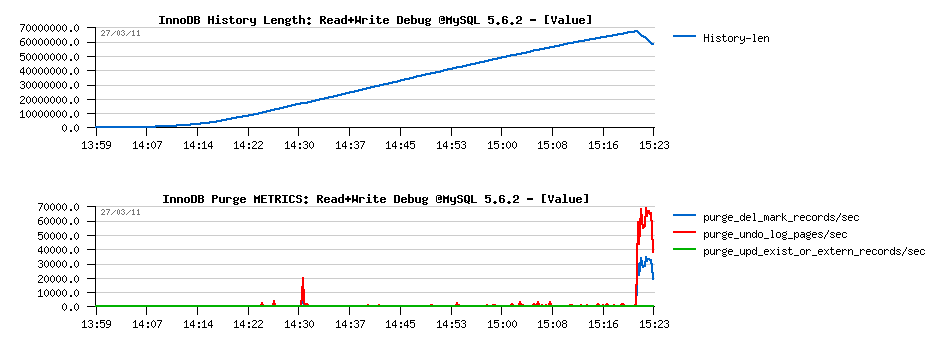
-
Curiously on the Mutex Waits:
- the top wait is a buffer pool "block mutex"
- and "trx_sys" mutex contention is not yet involved:
So far, if with Adaptive Flushing it's clear that in some cases it's simply not flushing enough and it should be just improved... - then regarding Purge there is something really going wrong and I have to get a look on it more closely.. It gives an "impression" to be "absent", but what kind of Purge activity we have on a single session?.. - still "absent"?.. on 2 sessions?.. 4?..
Let's get a look ;-)
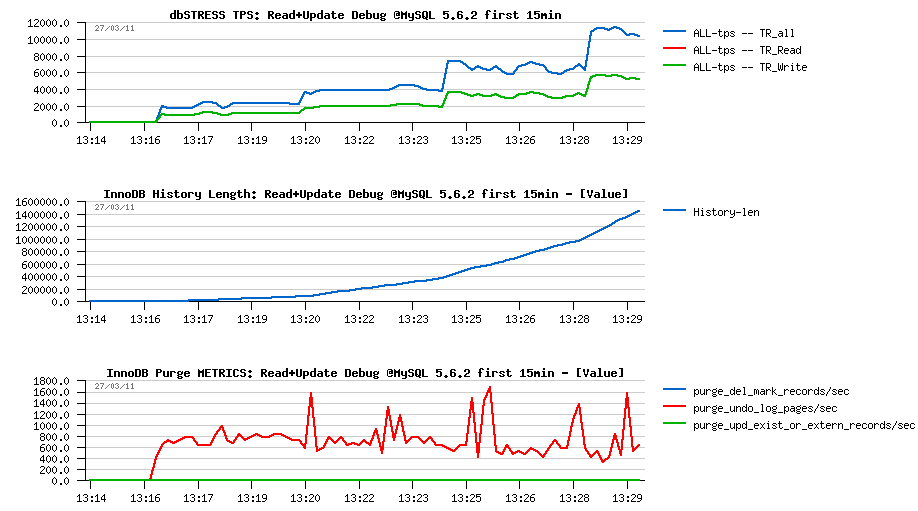
ANALYZE: First 15min of the Read+UPDATE Debug Workload @MySQL 5.6.2
-
Following are the graphs corresponding to the first 15min of
the Read+Update workload:
- As you see, History Length is growing from the beginning, even with a one single session!
- Purge activity is not absent - there is some amount of pages/sec purged for sure according the METRICS stats
- However, the amount of purged pages/sec remaining the same even on 1, 2, 4 or 8 concurrent sessions!..
- There is a problem on "Purge related" code for sure..
Don't think that this problem is related to dbSTRESS workload as on this test there are a simple series of SELECTs and UPDATEs, nothing special.. Will be interesting to see if the picture is the same on "sysbench" too..
Few comments about InnoDB METRICS table
The feature is really great as it's very easy to configure and request. I've finally enabled all counters as I did not observe any performance impact during my tests.
So added to my my.conf:
# Monitoring via METRICS table since MySQL 5.6
innodb_monitor_enable = '%'
Then to see a flushing activity for ex.:
mysql> select name, count from information_schema.INNODB_METRICS where name like '%flush%';
+-------------------------------------+-------------+
| name                                | count       |
+-------------------------------------+-------------+
| buffer_pool_pages_in_flush          |     -755812 |
| buffer_flush_adaptive_flushes       |        2144 |
| buffer_flush_adaptive_pages         |         564 |
| buffer_flush_async_flushes          |          15 |
| buffer_flush_async_pages            |        4140 |
| buffer_flush_sync_flushes           |           0 |
| buffer_flush_sync_pages             |           0 |
| buffer_flush_max_dirty_flushes      |           0 |
| buffer_flush_max_dirty_pages        |           0 |
| buffer_flush_free_margin_flushes    |           0 |
| buffer_flush_free_margin_pages      |           0 |
| buffer_flush_io_capacity_pct        |          14 |
| buffer_flush_batch_scanned          |     6990396 |
| buffer_flush_batch_num_scan         |       38816 |
| buffer_flush_batch_scanned_per_call |           0 |
| buffer_flush_batch_total_pages      |      755812 |
| buffer_flush_batches                |       38816 |
| buffer_flush_batch_pages            |          35 |
| buffer_flush_by_lru                 |           0 |
| buffer_flush_by_list                |      755812 |
| log_lsn_last_flush                  | 61648172324 |
| innodb_log_flush_usec               |    22705288 |
+-------------------------------------+-------------+
22 rows in set (0.00 sec)
Note: there is a negative value in "buffer_pool_pages_in_flush", should be a bug?
Few suggestions anyway:
- in many cases it makes sense to know not only the "current" / "last" counter value, but also a "total" (ex. flushed pages: it's fine to have the latest value, but without a "total" it's hard to follow the flushing activity as we're not always flushing the same amount of pages per flush call, etc.)..
- in some cases it makes sense also to present not only a number of times when the action was involved, but also a number of involved calls (for ex. we may call a flush more often than it's really involved (just because there is a batch in progress), but it'll be a direct sign that we're not flushing according to demand, etc. - same with purging, and probably others)..
- purge counter is missing (already reported to Jimmy)
Probably more to come, as for the moment I've mainly tracked Purge and Adaptive Flushing :-))
To be continued in the part 4...
MySQL Performance: 5.6 Notes, part 2 - Under full dbSTRESS workload...
This is the second part of the MySQL 5.6 Performance Notes started from here .
Now it's about performance results on a full dbSTRESS test workload scenarios..
- Workload: Read-Only, Read+Update, Read+Write (Writes=Delete, Insert, Update)
- Configurations: 16, 24, 32, 48 cores
- Concurrent users: 1, 2, 4, 8.. 1024 (4min on each step, growing load)
- Think time: 0 sec
-
Points of interest:
- identify current and potential contentions
- try to reduce contentions by limiting thread concurrency via CPU taskset (binding "mysqld" process to a fixed list of cores)
-
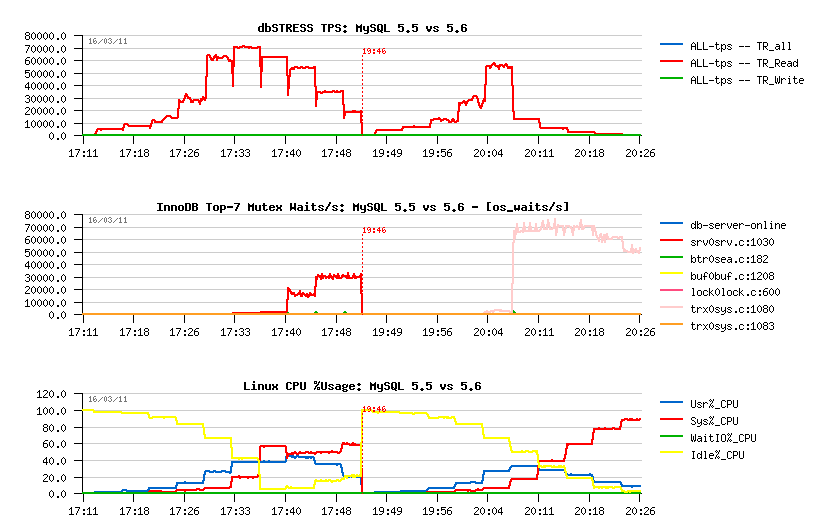
MySQL 5.5.9:
- most optimal performance on 32 cores
- max 30.000 TPS
- main contentions: btr_search_latch (yellow) and kernel_mutex (green)

-
MySQL 5.6.2:
- most optimal performance on 32 cores
- max 31.000 TPS
- main contentions: trx_sys (yellow), btr_search_latch (green)
- probably by reducing the contention on trx_sys we may obtain a more stable TPS on 32cores
- still no answer on: why the btr_serach_latch mutex still remains hot while there is no more pages loaded into the buffer pool?..

-
MySQL 5.5.9:
- most optimal on 24 cores
- max 37.000 TPS
- main contentions on: kernel_mutex (rose), btr_search_latch (blue)

-
MySQL 5.6.2:
- most optimal on 32 cores
- max 40.000 TPS
- main contentions on: lock_sys (green), trx_sys (magenta)

-
MySQL 5.5.9:
- most optimal on 32 cores
- max 19.000 TPS
- main contentions on: index lock, kernel_mutex

-
MySQL 5.6.2:
- most optimal on 48 cores
- max 21.000 TPS
- main contentions on: index mutex, lock_sys
- NOTE: interesting, that on all configurations except 48 cores 5.6 showing a lower performance comparing to 5.5..

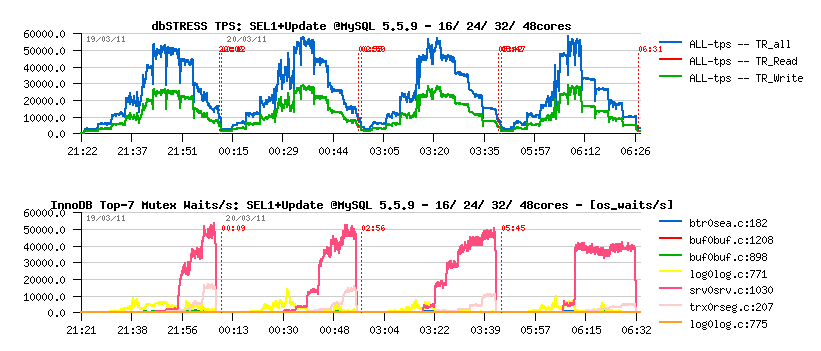
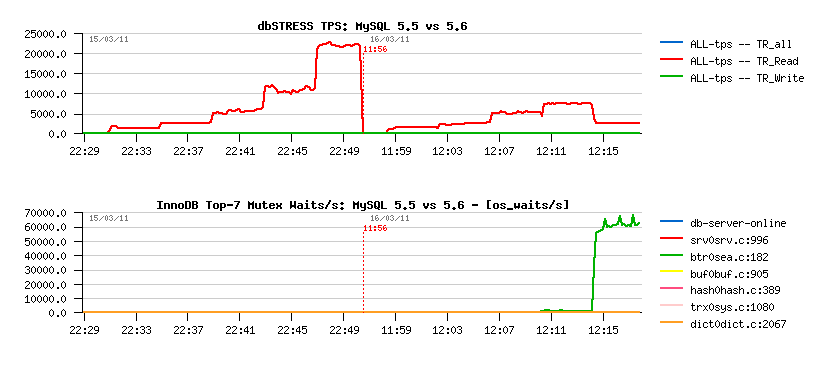
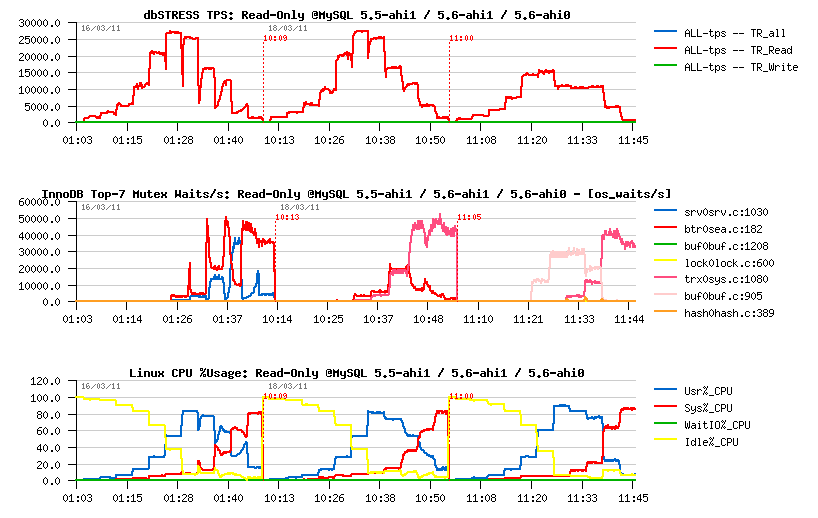
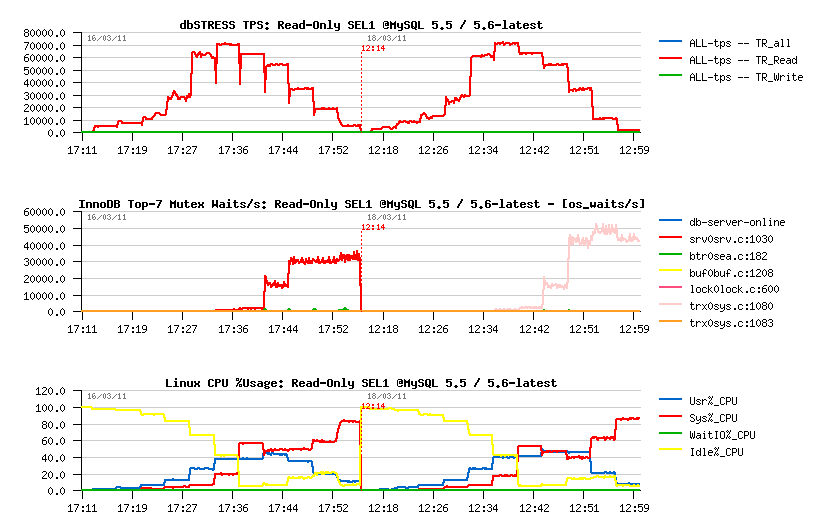
- Same as the previous test, just on the READ transactions only one SELECT query is used (SEL1)
- The main interest here that the SEL1 is blocked only by the kernel_mutex contention on a high concurrency workload..
- Workload: Read-Only, Read+Update, Read+Write (Writes=Delete, Insert, Update)
- Concurrent users: 1, 2, 4, 8.. 1024
- Think time: 0 sec
-
MySQL 5.5.9:
- most optimal performance on 16 cores
- max 85.000 TPS
- main contentions: kernel_mutex (magenta)

-
MySQL 5.6.2:
- most optimal performance on 16 cores, most stable on 24 cores
- max 81.000 TPS
- main contentions: trx_sys (yellow)

-
MySQL 5.5.9:
- most optimal performance on 24 or 32 cores
- max 57.000 TPS
- main contentions: kernel_mutex (magenta), rollback segment mutex (hm, interesting)..
-
MySQL 5.6.2:
- most optimal performance on 24 cores
- max 64.000 TPS
- main contentions: lock_sys (green)

-
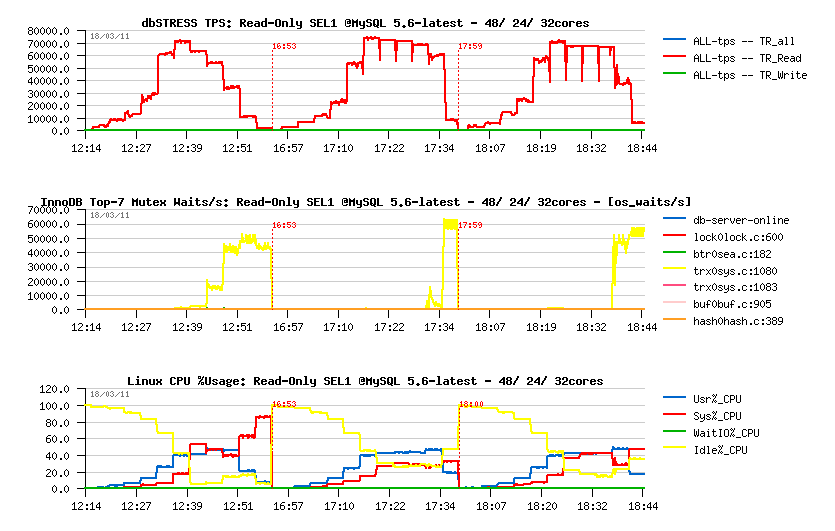
MySQL 5.5.9:
- most optimal performance on 24 or 32 cores
- max 21.000 TPS
- main contentions: index mutex (magenta) and kernel_mutex (magenta)

-
MySQL 5.6.2:
- most optimal performance on 48 cores
- max 22.000 TPS
- main contentions: index mutex, lock_sys mutex
-
NOTE: here again on all configurations except 48 cores 5.6 showing
a lower performance comparing to 5.5..
- need to be investigated...

MySQL Performance: 5.6 Notes, part 1 - Discovery...
I was lucky to discover MySQL 5.6 features ahead and here are my notes about performance improvements and pending issues observed on my benchmark workloads.. The story finally was very passionate and that's why very long for a one blog post :-)) so I've decided to split it into several parts and will publish all of them over a day..
Here is the first part, Discovery of MySQL 5.6.2 as it..
- first of all a split of the "kernel_mutex" was introduced! - it was one of the most hot contentions observed in MySQL 5.5 and limited InnoDB performance in so many cases..
- purge processing became multi threaded! - so we may expect to not see purge lagging anymore or reduce it considerably on heavy writes..
- page cleaning and flushing activity was removed from the Master Thread and assigned to the Page Cleaner (dedicated thread)
- METRICS table was introduced to make monitoring easier ;-))
- Performance Schema was improved and extended with a lot of new stuff..
[mysqld]
#-------------------------------------------------------
max_connections=2000
key_buffer_size=200M
low_priority_updates=1
sort_buffer_size = 2097152
table_open_cache = 8000

# files
innodb_file_per_table
innodb_log_file_size=1024M
innodb_log_files_in_group=3
innodb_open_files=4000

# buffers
innodb_buffer_pool_size=16000M
innodb_buffer_pool_instances=16
innodb_additional_mem_pool_size=20M
innodb_log_buffer_size=64M

# tune
innodb_checksums=0
innodb_doublewrite=0
innodb_support_xa=0
innodb_thread_concurrency=0
innodb_flush_log_at_trx_commit=2
### innodb_flush_method= O_DIRECT
innodb_max_dirty_pages_pct=50
### innodb_change_buffering= none

# perf special
innodb_adaptive_flushing=1
innodb_read_io_threads = 16
innodb_write_io_threads = 16
innodb_io_capacity = 4000
innodb_purge_threads=1
### innodb_max_purge_lag=400000
### innodb_adaptive_hash_index = 0

# transaction isolation
### transaction-isolation = REPEATABLE-READ
### transaction-isolation = READ-COMMITTED
### transaction-isolation = READ-UNCOMMITTED

# Monitoring via METRICS table since MySQL 5.6
innodb_monitor_enable = '%'
#-------------------------------------------------------
- first of all, there is a title on each graph ;-)
- then the legend on the right side explaining the meaning of curves..
- and then, if nothing else specified, I've tested a step by step growing workload, and on each step there were x2 times more concurrent user sessions than on the previous one..
- high contention on the btr_search_latch mutex since 16 sessions is gone!
- contention on btr_search_latch mutex is starting now since 32 concurrent sessions as before..
- since 64 sessions the trx_sys mutex contention is added too..
- since 256 sessions the trx_sys mutex contention is dominating..
-
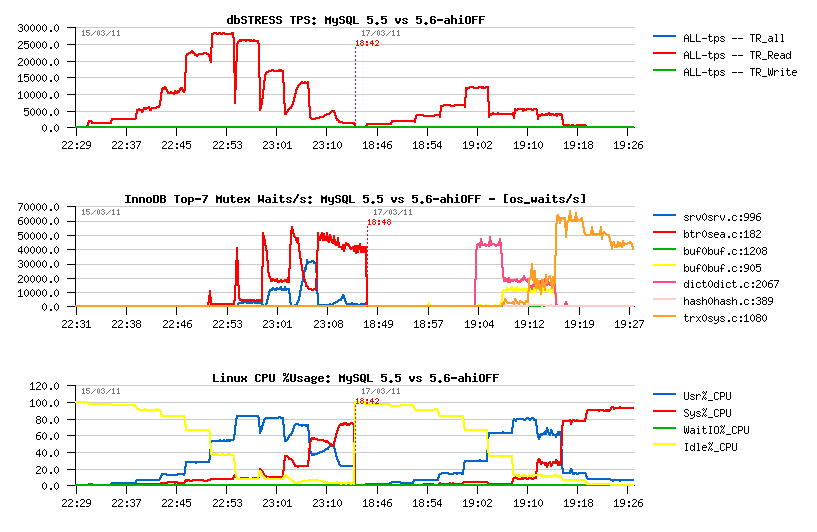
disabling A.H.I is completely removing btr_search_latch mutex
contention, but it's not improving performance:
-
even before any other contention is coming in game, the TPS level
is already lower when AHI=OFF
(for ex.: on 8 sessions TPS is 7.500 with AHI=OFF, while it's 10.000 with AHI=ON) -
then we hit a contention on the buffer pool index..
NOTE: buffer pool mutex contention may be very random - all depends how the data arrived into the buffer pool.. - if one of the BP instances is more accessed than others, we're getting back a situation similar to a single BP instance..
-
then once again the trx_sys mutex is taking a dominating position..
-
even before any other contention is coming in game, the TPS level
is already lower when AHI=OFF
- why do we still have a contention on the btr_search_mutex even once all accessed pages are already loaded to the buffer pool ???
-
any idea about reducing the trx_sys mutex contention ??..
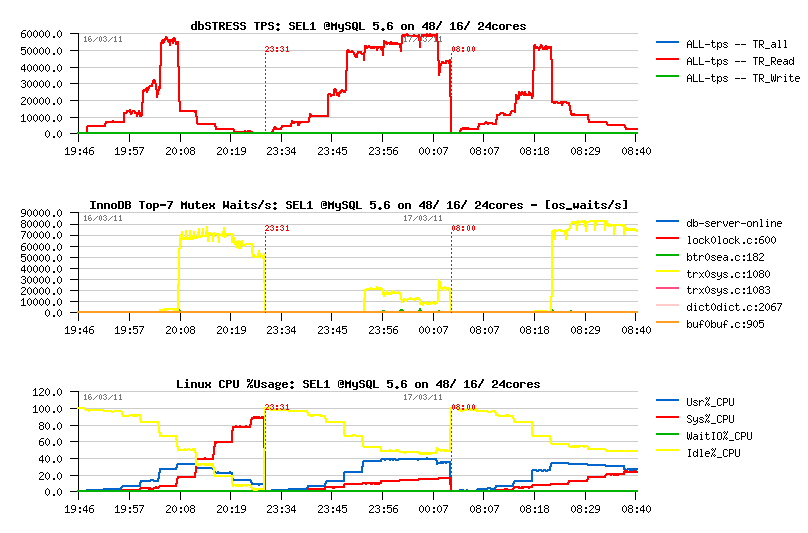
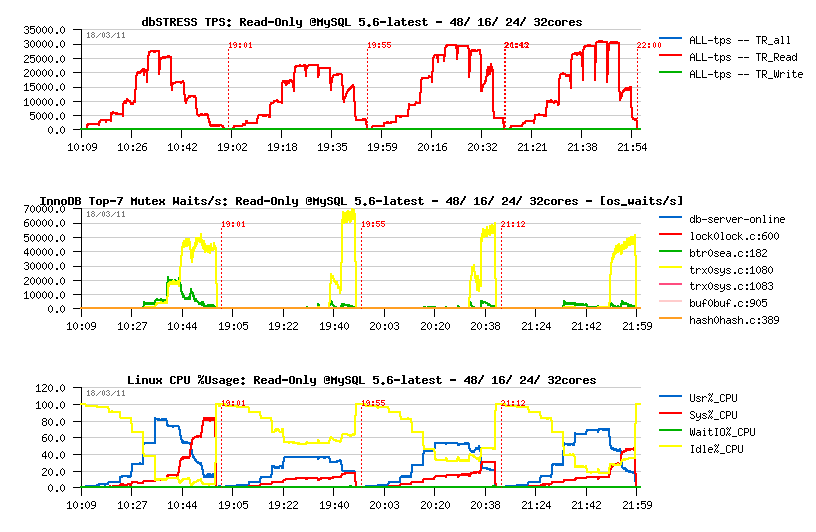
- on 24 cores the ~max TPS level is kept up to 512 concurrent sessions
- on 32 cores it's up to 256 sessions only..
- on 48 cores performance is already decreasing since 64 sessions..
To be continued.. (see part #2)..
Friday, 01 April, 2011
MySQL Performance: Reaching 100M(!) Transactions/sec with MySQL 5.5 running on Exadata!

Cannot give you all details yet and it's too early to say what the max performance we'll finally obtain, but currently we out-passed 100.000.000 (!) Read+Write transactions/sec on the latest MySQL 5.5 simply integrated on the Exadata X2-8 (full rack) instead of Oracle database!!! :-))
The result is so incredible.. - but we spent several days now to validate that workload is perfectly matching customer's requirement and really reproducing their production environment. The problem came from the performance issue they observed month to month and came in our Benchmark Center to test a new HW platform (and we're in competition here with HP and IBM, but they have already finished their testing and without a positive result (no comments.. ;-))).. Finally, no one of any tested platforms was able to keep the load expected for the end of the year.. And of course we think about Exadata :-)) but the problem that the customer's application is fully dependent on MySQL and they never ever wanted to migrate (specially that they are running some hidden x64 functions which will not run on SPARC64 for ex.)..
So, looking on our Exadata, wa say "what if?".. ;-))
Then we used CELLs as MySQL shards and added some "back box magic" - the shard coordinator which is "natively" distributing data between Exadata CELL nodes and even give now a possibility to run parallel queries! - SELECT count(*) from Table of 500GB is giving an answer.. in 1.2sec!! (on InnoDB).. Then for OLTP (main customer's workload) we adopted the latest Solaris 11 features (mapping MySQL threads to kernel threads (LWP), using HW-atomic mutexes, super-parallel AIO lib and Zone binding) - all these factors gave an incredible boost, and 100M TPS was finally out-passed!! :-)) it's hard to believe if I did not see it myself :-))
Currently the max performance is limited by the network throughput.. - well x4 10Gbit network cards on each node! - who may believe we'll reach the limit on our 10Gbit switch?.. So, currently we're waiting for the new one which will be shipped next week, and then a new record will wait for us!..
Stay tuned!. ;-))