« October 2010 | Main | August 2010 »
Sunday, 19 September, 2010
MySQL Performance: 5.5 Notes..
Since 5.5 is announced as Release Candidate now, I'll not compare it with 5.1 anymore - I think there was written enough about the performance gain even since introduction of 5.4 :-)
From the other side, we want to be sure that the final 5.5 will be at least as good as 5.5.4 release, and here the feedback from real users with real workloads will be very precious! So, please, don't keep quiet! :-))
After that, few notes while testing MySQL 5.5 on dbSTRESS and points for discussions..
Buffer Pool and Purge
Last month I've got some time to focus on the Buffer Pool pages management I've observed many months before with older MySQL/InnoDB versions, and now was curious if I'll reproduce the same issue with MySQL 5.5.4 too...
Few words about the tested workload:
- still dbSTRESS ;-)
- but "light" scenario which may be very common for many web servers: there are only SELECT and UPDATE statements generated during the workload (WRITE transactions are selected as UPDATE-only during scenario generation)
- UPDATE queries are not modifying any indexes and not increasing any data in size, so all UPDATE(s) are changing all data in place
- READ transactions are composed of 2 SELECT statements: first id "light", the second is "heavier", but both are joins of two tables by primary or secondary key
- no "think time" between transactions, so every user session is bombarding the database non-stop with SELECT(s) and UPDATE(s)
- 32 users (sessions) are running in parallel
- the response time of all queries is reported live by the workload (SEL1, SEL2, UPD), as well the reached TPS level too
- the READ/WRITE ratio may changed according scenario, I've focused here on RW=0 (Read-only) and RW=1 (Read+Write, one READ per each WRITE, means two SELECT per UPDATE (SEL1 + SEL2 per each UPD))
What I observed before is that even if every UPDATE is changing data in place, there is a continuous decrease of the free space in the buffer pool! - and over a time all the space is used by something else rather useful data, etc.. - means probably "useful data" are leaving the cache and filled by old page images, etc.
So far - yes, I've reproduced the same problem again and with MySQL 5.5.4 - and you may read all details about in the Buffer Pool and Purge report. But to make it short: it's once again about InnoDB purge - if purge is unable to follow your workload activity you may have many problems, and this problem is one of them :-))
I did not really think to publish this report before I have a detailed in depth explanation about everything is going on.. - But several things happened during this time:
- First of all, InnoDB Team came with so promising ideas about improvements in the page management that it made me regretting 5.5 is become RC and no new features may be included until 5.6 now :-))
- And second - sometimes the solution is also coming "by surprise" from somewhere you even not expected ;-))
Let me speak about the Linux kernel :-))
Linux Kernel impact
By some chance there was a change of the Linux kernel on the same server I've used before. By lack of chance I cannot say you what was the old kernel (I may just suppose if was newer than the current one).. - But at least I may say that the current one is: 2.6.32.21-166.fc12.x86_64 :-))
The changes came when moved to this kernel:
- No more problems with Buffer Pool on the same workload up to 128 users! - purge is working just fine :-) (probably related to a better process scheduling on a multi-core machine?)
- Curiously 32 cores configuration shows even slightly better result comparing to 16 cores (NOTE: each core has also 2 threads, so Linux is seeing 64 vcpu) - before on 32 cores the result was always slightly worse..
So my questions here:
- Which Linux do you use in your production and why?..
- Which kernel version you're keeping on your production server and why?..
I think sharing this information will help to focus on the right MySQL issues and combine best practice for every users :-)
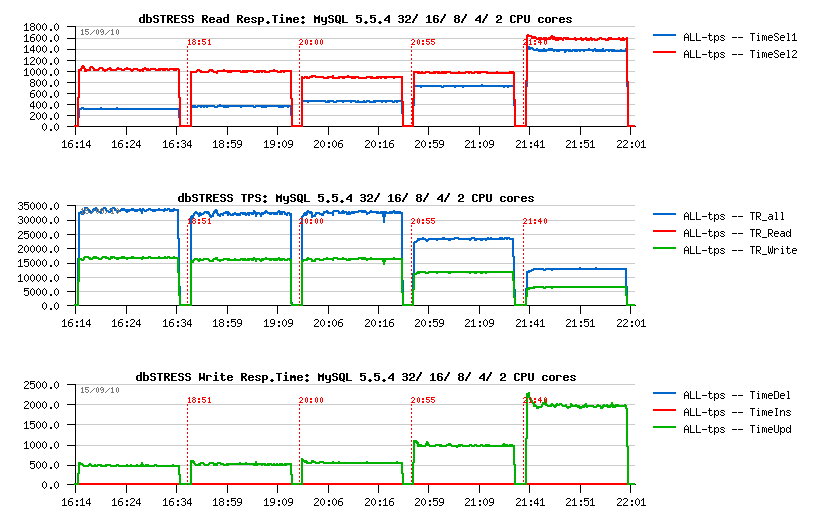
Here is a small graph commenting my observations.
Performance on 32/ 16/ 8/ 4/ 2 cores
Comparing 5.5.4 and 5.5.6: flushing
There were many discussions about dirty pages flushing in 5.5 since UC2010 in April.. - On some workloads the flushing was too aggressive.. On some not aggressive enough..
Well, the 5.5.6 is came with a more "relaxed" (less aggressive) flushing which will depends a lot on your workload. And probably in many cases it'll be just fine..
On dbSTRESS, curiously, if 5.5.4 was too aggressive, then 5.5.6 seems to be too relaxed :-)
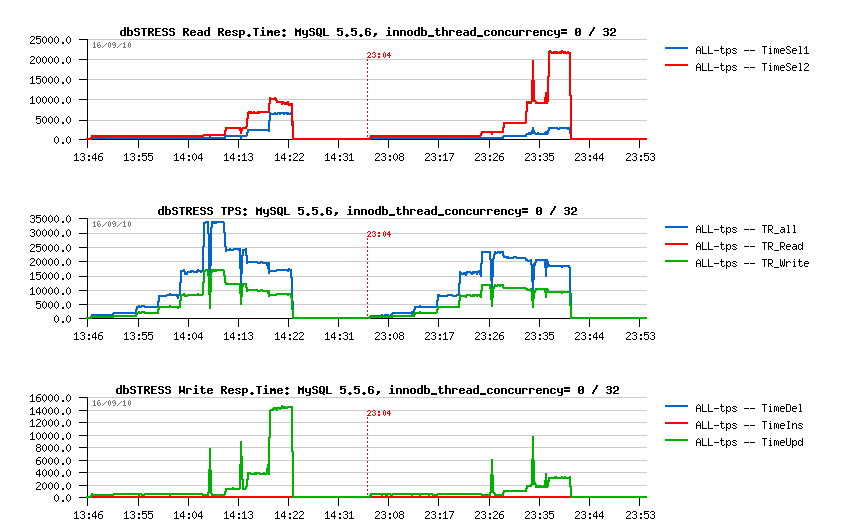
As you can see on the following graph, the 5.5.6 may miss a performance stability on the aggressive workload (like dbSTRESS):
Flushing on 5.5.4 vs 5.5.6:
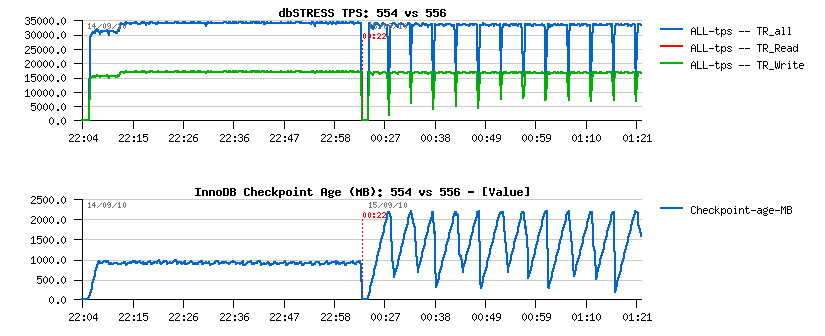
Observations:
- On the left part is 5.5.4, on the right: 5.5.6
- the 5.5.4 flushing is quite aggressive and even don't leave REDO logs to be filled more than 50% (see on Checkpoint Age courve)
- the 5.5.6 flushing is more relaxed and not flush enough, so the REDO may become out of free space, then a furious flushing is involved and bring a performance drop..
To recognize if you meet such an issue you have to monitor your Checkpoint Age in parallel with your workload activity - and if Checkpoint Age drops are corresponding to your activity drops + I/O write activity spikes = probably you're here ;-)
Again, think to report your problem! - it'll make the final release way better! :-)
Well, it was aggressive, but in memory workload.. - Let's see later what changes when the workload is IO-bound ;-))
Comparing 5.5.6 vs 5.5.6: compiling
Usually I'm compiling myself my MySQL binaries for testing, but now was curious if there any difference in performance between an "official" binary and compiled from the sources:
- Well, you may still win some 10% in performance by compiling a "light" version :-)
- For ex.: I'm using only "myisam,innodb,partition" engines list, which gives me a small (less 10MB) binary..
- Then in some cases compiling it with "tcmalloc" gives another boost (you may check its impact also by using tcmalloc via LD_PRELOAD)
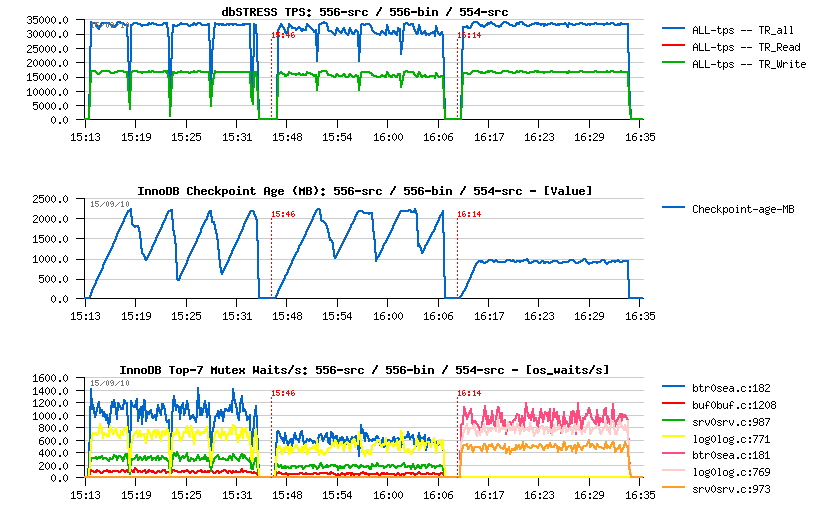
The following graph is representing observed differences:
- from the left to the right: 5.5.6 from sources, 5.5.6 official binary, 5.5.4 from sources
- as you can see, avg TPS level of the 556-src is slightly higher comparing to 556-bin
- on the same time the binary version shows lower depth in performance drops..
5.5.6-src vs 5.5.6-bin:
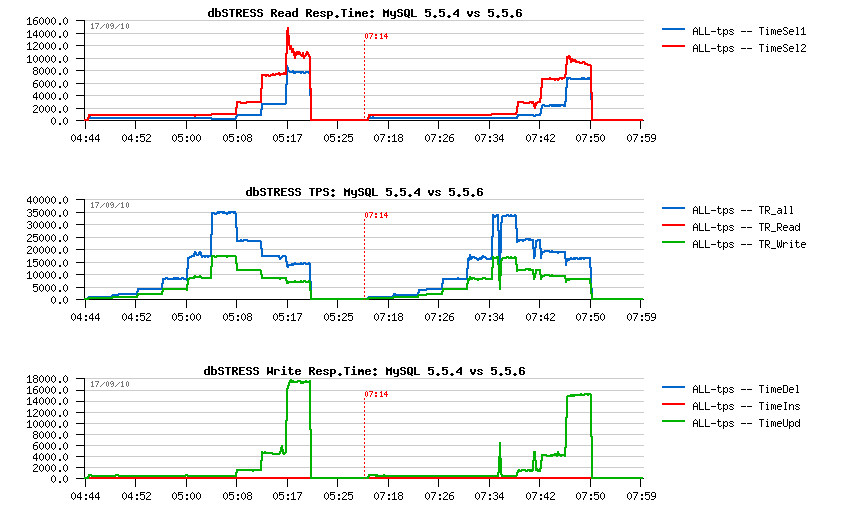
Comparing 5.5.4 and 5.5.6: scalability
What is interesting, that on the same workload 5.5.6 is keeping better the higher workload comparing to 5.5.4
dbSTRESS scenario :
- users: 1, 2, 4, .. 256
- Read/Write ratio: 1
- think time: 0
- WRITE: UPDATE-only
my.conf settings :
- innodb_thread_concurrency=0
- innodb_purge_threads=1
- ...
As you can see from the following graph, 5.5.6 is giving a higher TPS on 64, 128 and 256 users (observed on the better response time as well):
MySQL 5.5.6 scalability:
MySQL 5.5 innodb thread concurrency
From the previous graphs you may see that since 32 concurrent users/sessions there is a continuous drop in performance, and you may say - it's as expected as the innodb_thread_concurrency is set to zero. In the past to fix such an issue the solution was to set the innodb_thread_concurrency to something different from zero - for the 5.5 the most optimal value was 32 until now. The problem here is that everything as usual depends on the workload.. - And in my case, the overhead of innodb concurrency management is out-passed the potential gain! (since all performance improvements made in 5.5 its overhead may become more visible than ever)..
The overhead of the concurrency management in InnoDB is not something new - I've presented 2 output examples few years ago of the top locking on MySQL reported by Solaris "plockstat" (derivate from DTrace) - Lock waits reported by Solaris . You may see that once concurrency setting is not zero, the 'srv_conc_mutex' moving to the first place.. It was on the pre 5.4 era yet, but I don't think the concurrency code changed too much since that. And correct me if I'm wrong, but seems the waits on this mutex are not reported by "mutex status" output as it's created via "os_fast_mutex_init(&srv_conc_mutex);", so not listed in innodb mutexes and that's why I don't see it at all during monitoring (and I think the same for the same reasons it should be invisible for Performance Schema too) - and if it's so, it should be fixed..
Now, looking more in details for the observed performance difference - the following graph is representing a step by step growing dbSTRESS workload from 1 user to 256 (1,2,4..256): - on the left side 5.5.6 is running with innodb_thread_concurrency=0 - on the right side: set to 32 - changing the value of tickets is not helping here as transactions are very short and fast (that's why probably the overhead is seen so well too, don't know)..
MySQL 5.5.6 thread concurrency:
What is interesting:
- there is no difference until the concurrency is low (up to 16 users)
- the benefit is coming since 256 concurrent sessions only on this test..
-
with a growing workload performance is decreasing, but not for the
same reasons in both cases:
- with concurrency=0 it's mainly due growing time of UPDATE statements
- with concurrency=32 it's mainly due growing the second SELECT statements - so yes, it depends on the workload, and we need more visibility on internal waits to give a right advice :-)
Solutions?..
So, for the best performance results you're better to keep active sessions in your database under 32 and then set innodb_thread_concurrency=0. For example you may use an application server connection pool or other 3rd party solutions.. - nd of course having a thread pool inside of MySQL will be the most optimal :-)
Otherwise, if you may have many concurrent user sessions running on the same time you may always try to change innodb_thread_concurrency from its zero default value - this setting is dynamic, so you may quickly check the result without restarting your database server and then compare which setting is better adapted for your workload...
MySQL on I/O-bound workload
Well, until now I've focused my attention mainly on the in-memory workloads - in many cases on IO-bound workload you're simply testing your storage array performance and it doesn't help to improve MySQL performance :-)) However, now I my database is placed on the SSD disks! - how much it'll help in my workload?..
Let's start first with Read-Only workload as it's the most simple one :-)
To make my workload IO-bound I'll just reduce the AntiDEAD setting in dbSTRESS scenario (to avoid deadlock exceptions during the test, dbSTRESS has an AntiDEAD option: it gives an interval of ID to be used by each user/session, and avoids artificial deadlocks during testing). On the same time by this setting you may reduce or increase the quantity of pages which will be covered by randomization algorithm..
So far, reducing AntiDEAD from 2000 (default) to 200 I'm increasing by x10 times the number of pages accessed during the test. Other scenario settings remain the same:
- 1 to 256 users/sessions
- Read-Only transactions
- think time: 0
Then I've executed 3 tests:
- 1.) in-memory workload, AntiDEAD=2000 (as before)
- 2.) IO-bound workload, AnfiDEAD=200, data files are opened with O_DIRECT (not cached by file system)
- 3.) IO-bound workload, AnfiDEAD=200, data files are opened with fdatasync (cached by file system)
The following graphs are representing the observed 3 workloads in the same order:
MySQL 5.5 Read-Only IO-bound workload:
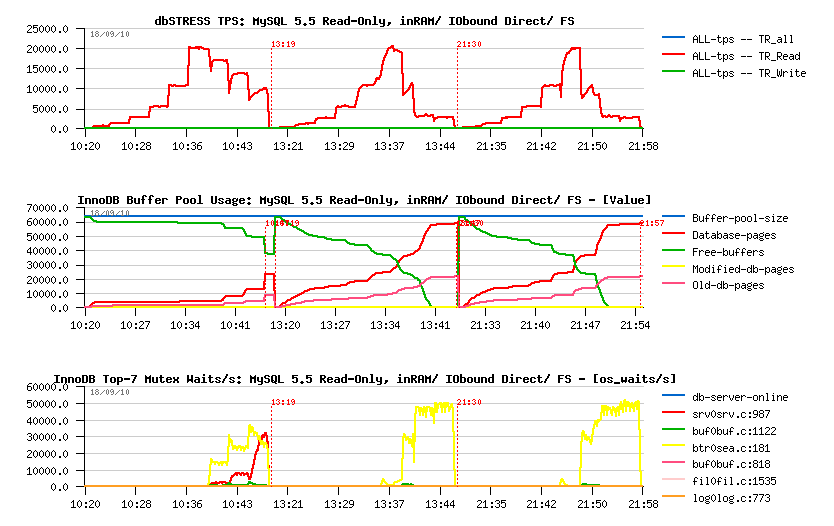
Observations:
- all three workloads reached the max 20K TPS observed initially with in-memory workload
- then with a growing workload, performance decreasing..
- however, the drop in performance is much more deeper on IO-bound workloads..
- is it because of I/O latency to the storage array?.. - not really, because even with a fully cached data by the filesystem the result is still not better ;-)
- interesting that the kernel_mutex that we see in in-memory workload is even not appearing when the workload is IO-bound..
- as well looking on the mutex waits, we may suppose the issue is coming from the btr_search_latch - but the real answer may be found with Performance Schema here ;-)
Seems things a directly depending on the page operations - with a smaller (8G) Buffer Pool performance become even worse and TPS will be limited to 10K only.. With 32G pool it's sligtly better, but in many cases you cannot put your whole database into your Buffer Pool, so there is definitively something to do here..
As you may imagine, Read+Write workload will suffer the same problems once it become IO-bound, but what is interesting that the main issues are READ transactions (as expected)..
MySQL 5.5 Read+Write IO-bound workload:
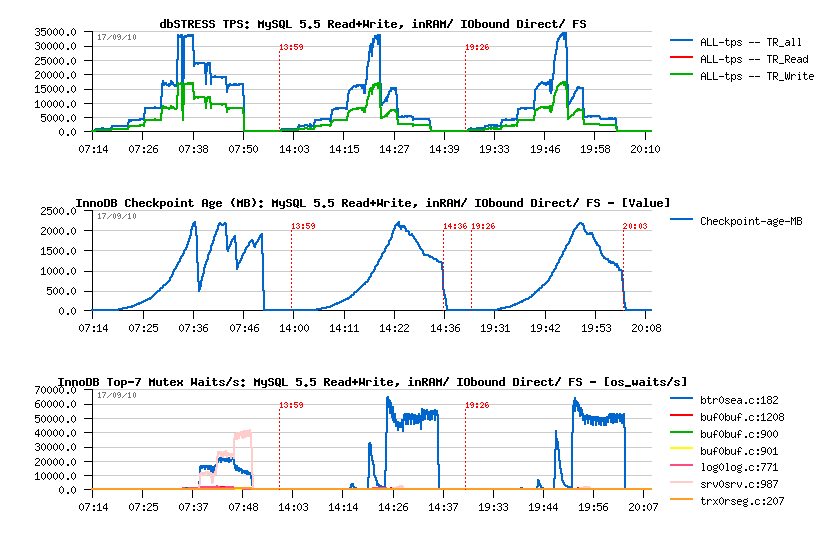
Observations:
- all three workloads reached the max ~35K TPS observed initially with in-memory workload
- similar to Read-Only decreasing performance with a growing workload..
- but what is interesting that during IO-bound workloads performance is decreased mainly due increased response time in SELECT statements! (page reading management?..)
- but from the other side: no furious flushing on the IO-bound workload.. (well, it's better to call it IO-bound reading ;-))
Some ideas...
It's quite curious to see how performance may vary depending on your data and I/O pattern..
Some points to consider:
- your database may be always way bigger than the RAM you have..
- you cannot always use most of the RAM for your database (specially if there are other applications are running on the same server)..
- in many cases file system may read much more faster the data required by the database rather the database read-ahead..
So I think we have to focus on how to speed-up the pages read within InnoDB, because even the Read-Only may look not perfect for the moment..
Well, work continues! :-))
All other details about present materials you may find in the final benchmark report: MySQL 5.5 Notes..
Any comments are welcome! :-)