« February 2013 | Main | November 2012 »
Monday, 28 January, 2013
MySQL Performance: InnoDB heavy I/O RW workloads limits in 5.6
This article was initially planned to follow the previous posts about RW
(Read+Write) workloads on MySQL & Linux (part#1,
part#2)...
But, when I've started to run real MySQL/InnoDB IO-bound tests on the
Fusion-io card, I've quickly realized that I'm hitting so hot internal
contentions within InnoDB code, that I'm simply unable to use storage
capacity on its full power.. So, I've moved to another server (having
SSD only), and then continued with it (as to explain RW limits it'll be
pretty enough). Also, curiously, on this server XFS performance on
writes is way better than EXT4 (while on the the previous server XFS got
some unexpected problems, seems to be known bugs)..
So far, for
the following tests I've used:
- Server : 32cores bi-thread (HT) Intel 2300Mhz, 128GB RAM
- OS : Oracle Linux 6.2
- FS : XFS mounted with "noatime,nodiratime,nobarrier,logbufs=8"
- MySQL : 5.6
- and as seen as the most optimal from the previous I/O testing, MySQL is using O_DIRECT and AIO for I/O operations (mainly write-oriented here)..
- adaptive hash index feature (AHI) is turned off (AHI lock contentions is a different issue, should be fixed in 5.7)
my.conf:
-------------------------------------------------------------------------
max_connections = 4000
key_buffer_size = 200M
low_priority_updates = 1
sort_buffer_size = 2097152
back_log = 1500
query_cache_type = 0
# files
innodb_file_per_table
innodb_log_file_size = 1024M
innodb_log_files_in_group = 3
innodb_open_files = 4000
table_open_cache = 8000
table_open_cache_instances = 16
# buffers
innodb_buffer_pool_size = 64000M
innodb_buffer_pool_instances = 32
innodb_log_buffer_size = 64M
join_buffer_size = 32K
sort_buffer_size = 32K
# tune
innodb_checksums = 0
innodb_doublewrite = 0
innodb_support_xa = 0
innodb_thread_concurrency = 0
innodb_flush_log_at_trx_commit = 2
innodb_flush_method = O_DIRECT
innodb_max_dirty_pages_pct = 50
innodb_use_native_aio =1
innodb_stats_persistent = 1
innodb_spin_wait_delay =96
# perf special
innodb_adaptive_flushing = 1
innodb_flush_neighbors = 0
innodb_read_io_threads = 16
innodb_write_io_threads = 4
innodb_io_capacity = 10000
innodb_purge_threads =1
innodb_adaptive_hash_index = 0
# Monitoring
innodb_monitor_enable = '%'
performance_schema = ON
performance_schema_instrument = '%=on'
-------------------------------------------------------------------------
An then, let's start from the beginning.. ;-))
What was wrong with MySQL/InnoDB on RO (Read-Only) workloads?..
- the main goal here is to bring data pages as fast as possible into the Buffer Pool (BP) to get them cached; and if BP is not big enough to keep the whole active data set -- then adding efficient BP management to remove the most unused pages first when reading the new ones..
- the positive thing here that reads in most cases are completely independent between user threads, so all the I/O related activity will most likely depend only of your storage speed..
- except if you're not hitting any InnoDB internal contentions ;-)
- the main one in the past was "BP mutex" contention (InnoDB, fixed in 5.5 by introducing BP instances)
- then "kernel_mutex" (InnoDB, removed in 5.6)
- then "trx_sys" (InnoDB, in 5.6 decreased by introducing of READ-ONLY transactions + lowered by increasing "innodb_spin_wait_delay", real fix is planned for 5.7)
- then MDL related locks (MySQL server, partially fixed in 5.6, real fix is planned for 5.7)
- however, even having all these contentions, it's still possible to keep performance level stable up to 1024 concurrent users sessions and more (see these posts for details) and without involving any throttling (like InnoDB thread concurrency) or special thread management like (Thread Pool extension)..
While, thinking well, the use of the Thread Pool is simply the must for any system having a big number of active user sessions -- OS scheduler will simply unable to manage them right (it has no idea who is doing what, who is locking what, who is waiting for what, and so on.. -- most of these things are internal to the MySQL/InnoDB code and not really visible to OS). Then, usually once your number of active threads out-passing x3 time the number of available CPU cores on your server, your CPU time will be very likely spent more and more to simply manage them (OS scheduling), rather to get a real work done.. As well, don't forget that N cores are able to run on the same time only N threads, and not more ;-) So, Thread Pool is really helping here and let you use your server HW more optimally..
Well, and what about RW workloads now?..
- MySQL 5.6 brings many improvement to get thing working right (improved Adaptive Flushing, Page Cleaner thread, Multiple Purge Threads, over 4GB REDO logs, etc.)
- but as you're constantly writing, you're very I/O dependent on RW workloads..
- with increasing number of concurrent users your I/O activity will be increased yet more faster (more REDO log records, more dirty pages flushing, more purge activity, etc.)..
- and combined with the increased internal concurrency contentions in the code, you may be even unable to involve the same amount of I/O write requests as on a lower load..
- Thread Pool may sill help here to keep contentions level constant..
- but things are changing A LOT not even with increased number of concurrent users, but with increased size of your database! - and here only a proper fix will help.. -- means we have many challenges for performance improvement in MySQL 5.7 ;-))
Let's start with a simple case first..
Test details:
- Sysbench OLTP_RW (default, single table), 10M records, InnoDB engine
- workload is growing from 8, 16, 32 .. 1024 concurrent users
- innodb_thread_concurrency = 0 / 64 (just to see if it still helps)
OLTP_RW 10M, concurrency = 0 / 64 :
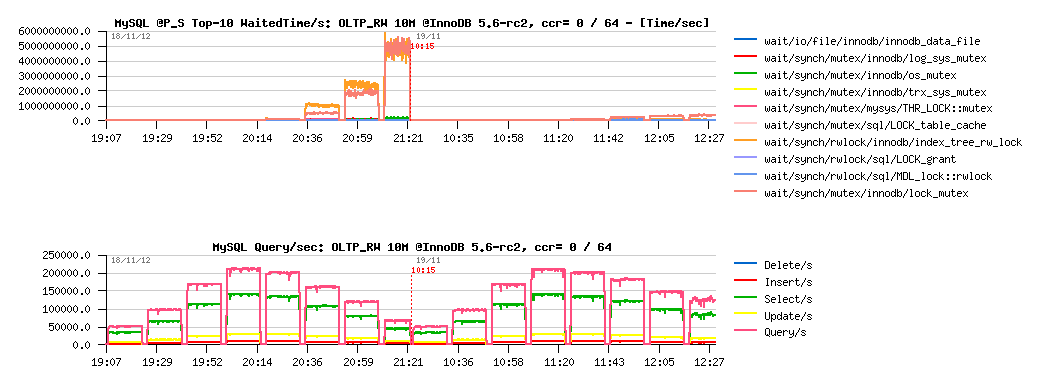
Observations :
- left part of the graph is corresponding to the same test using innodb_thread_concurrency=0, and the right one = 64
- main bottlenecks here are on InnoDB "index lock" and "lock mutex"
- using InnoDB thread concurrency is still helping here! (result on 1024 users is near twice better)
- but index lock seems to be the most hot, so it lets expect that using partitioned table, or simple several tables should decrease this contention a lot..
Let's see:
Test details:
- Sysbench OLTP_RW, 8 tables 1M records each, InnoDB engine
- workload is growing from 8, 16, 32 .. 1024 concurrent users
- innodb_thread_concurrency = 0 / 64
OLTP_RW 8-tables x 1M, ccr= 0 / 64 :
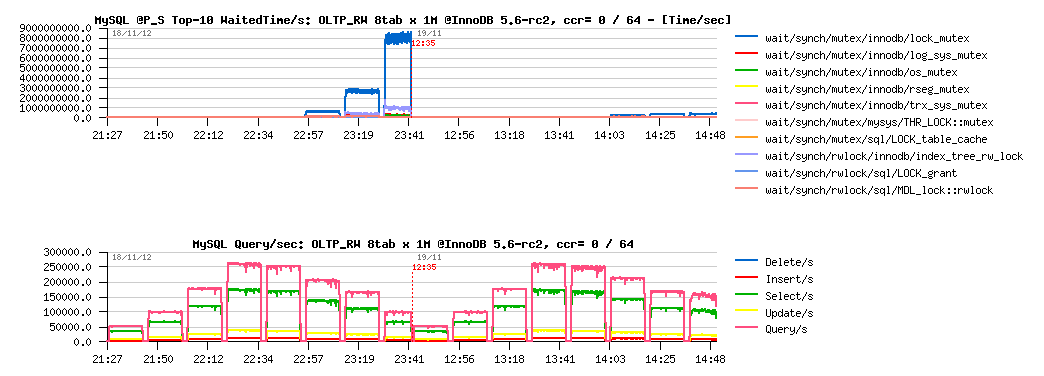
Observations :
- main contention is on the "lock mutex" only now, and as the result max QPS level is much higher too! (255K vs 210K QPS)
- but InnoDB thread concurrency is helping only on 1024 concurrent users load now.. interesting..
- and what exactly contention is blocking performance on 250K QPS?..
What is blocking us on 250K QPS ?..
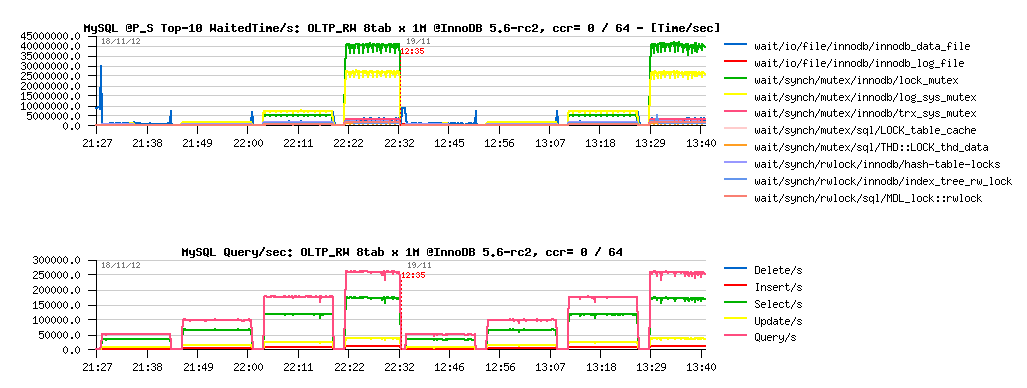
Observations :
- main contentions are on the "lock mutex" and "log sys mutex"
- lock mutex contention is dominating..
- and the question is: why log mutex is getting a contention?.. - specially how high it's jumping from 32 to 64 users level..
- gives impression to be blocked by IO speed on REDO log writes.. - but my SSDs are yet far to be even fully busy% on that moment, so the problem is not really related to I/O... and well, it's not yet the main contention here, so..
Well, let's keep the 64 users workload as the "peak level", and focus on it while analyzing more heavy loads ;-))
Now: What will be changed if instead of 10M, I'll run the same load on the 100M database size?.. 200M? more?..
- first of all the volume (of course ;-)) -- and if your workload data set will no more feet the BP size, there will be more and more data reads involved, and finally the whole database activity may become I/O bound, and we'll no more test the MySQL performance, but the storage..
-
but supposing we have enough RAM and workload data set may still
remain cached and SQL queries are not depending on the volume (we're
still operating with the same amount of rows in read and write
operations within every query).. -- what will be changed then?
- reads related response time should remain the same (of course index trees will be much more bigger, need more operations in access, but as most of the data remaining cached (as we supposed) it should still go on the same or near the same speed)..
- while if your access pattern is completely random, writes will become much more wider and will touch much more different data pages!
- the query/sec (QPS) level may pretty remain the same, and as the results, the REDO logs writes speed too..
- however, to follow these REDO log writes will become more harder now, because if on a small data volume there is a lot of chances that by flushing one dirty page you'll match several REDO records corresponding to this page, while on a bigger volume - there is more and more chances that more pages should be flushed to cover the same amount of REDO records..
- to summarize: with a growing volume your dirty pages flushing activity will grow too!.. - which will demand to revisit your storage performance hosting data (while REDO writes will remain the same)..
- And the question then: Will be MySQL/InnoDB able to follow your storage capacity?..
Let's continue with "standard" Sysbench OLTP_RW test, but use now 100M and 200M data volumes.
My main interest is focused around the following test conditions:
- Read+Write workload with 64 concurrent users (user threads)
- InnoDB Buffer Pool: 64GB vs 16GB (to see the impact in each test case when the dataset is not fitting the BP size)
- InnoDB REDO log total size: 8GB vs 3GB (to see the impact between less and more aggressive flushing conditions)
As usually, MySQL Performance Schema (PFS) will help here to analyze wait events + I/O waits too.
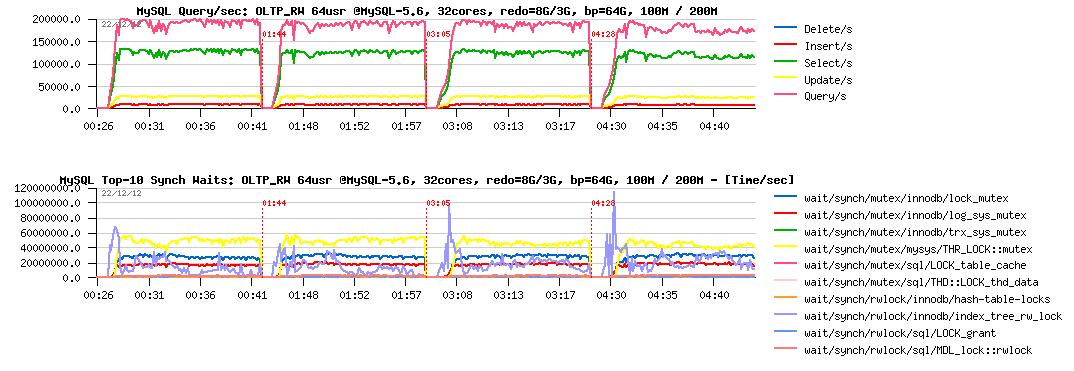
So, on OLTP_RW 10M it was enough to flush 1500-2000 pages/sec to keep the 200K QPS level. What will change on the 100M and 200M volumes within "good conditions" (BP=64GB and REDO=8GB):
OLTP_RW 100M vs 200M, bp=64G, redo=8G :
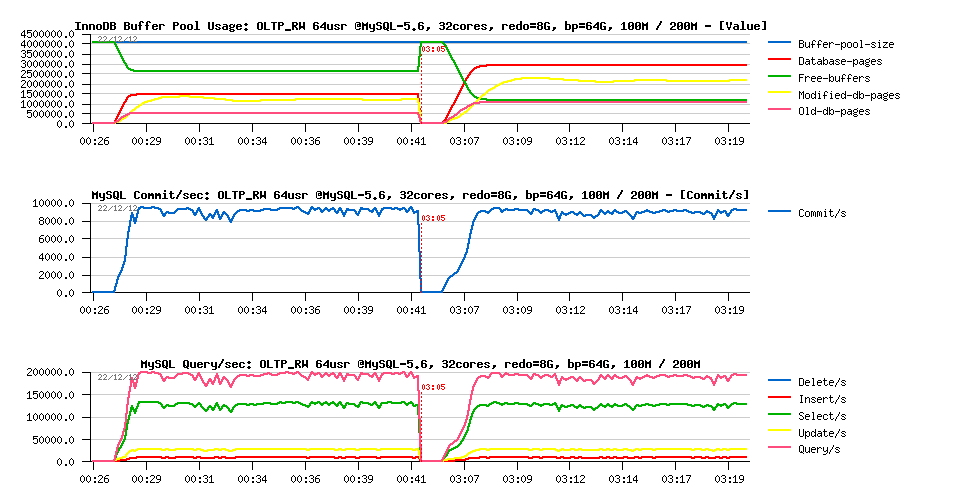
Observations :
- On both test cases the same near 200K QPS level and over 9000 commit/sec
- and all data are fully cached within BP
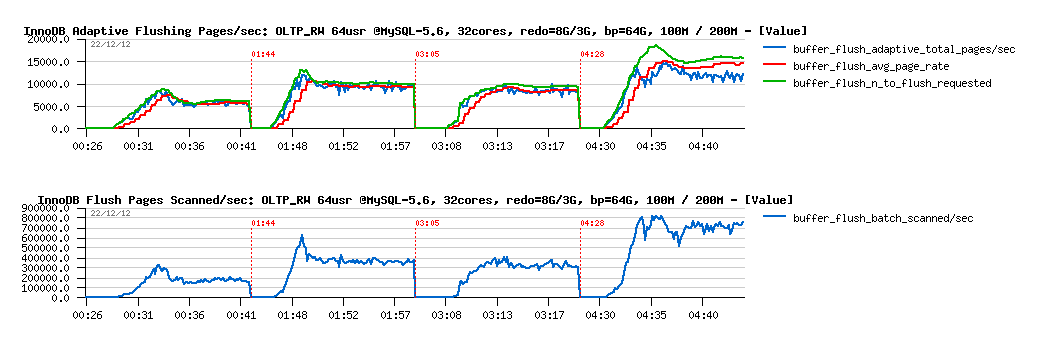
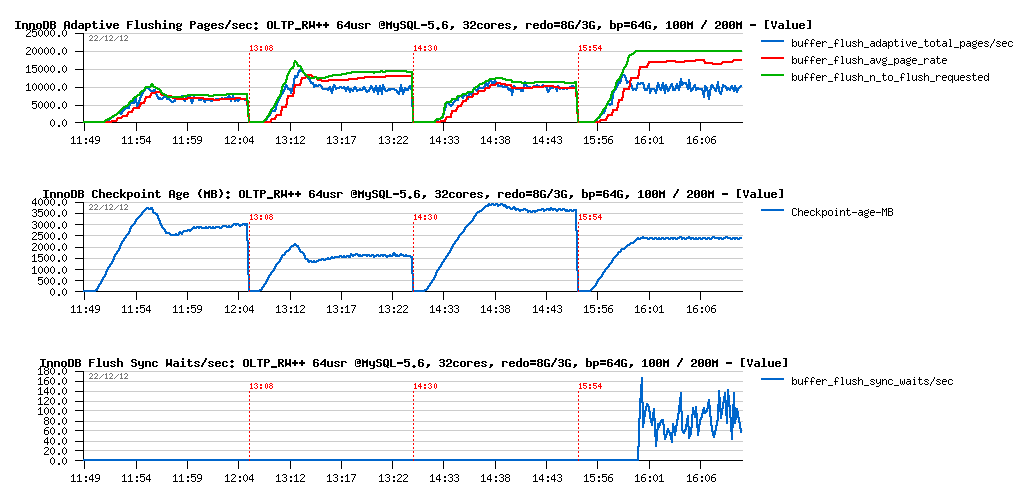
Flushing activity :
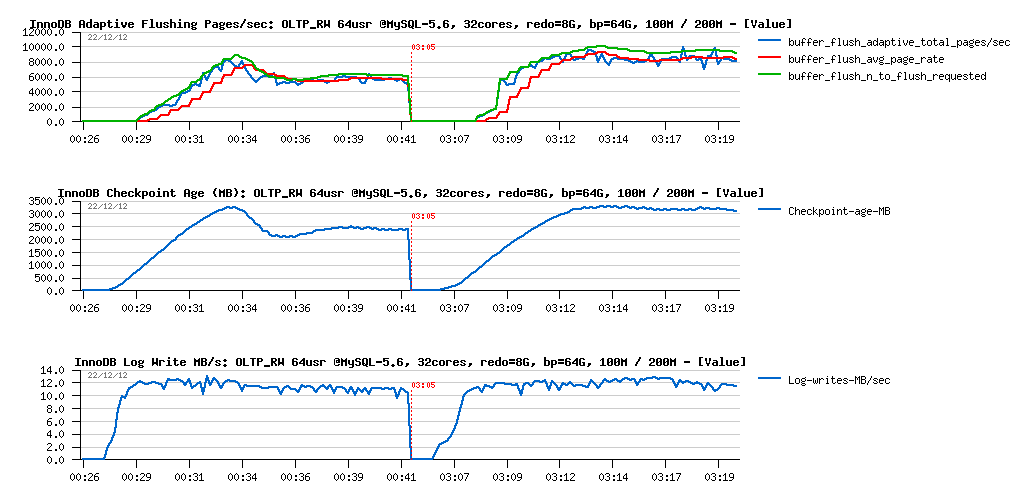
Observations :
- dirty page flushing became stable on 6000 pages/sec on 100M, and 8500 pages/sec on 200M - and as you can see it's not twice higher because of a twice bigger data volume
- Checkpoint Age remains far from 7GB limit, but still lower on 100M vs 200M
- while REDO log write rate remains near the same for both cases..
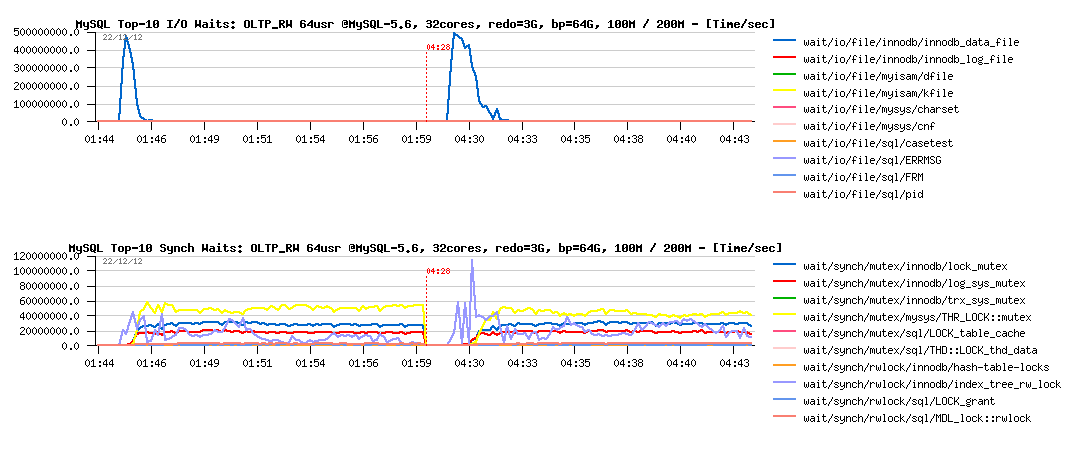
Waits reported by PFS :
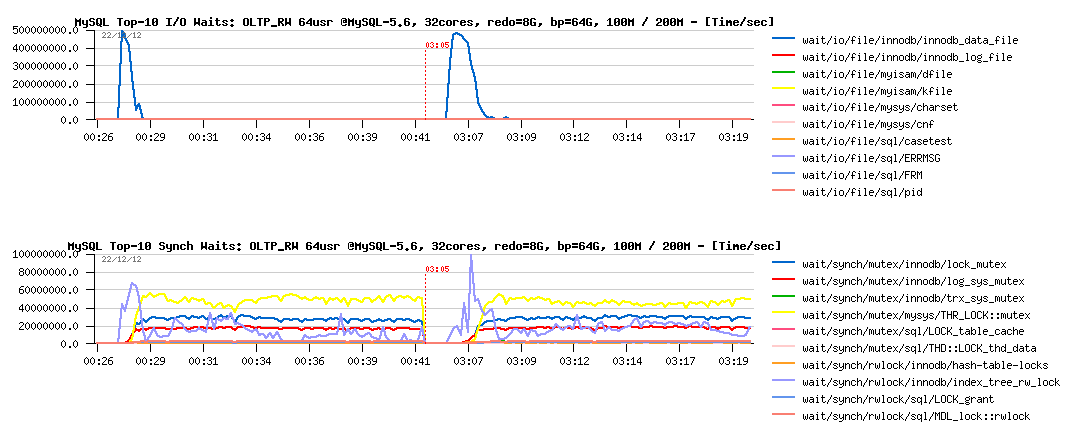
Observations :
- on the test start the I/O related waits are dominating (data reads)
- this also increasing index lock contention (due data reads), more higher on 200M
- then, main contention is moving to the lock_mutex (THR_LOCK::mutex wait can be ignored as it's only self-thread lock, not related to the concurrency)..
Let's reduce now the REDO log size to 3GB:
OLTP_RW 100M vs 200M, bp=64G, redo=3G :
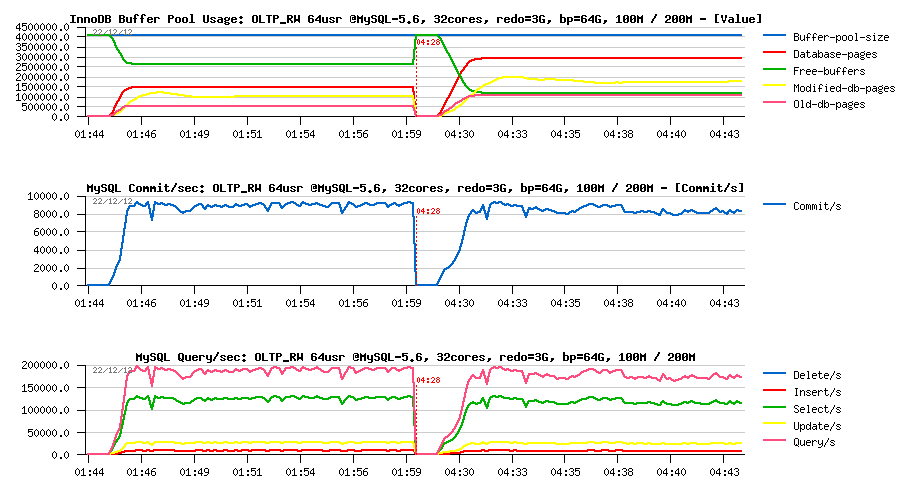
Observations :
- performance is slightly lower now on 200M comparing to the 100M volume..
- while on 100M volume the result remaining the same as before
What about flushing?
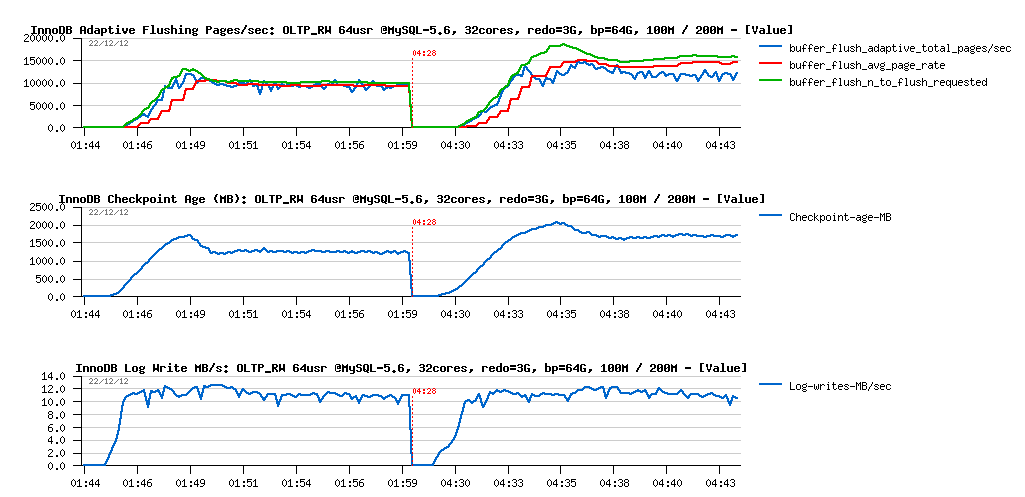
Observations :
- nothing abnormal on REDO log write speed, remains similar and stable in both cases
- Checkpoint Age became stable pretty quickly and then remains under 2500MB critical level
- then on 100M test we're running with a stable 10K flushed pages/sec
- while on the 200M test - you may see that flushing is reaching 15K pages/sec first, and than running on around of 12K pages/sec
- and what is interesting within 200M case: the flush avg page rate (red line on the graph) is no more matching the real pages/sec level (blue line).. - why? -- in fact the "avg page rate" is calculated internally within Adaptive FLushing code regardless the real flushing page/sec rate and indicates what should happen according Adaptive Flushing expectations (all requested writes should be finished during expected time); so, when it's not happening, and we're observing a deviation like here, it means that storage I/O level is unable to follow the write requests coming from InnoDB..
- And, of course, the main question since then is it really because of the storage the flushing rate is unable to follow the requested speed, or there may be some other reasons as well?..
Let's check our wait events :
Observations :
- well, there is no really any difference between 100M and 200M test case..
- but probably it's more different from the previous test with 8GB REDO logs?..
More in depth with wait events, all 4 tests together :
Observations :
- hm.. all 4 tests are looking exactly the same..
- maybe we're simply missing some critical instrumentations here?
What is great the in MySQL 5.6 there are additional instrumentation counters available for InnoDB via its METRICS table (from where I'm getting data currently presented for flushing rate). Another interesting data to monitor from there is the number of pages which were scanned during flushing process! Let's compare scanned pages/sec levels during all these 4 tests:
More in depth with flushing :
Observations :
- first of all you may see that we have a problem here: there is no reason to scan 200K pages/sec to flush only 5K pages/sec!..
- then, as you see, with a higher flushing level, yet more pages are scanned/sec, and this is simply wasting CPU time ;-)
- so, we have here the first problem to fix..
PROBLEM #1 : Too much pages scanned on flushing
- why it may happen?
- in fact this is related to the InnoDB design, and coming from a long date now: the flush list is supposed to be accessed concurrently, and in some situations the "previous" pointer in the list may become no more valid, so the flushing code should to rescan the list from the tail again to find next pages to flush..
- the fix is not trivial, and may require some in depth remastering of the code..
- but I've already tried to hack it little bit, and may confirm you we can remove this gap completely and save a lot of CPU cycles ;-)
- then, the real improvement will come once a parallel flushing will be implemented in 5.7 !..
But well, this is not the only problem ;-))
Let's see now what will happen if I'll change little bit test conditions to be more write aggressive on the same data volumes? -- I'll change Sysbench options now to keep only one "read" per RW transaction: only a single POINT-SELECT, this will completely change Read/Write operations ratio and involve much more writes than before. Let's call it OLTP_RW++ :-)
The following graphs are reflecting the changes.
and just to remind you about the order of tests on graphs from left to right:
- 100M, redo=8GB
- 100M, redo= 3GB
- 200M, redo= 8GB
- 200M, redo= 3GB
OLTP_RW++ 100M/200M, redo=8GB/3GB :
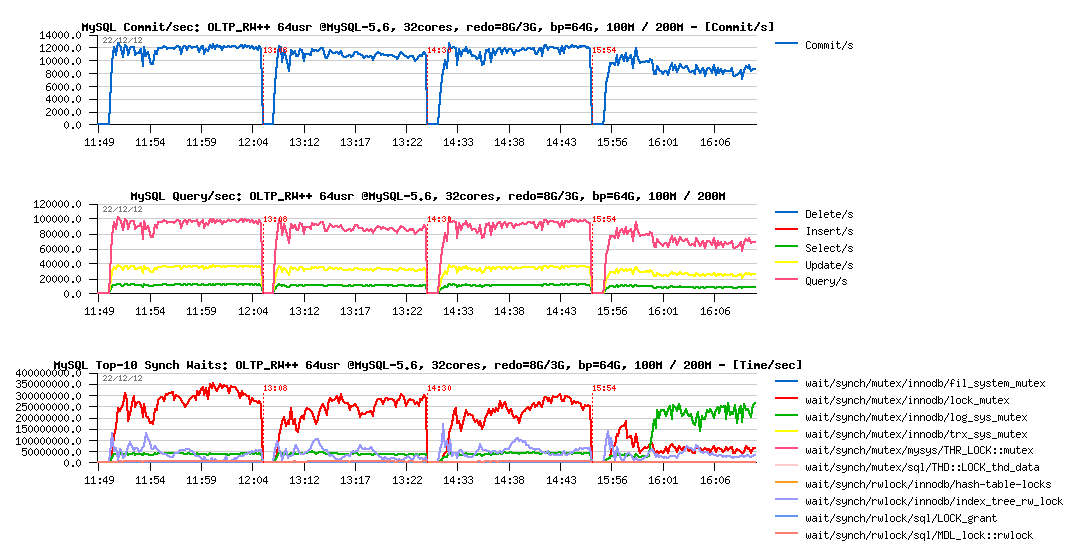
Observations :
- interesting that with 8GB REDO logs space both test cases (100M and 200M) having the same level of performance (and you may remark the higher number of commit/sec comparing to the previous tests, so even QPS is lower, we're writing much more now, see also the Updates/sec level)..
-
but with 3GB REDO logs things become more harder:
- 100M case seems to have a lower performance now
- and 200M performance is decreased even yet more and hitting log_sys_mutex contention (seems like flushing is not going fast enough to keep Checkpoint Age under critical level (2500M in this case), or REDO is hitting the read-on-write issue (verified: not hitting)
- interesting that on the 100M test case the levels of wait events are pretty similar
- however comparing to previous OLTP_RW tests, here the lock_mutex contention is really dominating
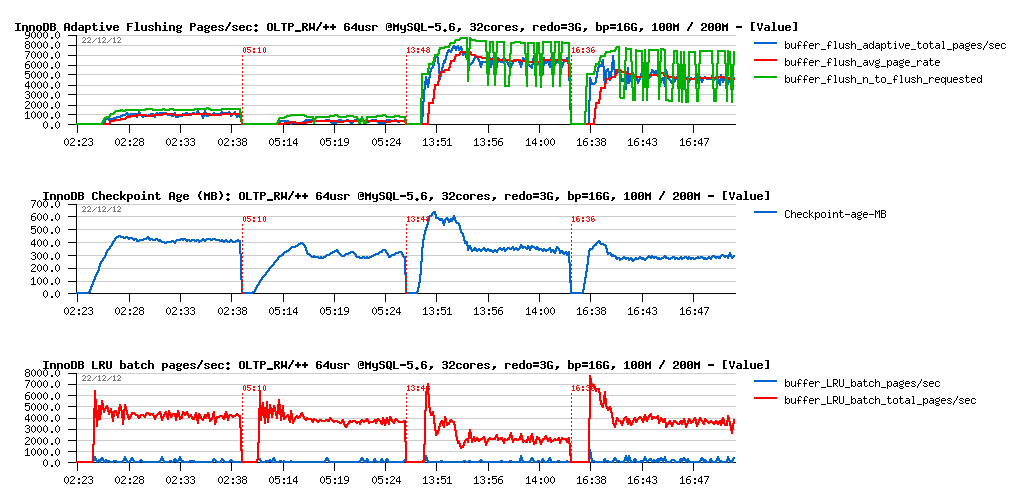
What about flushing?
Flushing details :
Observations :
- as expected, there is no problems on both volumes when REDO logs space is 8GB
- curiously the 10K pages/sec flushing level is looking here like the I/O border limit.. (while it's not really possible, as my SSD(s) are able to do more (verified before)..
-
then on 3GB REDO:
- 200M case is unable to follow the REDO writes and rising the 2500M limit, involving waits on a sync flush (as seen on the graph)
- 100M case is yet more interesting: we're fine with a flushing speed here, lock contentions times are not higher than with 8GB REDO, but performance is lower.. - why? - the answer is simple: each involved I/O is representing a cost + combined with lock_mutex contention resulting in performance decrease.. As well, I'm pretty sure that lock_mutex contention here is also having its effect on deviation of the flush_avg_page_rate, needs to be more investigated..
PROBLEM #2 : lock_mutex contention - Well, this one is just needed to be fixed ;-) (and I've also started this article by observing this contention - seems to be one of the next hot bottlenecks, depending, of course, on a workload).
And what is changing when we're short in memory? and instead of 64GB may allow only 16GB Buffer Pool size?..
The next graphs are representing the following workloads:
- OLTP_RW 100M, pool=16GB, redo=3GB
- OLTP_RW 200M, pool=16GB, redo=3GB
- OLTP_RW++ 100M, pool=16GB, redo=3GB
- OLTP_RW++ 200M, pool=16GB, redo=3GB
all the following tests used 3GB REDO logs size, no need a bigger one, and you'll see why:
OLTP_RW and OLTP_RW++ with 16GB Buffer Pool :
Observations :
- Checkpoint Age remains very low within all of the tests, so even 2GB REDO was more than enough here ;-),
- however flushing activity is now including also "LRU flushing" (happening mainly when InnoDB is looking for a free page in the Buffer Pool and need to recycle the most less used ones, but they are appearing to be dirty, so should be flushed first)
- and as well, bigger data volume involving a more intensive LRU flushing
- keeping in mind a low Checkpoint Age, we may already suspect performance regression (lower REDO write rate may only mean lower transactions rate)..
So, what about performance:
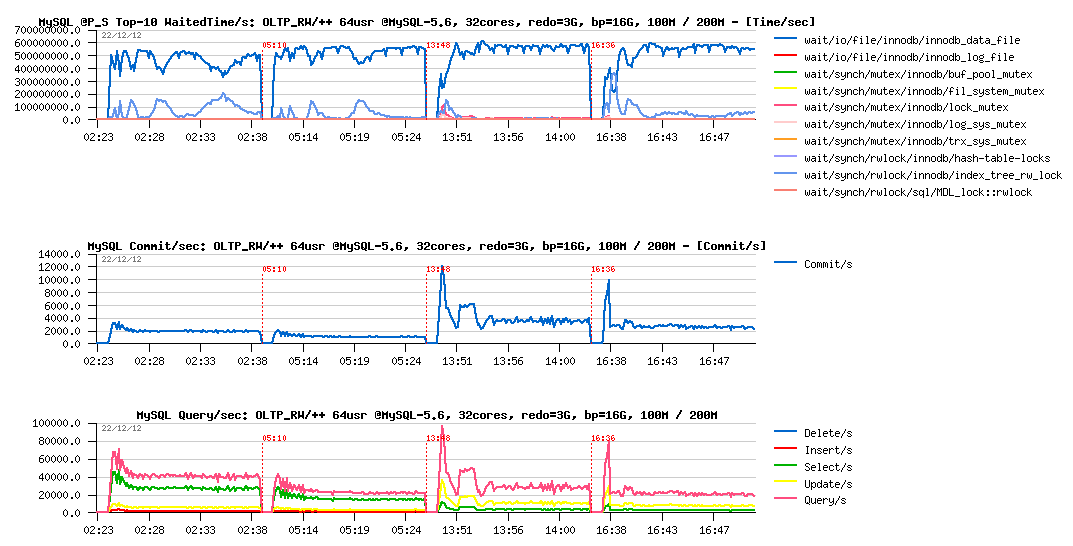
Observations :
- performance is something like x5 times worse now..
- however PFS is explaining very well why it happens: the main wait time is spent on the data reads! (and as PFS is also reporting now FILE_IO events too, I was able to go more in detail and see that for the particular Sysbench data file the read service time was several milliseconds, while OS is reporting not more than 0.3ms - so, there is something to investigate for sure)
But well, this workload is exactly the case when only faster disks may help you or using/buying more RAM (as you saw, with 64GB pool the result is x5 times better, while finding here yet more faster disks than SSD would probably not help as much)..
Then, to finish the story, let's replay something similar also on the DBT2 (very similar to TPCC-like) workload.
The next graphs are corresponding to the following test cases on DBT2 with 64 concurrent users:
- redo= 3GB, bp= 64GB, W50 (50 warehouses)
- redo= 3GB, bp= 64GB, W100
- redo= 3GB, bp= 64GB, W250
- redo= 3GB, bp= 64GB, W500
DBT2 redo=3GB, bp=64GB, W50/ W100/ W250/ W500 :
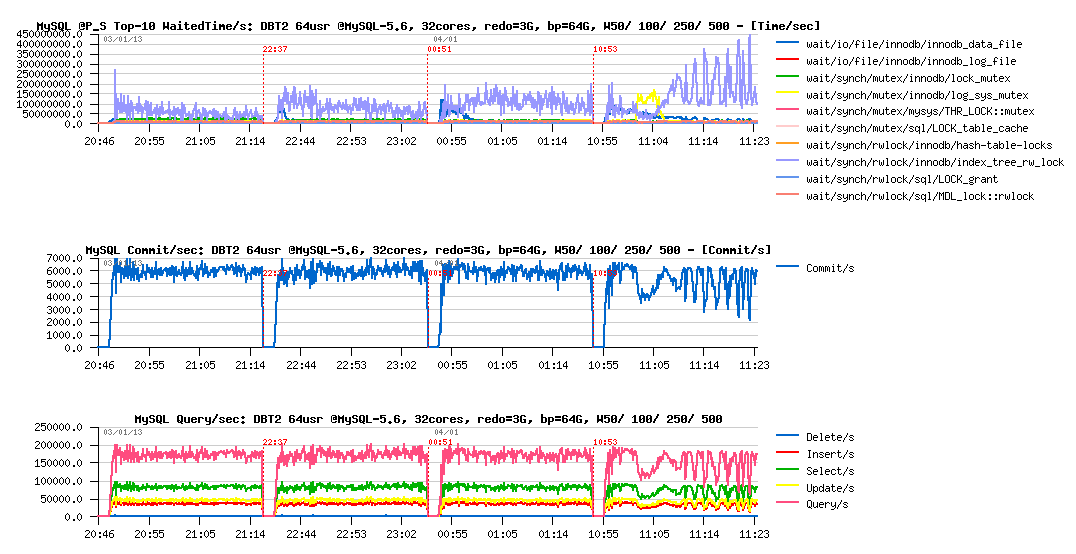
Observations :
- mutex lock contention is dominating here, and constantly growing with a bigger data volume
- up to W500 volume, performance is still remaining stable
-
but since W500:
- index lock contention seems to have a direct impact on QPS level
- looks like on the workload startup we're hitting a log_sys_mutex waits: seems flushing is not going fast enough, and Checkpoint Age is reaching the critical level, and the sync ("furious") flushing is involved (BTW, in 5.6 even "furious flushing" is not so furious as before ;-))
Let's get a look on the flashing activity now:
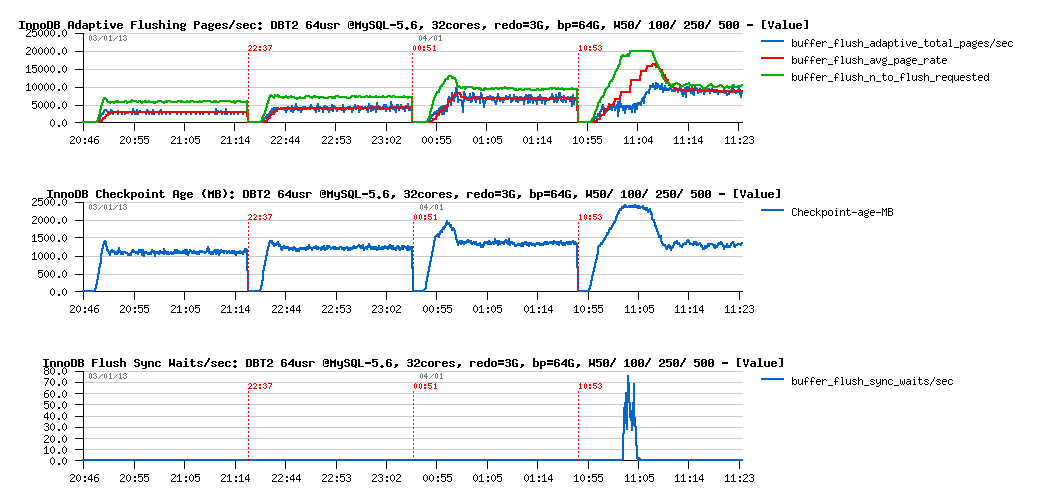
Observations :
- same here, up to W500 volume all things are looking pretty well..
-
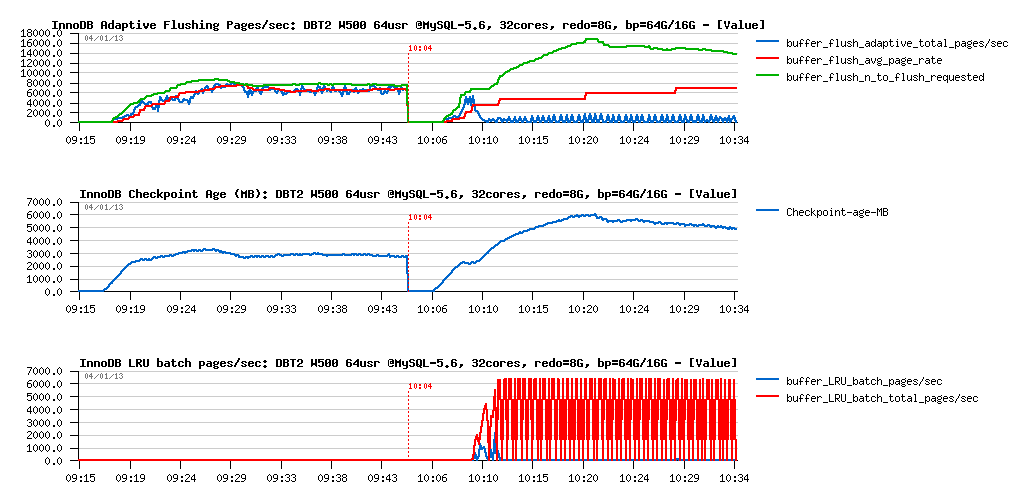
and on W500 it becomes much more interesting:
- looks like on the beginning the flushing rate is stuck on 5K pages/sec level and don't willing to grow even we're requested up to 20K pages/sec to flush! (look on the green line with flush "requested" and blue line with adaptive total pages/sec )..
- which is leaving Checkpoint Age growing unprotectedly, reaching 2500M critical level, and involving sync flushing (and sync flushing waits)..
- once the critical period of startup is passed, flushing is reaching a stable 10K pages/sec rate (again 10K?? why 10K?? :-))
- no deviation then with avg page rate (while here too scanned pages/sec level is many times higher than flushing)
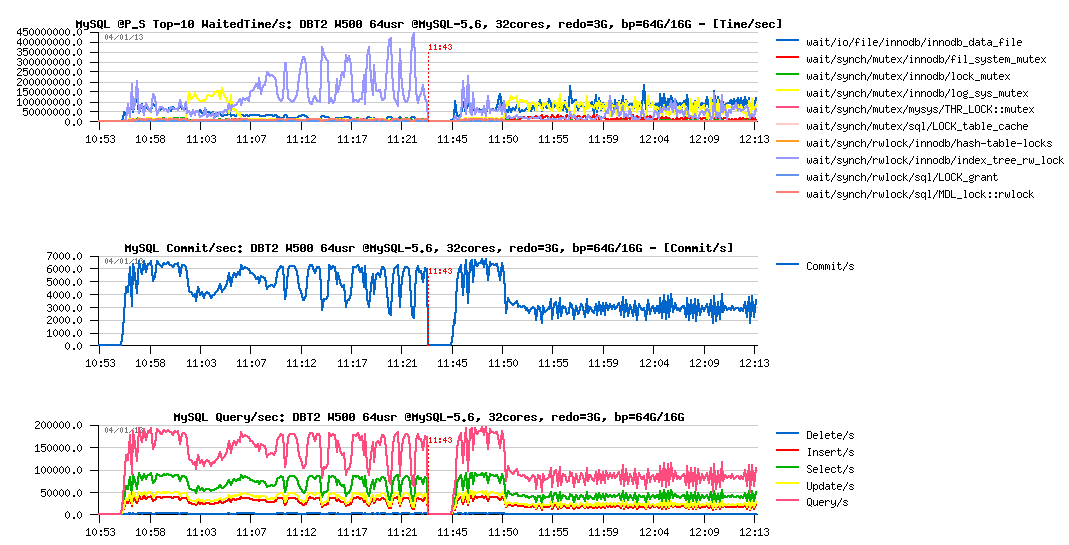
Let's focus more closely on the W500 case then.
We may easily expect that with a bigger REDO log size we will avoid sync flushing waits at least, but will it protect the workload from the QPS "waves" due mutex lock contentions?..
DBT2 W500 bp=64GB, redo= 8GB vs 3GB :
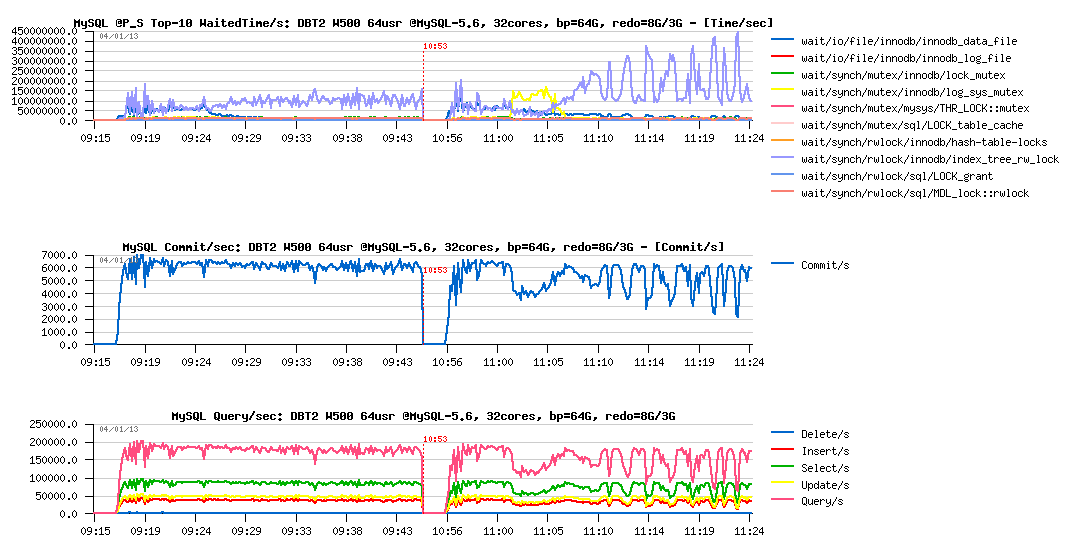
Observations :
- there is no more QPS drops or "waves" when 8GB REDO logs size is used (left part of graphs)
- seems like it's very directly depending on the index lock contention..
- as well there is no more log_sys_mutex contention, as expected: 8GB REDO space is big enough here to leave more marge for flushing on the test startup (note: on W1000 or W2000 volume it may be not enough again, depends on contention and storage performance)..
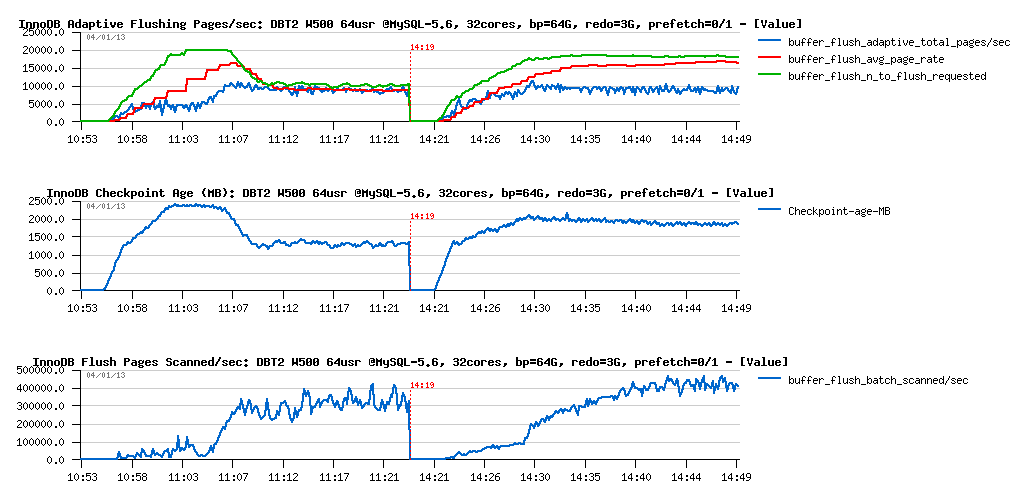
What about flushing:
Observations :
- things are radically different with 8GB REDO here.. - flushing rate is remaining stable on the 7K pages/sec
- but well, if index lock contentions are workload related, then we should also observe them on the 8GB REDO test too, right?..
- the feeling I have that the "waves" we observed are related to some I/O related limits.. We're hitting here something..
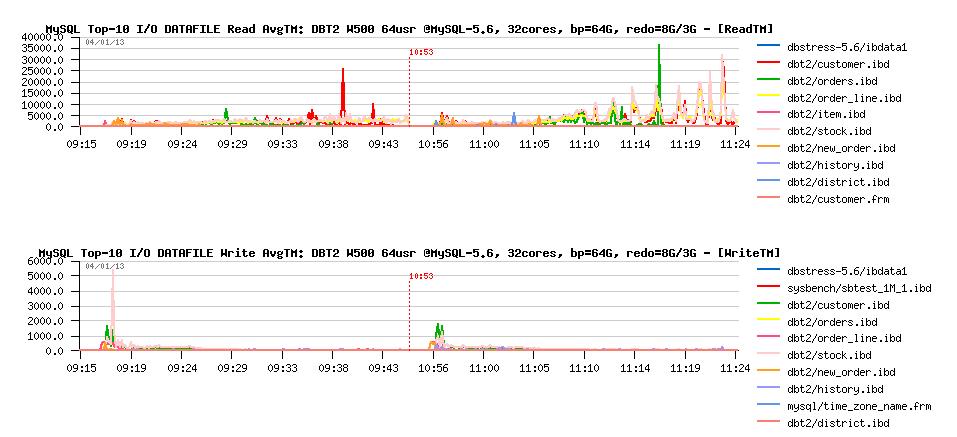
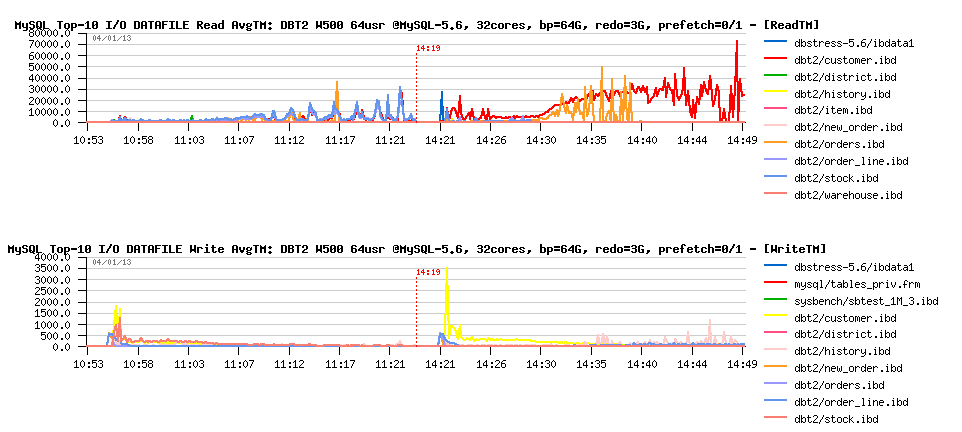
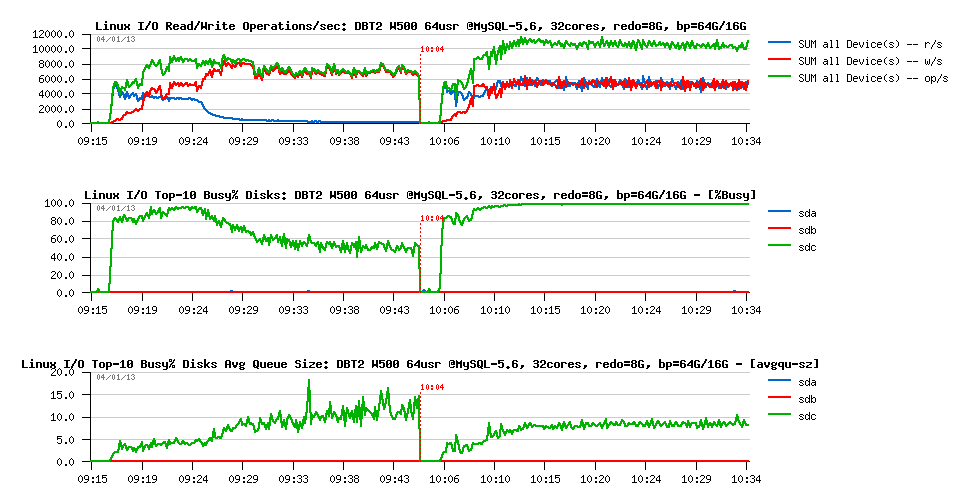
Let's get a look on the I/O operations stats during these both workloads:
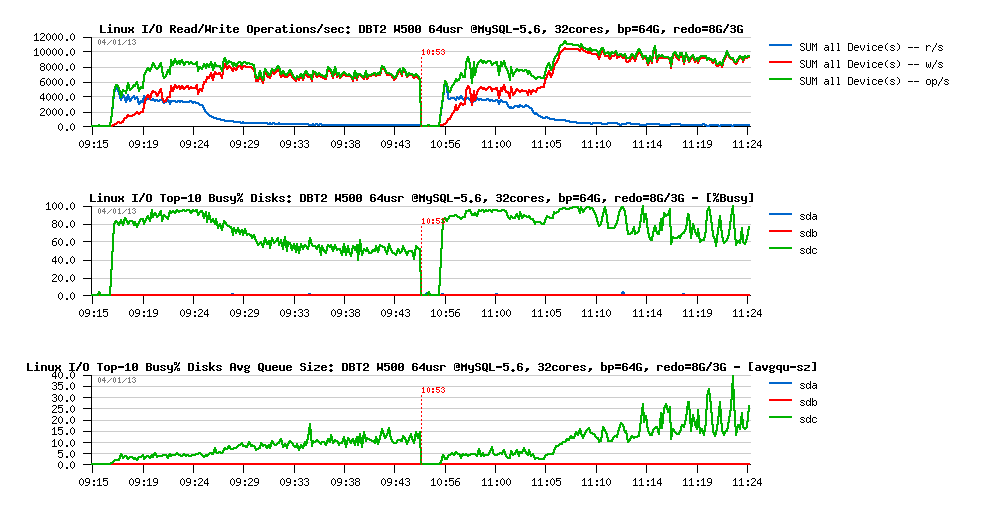
Observations :
-
we can see here clearly here the 2 phases on each workload:
- startup, when most of pages are yet reading from the disk
- and then a stable phase when most of the data arrived to the Buffer Pool, and writing become the main I/O activity
- and what is interesting that the "waves" phase is coming during a "stable" period
- however, the level of I/O operations rate is remaining pretty constant and has no such "waves"..
- so, why the "waves" are coming?..
-
the answer is coming from the I/O queue graph:
- it has "waves" (avgqu-sz), which means the number of I/O operations queued per second is varying over a time
- but the number of executed I/O operations remains the same.. - what does it mean?
- it may mean only that only a part of I/O requests from the queue was executed on time, and some of them may wait longer!
- however, OS is reporting that avg I/O service time (response time) was stable and around 0.3ms.. - but probably it's only because of writes?..
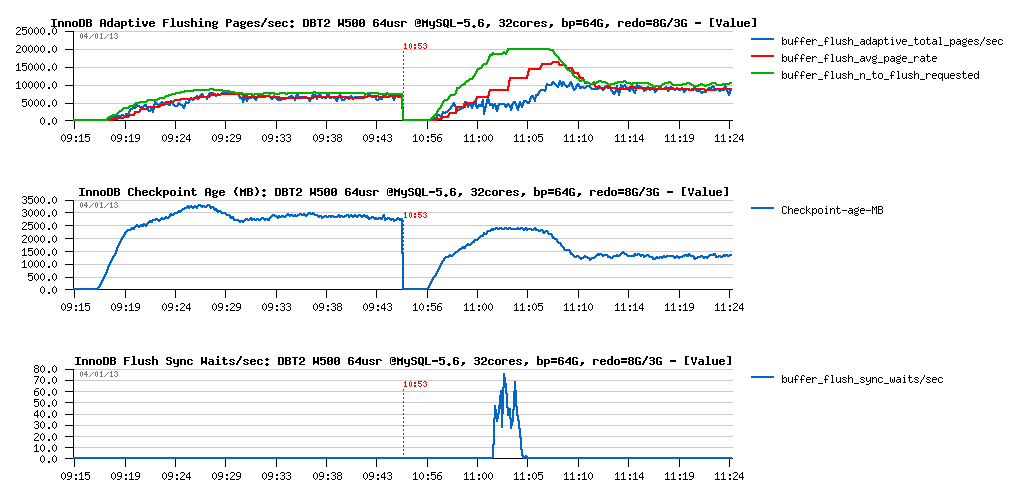
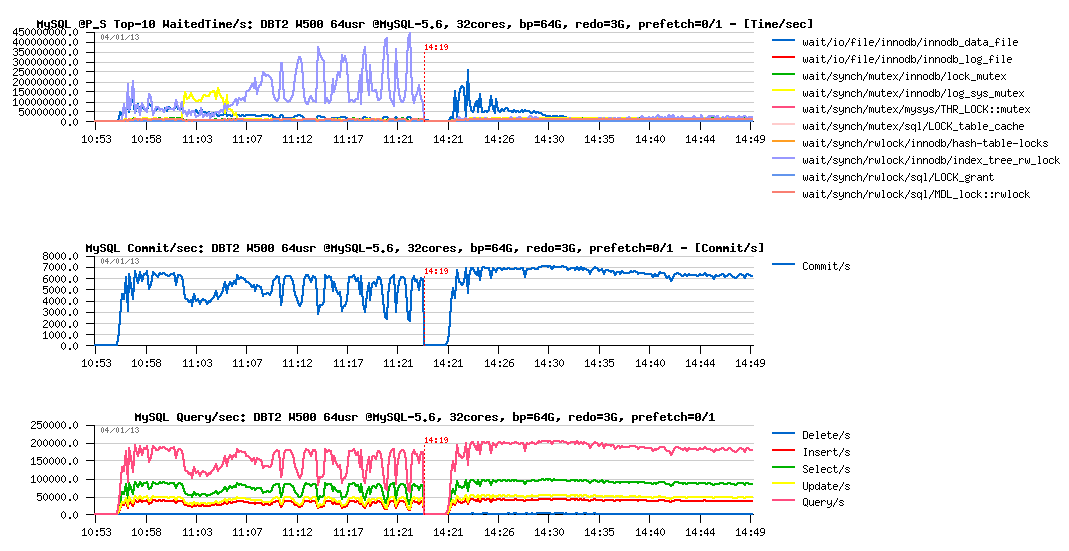
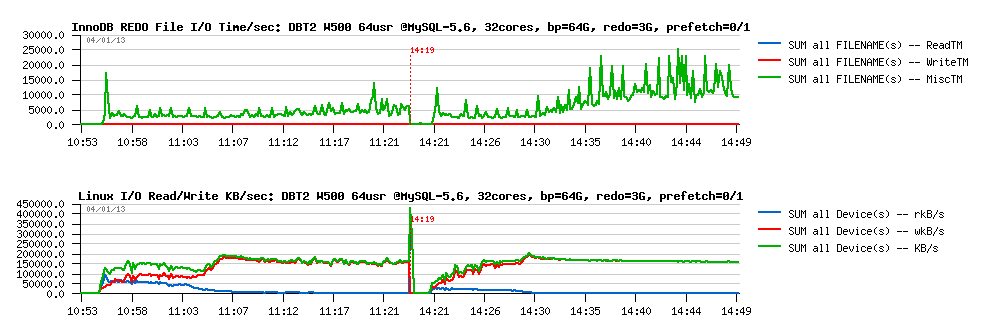
To understand if it's true or not, we may now get a help from MySQL Performance Schema (PFS) - remember that since MySQL 5.6 it reports now also various details about file I/O operations and times, and let's see it in action:
Observations :
- Bingo! if there is no any big waits on write operations, there are pretty important waits reported on reads!
- note that times are reported here in usec, means we have some spikes up to 35ms on reads... - hard to believe (specially when SSD is used), but cannot be ignored in any case (while probably a more detailed instrumentation is needed here to understand the problem better)..
However the question here is what is a main and what is a result event?
- do we have index lock "waves" because of the overloaded I/O queue?
- or because of index locks we're involving I/O requests in "burst" mode wave by wave?..
- there is something to dig here, and I'm impatient to see index lock just fixed (planned for MySQL 5.7) - it will resolve so many questions ;-))
But well, what I can try now is simply to prefetch most of the data before the test workload is started and then see what will be changed:
DBT2 W500 bp=64GB, redo=3GB, prefetch= off / on :
Observations :
- wow! did not expect it'll become so fun ;-)
- QPS level is just stable like never!
- performance is better (you may see that we out-passed 7000 commit/sec)
- and what is completely incredible: index lock waits are disappeared!.. - how it's even possible?..
Let's get a look on the flushing now:
Observations :
- another surprise: flush rate is the same 10K pages/sec (again 10K? ;-), but avg page rate is deviating now..
- the flush scanned pages/sec rate increased from 300K to 400K, but may 100K more scanned pages/sec explain deviation?
- seems to me until we'll not get it fixed, we'll not have an answer..
- or maybe is nome load conditions 10K random writes/sec become a real limit of the I/O level?.. (while on pure I/O test I've observed much more)
What about I/O stats?
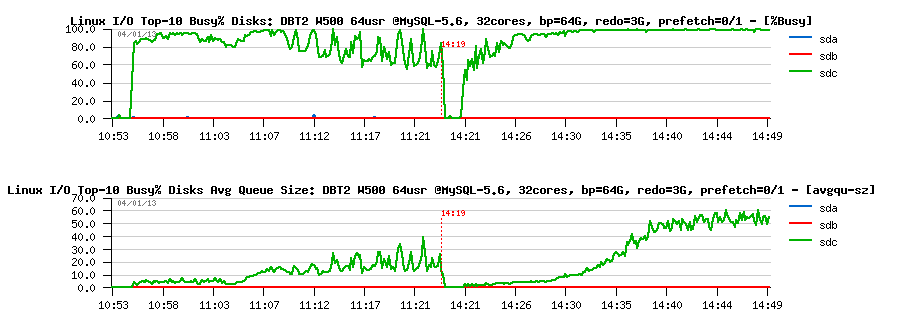
Observations :
- looks like my SSD(s) are fully occupied now (sdc - is /dev/sdc device corresponding to my RAID-0 from x3 SSD LUN)
- while I/O queue is out-passed 50 I/O operations and not jumping anymore..
Did we increase some I/O waits reported by PFS?
Observations :
- wow! avg read time is increased a lot on some of the data files!
- does it explain disappearing of the index lock contentions? (slower reads making less concurrency?) - very interesting ;-)
- seems to me here too a proper fix for index lock contention will really help a lot!
And what PFS is saying about I/O waits on the REDO log files?
Observations :
- wow! another surprise: we're spending more "Misc" time now on REDO logs I/O (I suppose it's about fsync(), but PFS currently grouping all non-read and non-write times under "Misc" time, so will be great to see them separately (at least fsync(), and may be some other?)
- interesting that I/O activity did not change.. -- do we really reaching the I/O limit? -- I still have impression that wait are coming not because we're hitting the I/O limitations.. - seems to me I have to trace the wait events yet more in depth..
PROBLEM #3 : index lock contention - this is not a new one either, very long dated, and the fix is pretty complex.. - so it was too short to get it ready for MySQL 5.6 timeframe. But once we'll remove this contention, I hope it'll clarify a lot of things ;-)
Well, let's not forget the test case when Buffer Pool was reduced from 64GB to 16GB. What we'll have on DBT2 W500?
DBT2 W500 redo= 3GB, bp= 64GB / 16GB :
Observations :
- ok, performance is x2 times worse (but only x2 times, so better than on Sysbench, once again confirms that regression depends on a workload)..
- however, the REDO log size is really small here, as over all test duration the log_sys_mutex contention is on the top waits position..
Better to replay it with 8GB REDO:
DBT2 W500 redo= 8GB, bp= 64GB / 16GB :
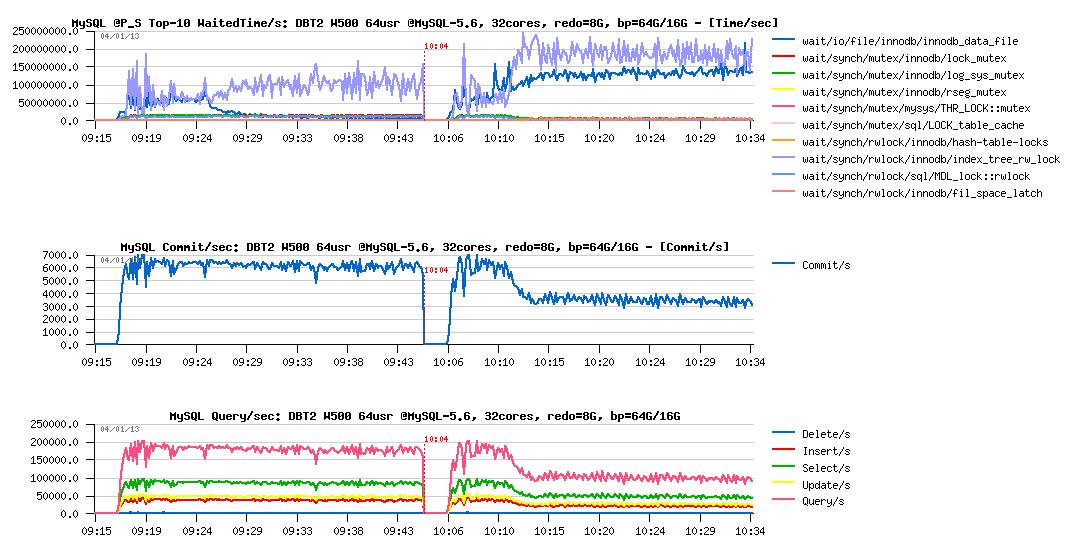
Observations :
- still x2 times performance regression
- but the main wait times now moved to the index lock contention and InnoDB data file reads (and seems to me each one depending on each other)
Flushing activity:
Observations :
- as expected, LRU flushing became dominating
- Checkpoint Age remaining stable, yet under critical level, so 8GB for REDO was enough
But well, looks like adding constant data reads now having the most important impact on performance regression:
However PFS is not reporting any important FILE IO waits:

So, looks like the I/O operations are less important here rather an overall lock contentions and LRU flushing design.. - and we definitively have something to do here (probably also implement a parallel flushing from LRU as for flushing list, or redesign it more optimally, let's see ;-))
NOTE: since MySQL 5.6 there is an option in InnoDB to tune the LRU scan depth (innodb_lru_scan_depth) to improve LRU flushing and make user thread waits mush shorter, but in the current test case it did not help due very intensive I/O reads..
INSTEAD OF SUMMARY
- While there is some mystery flying around current RW limits in MySQL, the one thing you can be sure: if your InnoDB "buffer_flush_avg_rate" constantly out-passing your "buffer_flush_adaptive_total_pages/sec" then you're hitting some limits on your dirty pages flushing!
- how to see it? - simple SELECT from InnoDB METRICS table (the avg rate is showing the current value, while the total pages is incremental, so you'll just need to do some simple maths to get pages/sec from here, probably I should write an article one day how I'm analyzing all this stuff, as every few days somebody is asking..)
- also, keep in mind that you may always reduce your flushing lag by increasing REDO logs size (while, of course, having too big REDO logs is not the only solution - just until we'll get it fixed ;-))
- then, if you're observing "lock mutex" or "index lock" (or other) contentions during your test or production workloads - please, bring us your details, it'll help us to fix them in the most optimal way (and not keeping in mind only our test cases)..
- well, MySQL 5.6 has already a lot of performance improvement, but yet more are waiting for us again to be done..
- some problems are known today, some new one yet will come (and I'm pretty sure Vadim and Peter will bring us yet more of them ;-)
- some will be fixed in MySQL 5.6, some will be fixed only in 5.7..
- but well, be sure we're taking all of them seriously, and working on them..
- so, stay tuned ;-)
to be continued...
Rgds,
-Dimitri