« August 2009 | Main | June 2009 »
Monday, 20 July, 2009
MySQL Performance: Why Ahead Flushing for InnoDB?...
Recently I've done several performance studies to find the most optimal way to fix the "furious flushing" observed during all my benchmarks with InnoDB. The initial report about this work you may find here including initially proposed patches. But analyzing test workloads with the latest MySQL performance build I think there is a need to go more far...
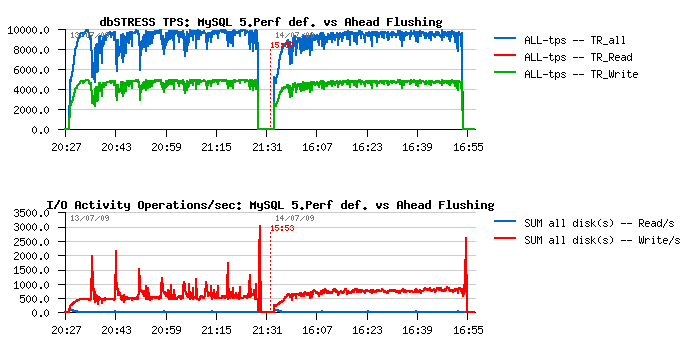
First of all let's me present you the result I've got on the Read+Write workload @dbSTRESS - first part of graph represents the TPS level obtained with MySQL 5.4, and the second part - with the latest MySQL performance build (#46):

This Read+Write workload is running non-stop during one hour within the same conditions in both cases:
- 16 CPU cores
- 32 concurrent user sessions
- innodb_thread_concurrency=16
- innodb_log_file_size=1024M
As you may see, reaching 10,000 TPS over 6,000 represents a huge gain! 66% to be exact. On the same time you may observe even more pronounced periodic performance drops due "furious flushing" (see also previous posts ).
Why it happens?...
The worst case during a high Read+Write activity on InnoDB arrives when the redo log has no more free pages! What does it mean?.. - it means that the oldest redo log data are still referencing on that moment to some modified (dirty) pages which are still kept in the Buffer Pool and these pages are still not flushed to the disk! So, redo log cannot recycle the oldest blocks until the oldest pages are not flushed!.. As you may imagine, what's going next? - At any price redo log should obtain free blocks to continue working (otherwise you may observe a total freeze of your database activity). So at any price it involving dirty pages flushing as fast as possible - it calls buf_flush_batch() function - and from my observations it may call it more than several thousands per second(!) - so we are far away here from respecting a system I/O capacity or other limitations - the goal here is to avoid a database activity freeze at any price!..
However, a short freeze is happening anyway - and as the result we may observe a periodic performance drops (my stats simples on the previous graph where 10 sec - and on the lower time interval it may be seen probably even better)..
Any solution currently implemented to deal with such a problem?..
- you may set InnoDB dirty pages percentage limit to the very low value (innodb_max_dirty_pages_pct) and force dirty pages flushing to be more aggressive
- you may use Percona's "Adaptive Checkpoint" patch (or XtraDB instead of InnoDB as well! :-))
BUT! As I demonstrated previously , on the really high Read+Write workload the Master Thread is never leaving a purge loop, so the innodb_max_dirty_pages_pct settings is never checked, as well Adaptive Checkpoint code (as it currently implemented) is not reached either...
So, what to do here?..
Supposing the purge loop is really necessary by design, my idea was to add a sort of "Ahead Flushing" inside of the purge loop. Why inside?.. - Until while Master Thread is leaving purge loop at least everything is still working as expected. The problems are coming when this loop become infinitive! :-)
My initial solution contained just 2 lines to add into the purge loop:
   if (UNIV_UNLIKELY(buf_get_modified_ratio_pct() > srv_max_buf_pool_modified_pct/2 )) {
     n_pages_flushed= buf_flush_batch(BUF_FLUSH_LIST, PCT_IO(20), ut_dulint_max);
   }
Which means: if the current level of dirty pages percentage is reached a half of the dirty pages limit setting - flush the next part of dirty pages aligned with 20% of I/O capacity settings.
Of course such a code changes is preferable to be optional and enabled via my.conf settings (for ex.: ahead flusing on/off, starting dirty pages percentage, how much of I/O capacity to use, etc.).. Then spending hours discussing with Mikael the probe patch was born - it's adapting automatically the flushing frequency according to the reached dirty pages percentage level and also respecting the max I/O capacity settings given by the user (Mikael absolutely insisted on this point)... Sounds very good! The only problem - it seems to be too light yet to face the "furious flushing" observed during the high Read+Write workload! And with the latest performance build the flushing become truly "furious" :-)
To go further, instead of the "light" solution I've added my initially proposed changes into the latest performance build and here is it what I've observed (first part of graph is corresponding to the default code, the second one - with added Ahead Flushing code):
It's still not optimal yet, but looks better then default:
- TPS level became more stable
- same with a writing activity
There are also positive changes on the checkpoint age and log writes stability:

Same for:
- pages activity
- dirty pages level

Well, it's already looks good, but should be much more better :-)
Looking for the optimal solution
- first of all not only the percentage of dirty pages should be checked but also the checkpoint age value! - the redo log may be out of the free blocks much more earlier than the dirty pages level will be reached!
- probably the mix with Percona's Adaptive Checkpoint will be the most optimal?..
- as well more instrumentation on the InnoDB code will be needed to increase internals visibility - for example it'll be nice to add few more statistic values into "show innodb status" saying how many times there was no more space in the redo log, how many times the buffer flush was called, etc...
- also: may we leave the purge loop time to time or not?..
What do you think?...
Any comments are welcome! :-)
Sunday, 19 July, 2009
MySQL Performance: Once again about InnoDB thread concurrency...
Even this topic was covered several times already, the question is still open - use or not to use InnoDB thread concurrency?.. And the only true answer here - "It depends" :-) and I'll try to make a short summary about the current state here.
The main current InnoDB bottlenecks are all mostly due to a high contention on internal locks. As all multi-threaded (as well multi-process) applications giving a concurrent access to its resources, InnoDB have to guarantee there is only one thread may modify a given resource on the same time. This guarantee is achieved by locking a resource in exclusive mode and implemented with mutexes. Depending on implementation, some locks may become very hot with a growing access concurrency. And it's exactly what's happening with InnoDB...
Things where improved a lot with Google patches and continuing with MySQL 5.4 version. But even if several lock bottlenecks were successfully removed, the lock contention is still here. Why it's a problem?.. - Usually when you have any kind of lock contention it's never linear! And with a growing sessions/users concurrency you may observe a dramatic performance drop (like your 32 users will work slower rather only 2, etc.)..
When you deal with inevitable locking which in any case cannot be avoided, but you still expect to keep the highest possible performance level AND growing workload - the only possible solution you have is to reduce a concurrency on the hottest locks. That's why I'm a part of people who thinking that InnoDB thread concurrency option is a very good feature! :-) I've already wrote about why, and here will just stop on two current InnoDB thread concurrency models:
Default Model
The default model was greatly described by Percona Team. In short InnoDB places all threads (sessions) into its execution wait queue and keeps no more than a given number of active threads on the same time (set with innodb_thread_concurrency=N option).
Positive/Negative:
- (+) reducing a lock contention!
- (+) each thread (session) is guaranteed to have a CPU time within a given time period!
- (-) uses a lot of locking itself, so not scaling very well...
Timer-Based Model
Introduced within MySQL 5.4, this model is looking very promising and performs much more better! And you may read from Mikael's blog how exactly it works .
Positive/Negative:
- (+) lock contention reduced even better!
- (+) short sleeping used instead of locking, so scales better!
- (-) no guarantee that each thread (session) will have a CPU time within a given time period - may be a problem since 512 concurrent user sessions (until 512 it's still ok)...
As usual, one image says more than many words:
Since 32 active user sessions setting innodb_thread_concurrency=16 helps a lot!
Main problem of both models
But both models are still suffering of the same problem: when any of "active" threads (sessions) is doing an I/O operation (disk read) it continues to keep its "active" state (and I/O operation may take tens ms(!)) - while another session may during this time already get its data cached from a buffer pool and finish its query!... So sometime you may observe a significant global performance drop during a such moment!.. - Ideally each session before doing an I/O operation should remove itself from an "active" state and leave others working. So, there is still a room for improvement :-)
The optimal solution
- There is no optimal solution :-)
- Always monitor your workload and check your buffer pool state, buffer hits, page reads, I/O activity and number of active/concurrent sessions
- If you have more than 32 concurrent sessions and low I/O read activity - setting innodb_thread_concurrency=16 will help
- Otherwise leave innodb_thread_concurrency=0
- And always continue monitoring! :-)
Any comments are welcome! :-)
Monday, 13 July, 2009
MySQL Performance: 5.4 and new Performance builds
Recently new performance builds were made by our MySQL Team, and it seems to me reaching now a new milestone with the build #45 - within this single build Mikael joined several previously tested performance builds showed a positive performance improvement. So, how well it's comparing now to the default 5.4 ?..
Here are my results obtained on M5000 (quad-cores)/ Solaris10 update7 and db_STRESS.
Solaris 10 update7
Special note about update7: I was pleasantly surprised the kernel locks issue was gone! CPU Spinlocks within a similar workload are devided by 4(!) - very positive improvement, and seems the things will be even better with update8!
Read-Only Workload
For my big surprise there was no difference (or very few) between 5.4 and build45 on the Read-Only workload. I need to retest it again after vacations to be sure nothing goes wrong here :-)
Read+Write Workload
However the performance improvements made on write operations are quite important!
As you may see, there is still a performance drop in the middle of the test - it's due a "furious flushing" while using a huge redo logs (described before ). There are new changes coming to face such kind of issue as well some others - stay tuned! :-)
Sunday, 05 July, 2009
dim_STAT: Version 8.3 is ready!!! :-)
Dear friends/users!
I'm pleased to announce you the new release of dim_STAT - v.8.3 !
This is a mainly maintenance update release, just to fix all trailing issues before a big move to the v.9.0 :-))
Here is a list of some changes:
Fixes:
- security issue on STAT-service!! (special thanks to Marc Koderer @LHS to find it!)
- execution of dim_STAT-CLI from the web services
- fixed LANG=C and LC_ALL=C via the main STAT-service script
Improvements:
- Optional Admin password may be given on a database creation and then it'll be required for any admin action!
- Database error messages are now handled separately from LOG messages
- Java WebDRAW Applet updated
- add color LEDs near hostnames to signal running or stopped hosts
- add #Records column to have an idea about a number of database rows per collect
- Admin LOG management is working more friendly now with a long lists of messages :-)
- STAT-service daemon may listen exclusively on a given IP address now [IP:port]
- Whole database backup is added to the Admin menu
- etc..
Database schema:
- iostat disk names are extended to varchar(64)
- all float values are moved to float(25,5) to have an easy human reading :-)
- Add-On name limit is 14 characters now
Report Tool:
- wiki-like syntax is added to simplify writing!
- look & feel updated
- some minor fixes here & there :-)
New Add-Ons:
- HAR v2 (visit http://blogs.sun.com/openomics/entry/cpu_hardware_counter_stats for more details)
- Solaris CPU Set STAT (mpstat -a)
- Linux MPSTAT v2
- MySQL STAT
- InnoDB STAT
- InnoDB I/O STAT (adoption of Neel's DTrace script http://blogs.sun.com/realneel/entry/inniostat_innodb_io_statistics )
- PgSQL STAT (PostgreSQL)
- ZoneLOAD: zoneid => zonename
EasySTAT additional options:
- COMPRESS=gzip (compressing of output files)
- TIMER=yes (auto-timestamping within output files)
Also, since this 8.3 version dim_STAT is moving to GPLv2 license! Most of source code will be published in parallel with binaries - and with time you'll probably find it ported on any platform, even Mac :-)
As well several things are added to simplify a knowledge sharing between dim_STAT users:
-
this blog is added now on my site: http://dimitrik.free.fr/blog
and it contains a special category "dim_STAT" - you may subscribe on
it to stay updated about any news or features coming with dim_STAT
- there is a dim_STAT on Google Groups now: http://groups.google.com/group/dimstat - you may share here all your best practices, additional stuff you have, ideas about new features, etc. etc. etc. (For example, there is a STAT-service daemon rewritten in Perl by Marc KODERER (http://search.cpan.org/~mkoderer/ ), ZFS stats add-on added by Roman IVANOV (http://blogs.sun.com/pomah/entry/monitoring_zfs_statistic ) and many other you may google for, but now may all be referenced from the same place)..
And finally following users requests a "Donate" button is added for those who wants to support the development of this project and see new features coming faster! All credit cards are accepted! :-))
As usually you may download both versions (Solaris & Linux) from http://dimitrik.free.fr
Have fun! :-))