« May 2010 | Main | December 2009 »
Friday, 23 April, 2010
MySQL Performance: Why Purge Thread in InnoDB?..
I've got many questions during User Conference about InnoDB Purge Thread feature. And I've promised finally to write a short blog post explaining this feature in details and specially why do you need it :-) Don't know if it'll be short, but hope you'll have less questions by the end of this article.. :-)
So far, during the User Conference we presented the following graph to demonstrate the InnoDB Purge Thread in action:
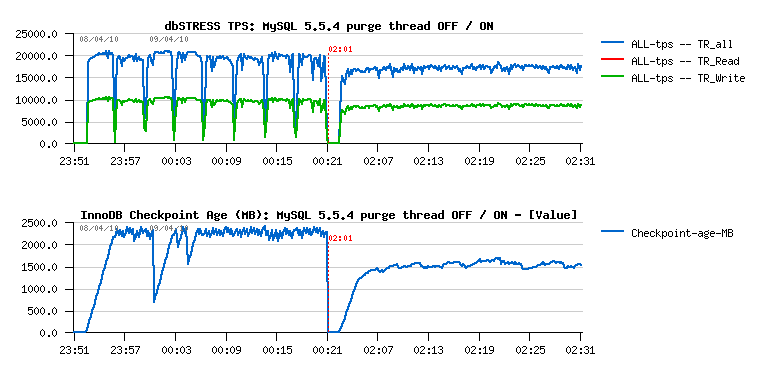
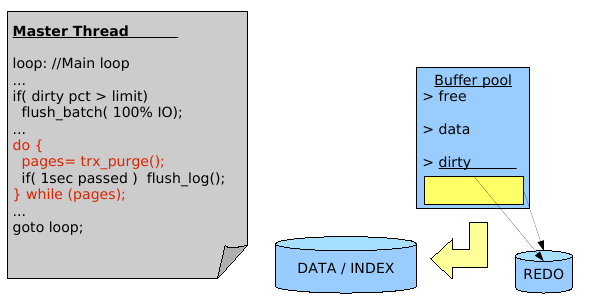
This graph represents 40 min of non-stop activity under dbSTRESS Read+Write workload with 32 user sessions. On the left part of graph you may see the TPS level observed while a purge thread is turned off. And on the right part when it's turned on. From the graph you may see that once purge thread is activated it makes transactional throughput free of all periodic freezes of activity (and seen here as TPS level drops)... And curiously many people manly retain just "ok, it makes the picture more beautiful, but it reduces overall performance, so will keep in mind, but not sure I need it" or "as it reduce performance, I'll avoid to use it, thanks"... The problem that it's not so simple :-) I've wrote many times last year about the purge problem (and if you want all details, the end of the story yo may find in this report ). But in few words - lets get a look on the following chart, it represents the processing logic of the Master thread in InnoDB (also called background/maintenance thread):
Comments :
-
Master thread is manly looping and doing a list of maintenance tasks
(like involve a buffer flush if the percentage of dirty pages
out-passed a given value; involve redo log every second flush if
needed; involve purging if there is some data to purge; etc.
-
But regarding the purge activity: purge processing is involved from a
loop, and what is important - Master thread will never leave
this loop until there is still something to purge!
-
What does it mean?.. - it means that until you have any data to purge
(and during a heavy read+write transactional activity there will be a
lot of things to purge) the Master thread will stuck on the purge loop
and never process any maintenance tasks which are attributed to
its role! - it means it'll never check the percentage of the dirty
pages you have, and the number of dirty pages will grow within your
buffer pool without any control! - it means all features like adaptive
flushing/checkpoint will be never executed too! - as well many other
maintenance actions will be never reached..
-
What then happens next? - each dirty page is referenced within InnoDB
redo log records; InnoDB redo log is written in a cyclic manner (once
it reached the end of the redo space it starts to reuse its records
from the beginning); to be reused, each redo records should be freed
first; redo log cannot reuse its records until they are still
referencing some dirty pages; as the Master thread is not leaving the
purge loop, no action will be involved to flush any dirty pages at
all; so once your redo log space become filled to its critical level,
InnoDB will try to get a free redo space at any price - and
will involve a massive buffer flushing operation (without regarding to
your I/O capacity setting, etc.) - it needs absolutely obtain free
space to avoid a freeze.. - but such a massive buffer flushing may be
then observed as "stop the world" (largely depends also on your
storage too) - and usually you'll observe a drop on your database
activity similar to those periodic TPS drops I've presented on the
first graph here..
-
You still have a choice here - to avoid such activity drops you may
use smaller redo log files: as your redo space will be smaller, you'll
hit your critical limit faster, so your activity drops will happens
much more often, but will be much more shorter as well - and it'll
give you a kind of illusion of stability :-)
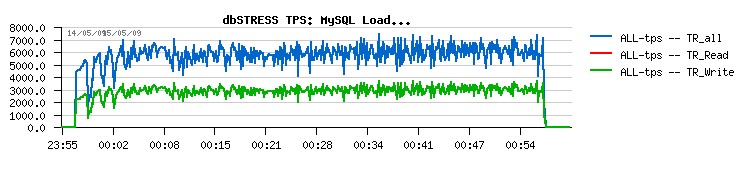
Let's get a look on the following graphs:
128MB redo log :
1024MB redo log :
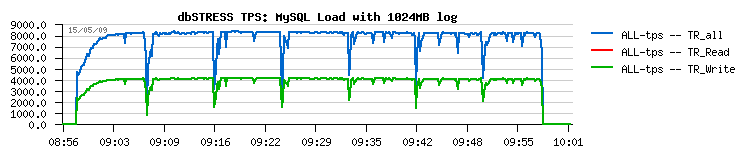
As you may see:
- 128MB redo log size gives a more "stable" result, without periodic drops
- while 1024MB redo log size gives a more than 30% performance improvement over 128MB :-)
- but anyway, don't forget that even having 128MB will still do not solve the main problem with a Master thread - it'll still stuck on the purge loop and not complete any other assigned to its role tasks...
Well, let's continue :-)
-
How to recognize if you're in a such a situation? - mainly you have to
monitor your History Length value: if it continues to grow your purge
processing is unable to follow your transactional activity.. Then
monitor also the level of your Checkpoint Age - if it jumps too often
to its max critical level while adaptive flushing/checkpoint is set on
- then you're very probably in the similar case too.. Well, the most
easy will be simple to add a counter inside of the "innodb status"
output which shows how many times the free space in redo logs was
missed (and may be some others ;-))
- How Purge Thread helps here? - it completely removes all purge related activity from the Master thread! - so it gives you a guarantee that InnoDB will process as designed! and Master thread will not miss anymore any of its tasks :-) While purge activity is separated into an independent thread and live alone focused on the one single task - purge! :-)

- So, why my performance may decrease when I'm activating Purge Thread?.. - purge processing is quite heavy! - and when purge is done correctly it'll bring an important additional overhead. I'd even say that purge is driving InnoDB performance: until it's done right you'll observe the real performance of your database, otherwise it'll be hard to consider observed performance as longterm... For example, during my experiments with purge code I've accidentally reduced purge activity.. - what was the result? - I've got x2 times better performance! :-) great! but who will need such an improvement? :-) - what will become your database after several hours of activity?? ;-) - first it'll grow with all these unpurged data, then more and more non-valid data will be mixed with real rows making many queries slower and slower.. - don't think you'll be happy finally :-)
So far, after all that said, don't know about you, but all my future benchmarks will be executed only having purge thread settings on :-) And, honestly, if you think well, having purge thread enabled should be a default InnoDB configuration, and probably just the only one.. - but it's my personal opinion.
History
The story with a Purge Thread started for me in Dec.2008 when during my dbSTRESS tests I've observed that any of my dirty page percentage settings was simply ignored by InnoDB, and periodic performance drops happened during every test. Folks from Percona claimed that it's due missing adaptive checkpoint feature, and in Jan.2009 I've made another series of test and demonstrated that the same issue is present in XtraDB too. Then after various testing I went finally into the InnoDB source code and started to trace it in depth to discover that Master Thread is not leaving purge loop.. On that time the same problem was reproduced not only on dbSTRESS workloads, but on DBT2 too. And finally in Aug.2009 with a common effort from Sun/MySQL teams the Purge Thread feature was born, and I've published the patch for MySQL 5.4 that anyone may try and test before it'll come with a next 5.4 release. It was not just an idea, it was a ready for production solution :-) The only problem that from 5.4 branch there was a decision to move to the InnoDB plugin branch on that time, and after all organization and other problems this feature was officially integrated only now, in Apr.2010. But there was nothing "peeked at XtraDB" here.. - it was the result of a long and common work of Sun/MySQL teams. However Percona curiously very quickly forgot from where the solution is coming from.. And I never even think to write it until I did not see this "peeked at XtraDB" list ;-)
Future
There are still several things to improve:
- it'll be fine to have a CPU affinity option for purge thread (in case you have more than 8 cores on your server it'll be more optimal to run purge on a dedicated core and with a highest possible priority)..
- in case if one purge thread is unable to follow a database workload and not purging fast enough - it'll be fine if InnoDB will automatically start another purge thread in parallel (or more depending on demand)..
- and I still have some other ideas.. ;-)
Any comments are welcome! :-)
Sunday, 18 April, 2010
MySQL Performance: post notes after UC2010
It's not notes about the Conference itself, but about Performance :-) There were many topics discussed and presented around InnoDB performance during UC2010, but time was limited to start long talks as another session interesting as well should start within 5 min :-))
So I've prepared a short summary with some points I consider important on configuring InnoDB to run it optimally, but if I missed something, or you don't agree with me - please comment! :-))
Storage layout - I strongly advice you to separate your data and redo logs, and place them on the different storages/arrays/disks.. - Why?.. - just because of the different I/O nature: redo log activity will mainly generate sequential writes, while data reads/writes are mainly random (specially indexes) - so if you mix these I/O activities together you'll have worse performance for sure (even if you use SSD).. As well if you have binlog activated - don't forgot to place it on the third different storage place to avoid to loose at once the data and binlogs in case of storage corruption..
Double Write Buffer - very nice feature of InnoDB, but if you want to avoid any performance problems when using it you have to move it on the same storage place as your redo logs [see detailed analyze of the problem on my previous post: InnoDB Doublewrite Buffer Impact ]
I/O Capacity - choice for this setting depends directly of your storage capacity, so first check what is the limit of your I/O subsystem in term of write operations/sec (not only sequential, but also random writes - and choose something in the middle) - the I/O capacity setting then is used to drive the speed of buffer flushing (dirty pages writes) to the storage; setting this value higher will involve more aggressive writes, lower - less aggressive; you even may use it to limit the write speed of one of the MySQL instances ;-)) - but keep in mind, if your activity out-passing the buffer flushing speed - earlier or later your redo log space will be nearly full, which will involve "urgent flushing" which ignoring any capacity settings :-) - and will just require to flush all blocks as soon as possible.. - My usual setting here is 2000 for a decent storage. But the real answer you'll have only if you monitor your system activity (I/O stats) and your database (checkpoint age, history length)..
I/O Read/Write threads - this setting is also directly depending on the storage capacities: you have to know how many I/O operations your storage is able to process in parallel (many storage may be limited to 16-32 parallel I/O operations (depends on controller capacity too)) - so you're better to check before to be sure about your values; of course monitoring here again is the best friend :-)) I'm usually set the number of read and write threads to 16, however rarely seen more than 4 parallel I/O operations addressed to my storage even on dbSTRESS (and it's hard to say is it because my storage is fast enough, or because I/O threads are not sending fast enough :-)) - BUT! since 5.5.4 there is a new feature - native AIO support on Linux! - which in theory may very easily generate 256 requests in parallel (or much more) - which in some cases may simply kill your storage performance.. - so you may they need to find a way to limit the number of parallel I/O requests on the system level (very easy on Solaris, no idea about Linux :-)) - as well it'll be probably fine to have such an option included within InnoDB to avoid to bother with OS ;-)
InnoDB thread concurrency - this setting is still useful while your database is serving many user sessions: as there are still a lot of lock contentions inside of MySQL/InnoDB, more working sessions you have in parallel - more lock contentions you have; so then your 128 users working in parallel will not have better performance if they were only 4 or 8... For the 5.5.4 version the current most optimal setting is 32 (if needed) - before 5.5.4 it was 16 - and what is curious, it's completely independent on the number of CPU/cores you have on your server (so it's clear we made a huge progress with 5.5.4 :-)). But again, you have keep in mind that InnoDB thread concurrency management is absolutely not aware if one of the sessions "allowed for execution" is doing I/O operations or not! - so if your workload is not CPU-bound, but I/O-bound - it's very possible that you'll need a higher value to get better throughput. Once again - monitoring is your friend :-) and looking on how many sessions are on execution (inside) or in queue may help to understand and better adapt your database to your activity.. Also, this setting is dynamic, so can be changed at any time according workload.
Number of buffer pool instances - this is a very new feature
coming with 5.5.4 and need a particular attention. On most of our tests
the most optimal result was obtained by setting it to 16. But - it
doesn't mean it will be optimal in any cases ;-) To understand why you
have to understand the initial problem of the buffer pool mutex: before
for various page operations within a buffer pool you were need to
acquire the buffer pool mutex - and as it was the only one(!) single
mutex for all your sessions - it's clear there was a huge bottleneck...
- It was clear from a long time, but it was unclear at all how better to
fix it :-) One of the possible solutions was proposed within XtraDB. But
5.5.4 implementation seems to be better as it also showing improvements
even on a read-only workloads! And I would say you it was the major step
in the whole 5.5.4 performance improvement effort. - Why? - just because
it was the main door to open before to see any improvement from all
other features! - for example applying only 128 rollback segment feature
without having buffer pool mutex fixed will lower your
performance by x2 or x3 times! - just because by removing rollback
segment mutex contention you'll hit harder than ever the buffer pool
mutex!.. So, I'd like to send my kudos to 2 folks here - because even if
I've oriented and analyzed solution prototypes on my tests, the main
code was invented and written by Mikael Ronstrosm, and then finalized
(which has a lot of merit) by Sunny Bains. And I see in this work the
first step of the common efforts from the MySQL and InnoDB engineering!
:-) Kudos, Gents! - it was absolutely great! :-)
But, finally, why the setting of 16 instances may be still not
optimal?.. - don't forget that your data are less or more random, and
randomly they may be places to one of 16 buffer instances, and randomly
your workload may access pages from one instance more often than from
others, and even mostly access only one from 16 instances - and in this
case you'll see a similar contention as before with a single buffer pool
mutex... - So the work is still continuing, stay tuned ;-))
Redo log file size - 128MB may be optimal in many cases, but with a bigger value you have higher performance (moving to 1024MB on dbSTRESS shows more than 30% better performance) - but in case of crush you may spend much more on recovery (but if you'll move to 5.5.4 this recovery time probably will be way shorter then you seen before? ;-)) - as well you should not forget about the innodb_log_files_in_group setting, because it's innodb_log_files_in_group * innodb_log_file_size will determine the whole size of your redo space (don't leave it by default) - for my part I'm using 3 files of 1024MB on my tests..
Flush commit policy - of course for the best data security you have to set innodb_flush_log_at_trx_commit=1 - but what is the real danger to set it to 2? (means redo log is still written on each commit, but flushed once per second) - if you don't trust your server and it crashes all the time I understand it'll be very risky.. - But it your server is running like a switch watches - what is the danger then?.. ;-) All the stuff needed to be written is written, and even if MySQL itself will crash - files still will be flushed to the storage by OS within next few seconds.. - And in case of the real HW problem you'll probably anyway need to restore the latest backup... - So why limit performance of a swiss watch?.. ;-))
I'll be curious to know what is your preferred setting generally, and particularly for 5.5.4 :-)) Please extend and comment (specially if you're as me sticked in SFO due canceled flights)...
(BTW, speaking about monitoring - don't miss dim_STAT (UC2010 presentation is here ))
Then few words about UC2010 itself anyway :-)) - personally I was impatient and absolutely happy to meet all folks face to face and discuss finally live :-)) - you may tell me what you want about a virtual reality around us, and sometimes it even looks like real.. :-)) - but nothing is better than meet real people around a real beer! :-))
Tuesday, 13 April, 2010
MySQL Performance: 5.5.4 @dbSTRESS
Today we have something to celebrate - the MySQL 5.5.4 was announced! And a huge number of performance improvement made in this version make me very happy :-))
I've got an immense pleasure to participate in this story and seek for the most optimal solutions together with all these talented engineers from MySQL/Sun/InnoDB/Oracle teams (and in few months all Oracle :-)) - and I think it was a huge step ahead to see how well we may all work together :-))
And now I'm happy to share with you my results obtained with MySQL 5.5.4 on dbSTRESS benchmark. All tests were executed on the 32cores Intel server running Fedora 10 and having 128GB RAM and absolutely fast internal SSD drives (and if from the memory I've used only 16GB for the buffer pools, the SSD drives helped a lot to reduce any dependency on the I/O activity).
Test scenario :
- Workload(s): Read-Only, Read-Write
- Sessions: 1, 2, 4, 8, 16, 32, 64, 128, 256
- Think time: 0 sec. (non-stop)
Tested InnoDB engine implementations :
- MySQL 5.5.4
- MySQL 5.1.45 with innodb plugin 1.0.6 (I did not test the integrated innodb because we've already demonstrated it last year that 5.1 with integrated innodb is way slower comparing to any other InnoDB engines implementation (including innodb plugin :-))
- XtraDB-9.1
Abbreviations used in graphs :
- concurrency: innodb_thread_concurrency settings
- suffix -prg1: means engine was started with a one purge thread (to see why separated purge thread is needed and what are the benefits you may read my benchmark report when we were the first to propose and published the purge thread patch.
- X axis: number of sessions
- Y axis: number of transactions per second (TPS)
Read-Only Workload
Read+Write Workload
Relaxed Read+Write Workload (10 Reads per Write)
I'll not go too much in details for the moment, but you may already see that:
- MySQL 5.5.4 is reaching higher TPS levels than others
- MySQL 5.5.4 is better prepared now to scale up to 32 cores
Of course it's not perfect yet, but there is already a huge progress was made! Even get a look on the last year's graphs and you'll see what I mean ;-)
More data will come, so stay tuned ;-)
Saturday, 10 April, 2010
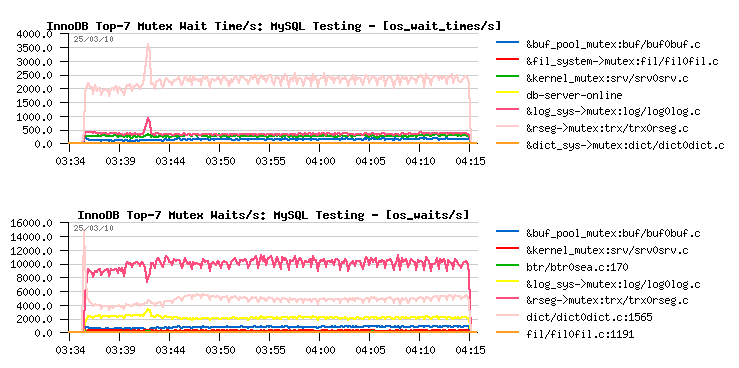
New features in dim_STAT v.8.5 for InnoDB Monitoring
Last week the new version 8.5 of dim_STAT was shipped. Along with other new features, there is a new Add-On was introduced since this version: innodbMUTEX. The data collecting by this Add-On are based on the "show engine innodb mutex" output. And it's not only able to scan the "standard" output, but also the "extended" output as well (by extended I mean if with debug options or with a little bit of hacking you'll force InnoDB to print other mutex wait values - they are already present within a code, but by default enabled only for debugging currently). For example in my case I wanted to analyze if in every case a mutex having the highest number of waits/sec will be also having the highest waited time.. - And it was not always true :-) But at least it's true for the rollback segment mutex:
Other previously introduced Add-Ons were also updated (mysqlSTAT, mysqlLOAD, innodbSTAT), and you may get more details about them from here .
As well I'm presenting dim_STAT during MySQL User Conference next Wednesday at 4:25PM - so if you have any questions/ need more information - don't miss a live story :-) Of course I'll also speak about dbSTRESS (as it's fully integrated into dim_STAT from a long time) and hope to play a live demo with live data from several recent tests - so it should be fun :-)
To download the Linux or Solaris version of dim_STAT: http://dimitrik.free.fr
Thursday, 08 April, 2010
dim_STAT v.8.5 is here! :-)
Hope it's the last 8.x version release and the next one will be really the v.9.0 :-)
Curiously there were still many things to finish before to say yes, we
may start a new version tree :-))
First of all I was surprised to
discover some minor bugs and prefer to fix them still within v8 rather
to bring them to the v9 again :-)) Then there are some new and very
powerful improvements which cannot wait so long :-)) And finally I've
also wanted to bring some order into distribution/packages version-ing
and resolve historical ambiguity of names :-)
So far, this release is jumped to the v.8.5 not because you're missed v.8.4, but just because within a STAT-service packages I've started to tag new updates with "ready for 8.4+" which bring ambiguity when you're still using the v.8.3 :-)) So, since this release you may find a VERSION file included withing every STAT-service package, dim_STAT distribution, or already installed dim_STAT server. This file contains the version number of dim_STAT as well the OS/platform information. Hope it'll simplify many things from now :-))
As well, the list of all main changes coming with release:
Fixes :
- Database Password fixed (curiously nobody reported it until now - it's fine to know that most of users are not paranoid :-))
- CPU Count was not exact in some conditions within Multi-Host graphs
- Empty graphs are skipped within Report generations
- Updated documentation :-)
Improvements :
-
New Analyze option: Extended Multi-Host Analyze - it combines now the
classic multi-host interface + all single-host bookmarks! - you're
able now to mix on a single page your multi-host graphs and per host
graphs coming from bookmarks! :-)
-
Bookmarks links now also available for the Multi-Host too - at any
time get a more detailed view per each host available via Bookmark
graphs! :-)
-
Surprisingly there was still a room for performance improvement on
WebX - new code is running even faster than before and particularly
when generating a long list of graphs! (which is also dramatically
reducing a generation time of Reports :-))
-
STAT-service is now accepting the syntax with command_name[:port] - it
gives a possibility to run several STAT-service daemons in parallel on
different ports, and according the port number assign a different
final command for the same "stat name" (for ex. see how to collect
data in parallel from 3 different Oracle instances running on the same
server: name[:port]
feature )
-
Graphs accidentally involved with a too large list of items now will
be auto-reduced to the lower number of items and include a short error
label within a legend
EasySTAT additional options :
- Additional LOG option may be used in cases the EasySTAT output should be redirected to a file rather to be printed to the standard output (when it should to be not mixed with output from other programs/daemons running in parallel)
New Add-Ons :
- UDPstat (Solaris: UDP traffic stats)
- innodbMUTEX (MySQL: detailed InnoDB MUTEX monitoring (available since InnoDB plugin 1.0.4))
As usually, you may download all distributions from the main site: http://dimitrik.free.fr as well I'm looking for solutions to mirror at least distribution packages as the download is not always as fast as expected from "free.fr"...
Any comments are welcome! :-)