« October 2014 | Main | August 2014 »
Monday, 29 September, 2014
Indeed, MySQL 5.7 rocks : OLTP_RO Point-Selects 8-tables Benchmark
Indeed, MySQL 5.7 rocks ;-)
This is the part1 of the following
blog posts about various benchmark results on MySQL 5.7 - and this
particular one is dedicated to the Sysbench OLTP_RO Point-Select
8-tables workload.
We've already published the over 500K QPS on
SQL Point-Selects before @32cores-HT server, so may reconfirm it again
with MySQL 5.7 DMR5 -vs- other engines :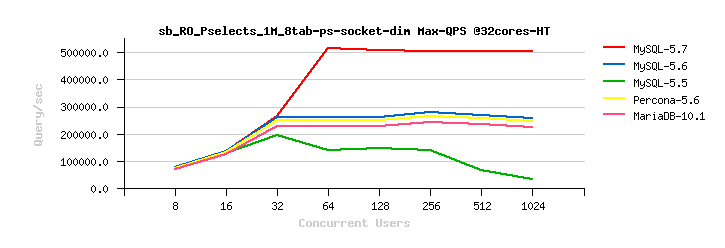
and
now on a similar server, but with 40cores-HT we're able to confirm 645
QPS on the same workload!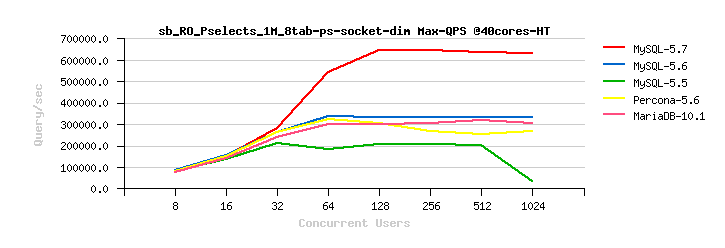
If
you missed the long story about how we arrived on such a performance
level and how to reproduce the test - you may find all here.
This workload is the most killing from all Read-Only Sysbench OLTP
tests.. And it's really for the first time we started to scale here with
MySQL! - look here (all results are from the 40cores-HT server) :
MySQL
5.5 :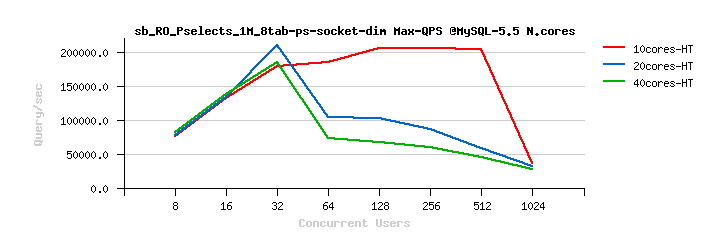
MySQL
5.6 :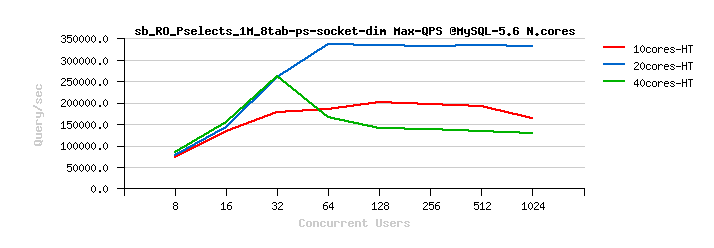
MySQL
5.7 :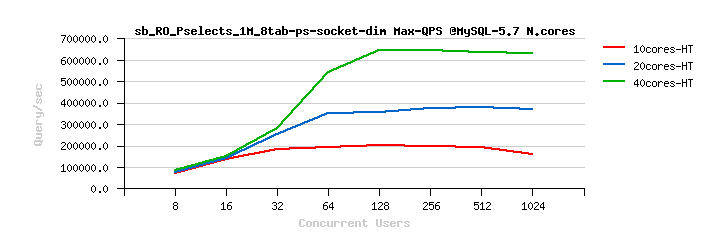
Percona
5.6 :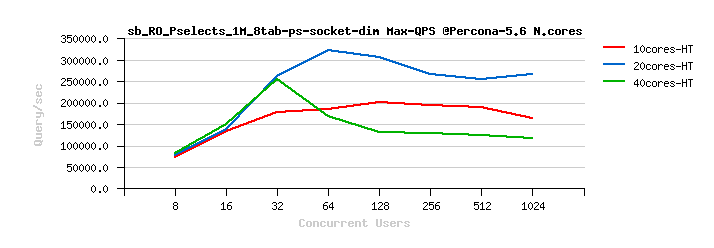
MariaDB
10.1 :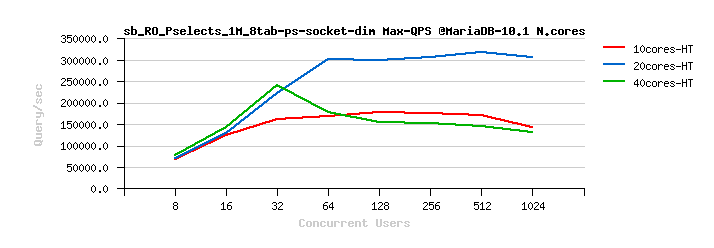
As
you can see, only MySQL 5.7 rocks here ;-)
However, if you
remember the full story, this workload is extremely depending on every
extra bits and even insignificant overhead.. - personally it's very rare
that I saw a RDBMS workload to be so close to HPC problematic ;-)) -- to
remind you that to reach 500K QPS (and 645K QPS here) was necessary to
use UNIX socket instead of IP socket and an older Sysbench version
binary (v0.4.8) which has just little bit less instructions than the
v0.4.13 I'm currently use and will be able to get only 575K QPS on this
server..
will tell you yet more during my
talk on Wednesday, 1/Oct.
to be continued..
Sunday, 28 September, 2014
MySQL Central @ OpenWorld 2014 : Speaking about MySQL Performance

Oracle OpenWorld 2014 is starting today, and MySQL Central Conference
since this year is taking a full part of it. I'm very happy to be there
and have 2 talks :
- MySQL 5.7 : Performance and Scalability Benchmarks | Wed, 1/Oct. | 2:00 PM - 2:45 PM | Moscone South - 252 | CON5066
- MySQL Performance : Demystified Tuning and Best Practices | Thu, 2/Oct. | 10:45 AM - 11:30 AM | Moscone South - 252 | CON5097
so I'll be able to say more this time and mostly focus on the Benchmarks results & analyzes on the first talk, and then mainly focus on the tuning and the latest MySQL 5.7 design improvements to allow you to reach yet more higher & stable performance levels.
I have several "fun" stories to tell you around the latest findings around MySQL 5.7 Performance we made, and problems we've solved (or newly found ;-)) Don't know if I'll have a time to blog about all of this one day.. - while telling you these stories live during the conference is much more easier, so hope to keep you awake and have fun ;-) Indeed, there is no doubt, MySQL 5.7 rocks and it will be the next the best MySQL release ever.. - and I'll tell you why ;-)
Then, once again, I'm regretting I cannot clone myself to attend all the conference talks in parallel.. - there are so many valuable presentations in the program that it's really hard to decide where to go.. I may only advice you to attend all of them (you and your clones ;-)) -- this excellent Agenda Summary is telling all..
And don't miss the MySQL Community Reception @OOW 30/Sep. 7PM-9PM (you need just to register yourself via this link to help organizers with logistics ;-))
see you there!
Friday, 19 September, 2014
MySQL Performance: More in depth with LinkBench Workload on MySQL 5.7, MariaDB 10.1 and also Percona Server 5.6
This is the next chapter of the story started in my previous
article and related to the updated
results on LinkBench workload published by MariaDB..
Keeping
in mind that the obtained results are completely opposite from both
sides, I've started to investigate then the same LinkBench-150GB 64
concurrent users workload from the "most favorable" possible test
conditions on the same 40cores-HT server as in my previous article:
- InnoDB Buffer Pool (BP) = 150G (so, all the data may remain in memory)
- innodb_flush_log_at_trx_commit=2 (so, REDO write are not flushed once per second and not on every transaction)
- no checksum, no double-write, no compression, no atomic IO, etc..
- just a base-to-base comparison..
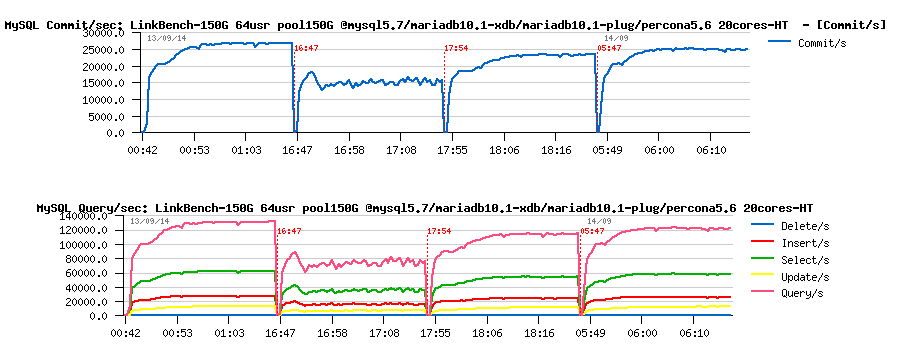
And the probe result was the following, with a still better TPS on MySQL 5.7 (left) than on MariaDB 10.1 (right) :
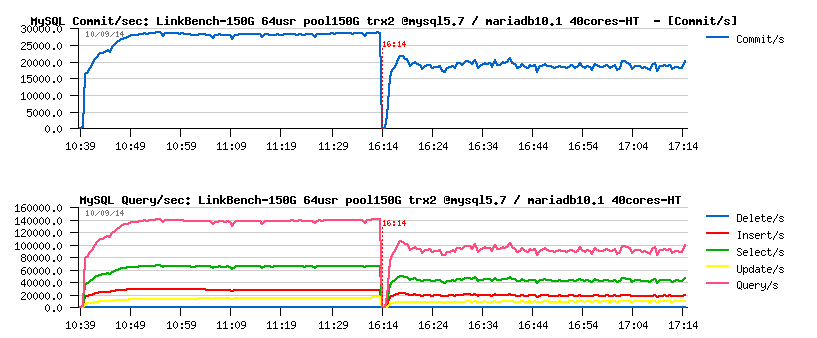
NOTE: I'm obtaining my TPS numbers from reported by MySQL server its Commit/sec rate. I did not use for that the results from the LinkBench log file.. From what I can read in the log file, my TPS x 3 is less or more equal to the level of operations/sec reported by LinkBench, but I'm not looking for the moment for the best result in absolute, but rather a difference in performance between MySQL and MariaDB engines..
But well, my surprises started then come one ofter one ;-)
- first, discussing details with Fusion-io Team, I've discovered that my flash card is not supporting atomic IO ;-)
- so, all the previous tests with atomic IO on MariaDB you may ignore (and indeed, this explains also why the results are exactly the same with and without atomic IO ;-))
- then I discovered that 32cores reported in MariaDB config testing are in fact 16cores-HT (16cores with hyper-threading, 2 threads per core).. - and this could play a significant role as having less CPU cores may lower an overall concurrency during processing, and as the result - a lower lock contention.. - but is it so? - have to check..
- but the most killing one was the last one: from Jan's comments I understood that MariaDB 10.1 is using XtraDB by default, and even this version of XtraDB code was modified to have some features from MariaDB's own changes on InnoDB, and InnoDB engine should be used than as plugin (while I was pretty sure I'm using their InnoDB code as all their new options were accepted)..
So far, I've then replayed the same test again, but within the following conditions:
- MySQL server is bound to 20cores-HT only
- MariaDB is using its own InnoDB plugin
- EXT4 is used as filesystem to avoid any other potential surprises ;-)
- 1h or 1.5h test duration to avoid doubts about dramatically dropping TPS levels..
The result was very surprising, and I've finally added also Percona Server 5.6 into the game to clarify the things ;-)
And here is what I've observed, from left to right :
- MySQL 5.7
- MariaDB 10.1 with XtraDB (default)
- MariaDB 10.1 with InnoDB (plugin)
- Percona Server 5.6
Observations :
- indeed, MariaDB with its InnoDB plugin is performing better then with its XtraDB which is used by default..
- on the same time Percona Server 5.6 is preforming way better than MariaDB with its XtraDB..
- so, I may just suspect that there are some problems in MariaDB with XtraDB integrations..
- while Percona Server is doing better than MariaDB with any engine
- and MySQL 5.7 is doing better than anyone ;-)
What about lock contentions?
The picture is completely different here too:
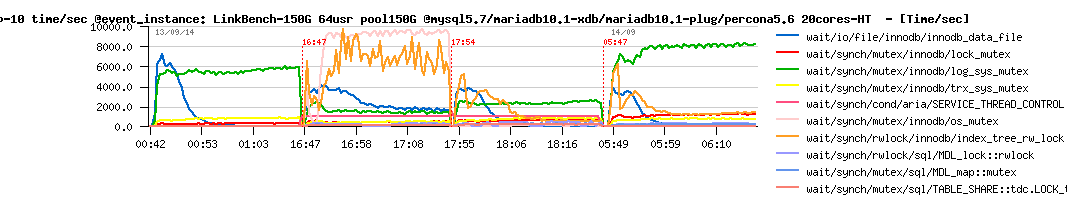
Observations :
- for my big surprise, the index lock contention is going down on both MariaDB and Percona Server
- log_sys mutex contention is dominating for all..
So far, let's see if now running on full 40cores we have a better performance?
From left to right, the same test is executed on 20cores-HT and then on 40cores-HT on:
- MySQL 5.7
- MariaDB 10.1 with InnoDB (plugin)
- Percona Server 5.6
Observations :
- surprisingly a very small gain on MySQL 5.7 on move from 20 to 40cores..
- near no gain at all on MariaDB..
- and yet more surprising - a regression on Percona Server..
- indeed, there is something yet more to investigate as there is no reason to not win at least 50% in TPS on 40cores with 64 concurrent users..
- NOTE: I'm not blaming LinkBench here, as it's very possible that the show-stopper is inside of the database code rather in the test code itself..
And hope an analyze of the lock contentions will say us little bit more:

Observations :
- as you can see, the log_sys contention is growing on the move from 20 to 40cores on all engines
- while Percona Server is also hitting a growing lock_sys time..
But if this is only about the locking, then probably we can improve the thing little bit by tuning the InnoDB spin wait delay?
The same test on MySQL 5.7, but with progressively increased spin wait delay :
- innodb_spin_wait_delay=6 (default)
- innodb_spin_wait_delay= 12, 24, 48, 96, 192, ...
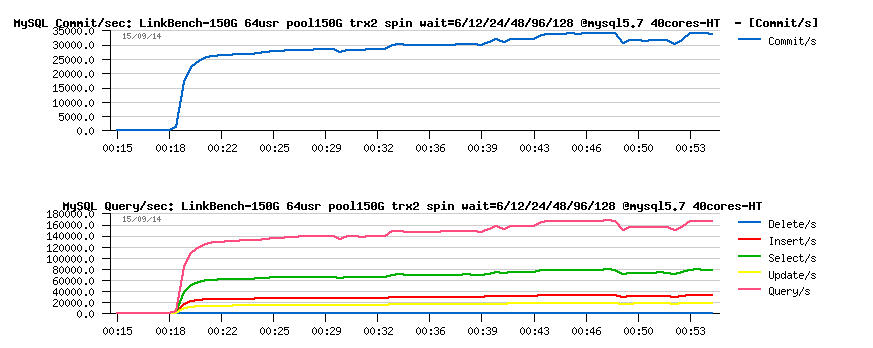
Observations :
- the best TPS level is reached with spin delay=48 : 35K TPS instead of the initial 30K ;-)
- on 96 TPS is less or more the same as with 48, but on 192 performance is going down..
And it's well seen on the graph with contentions :
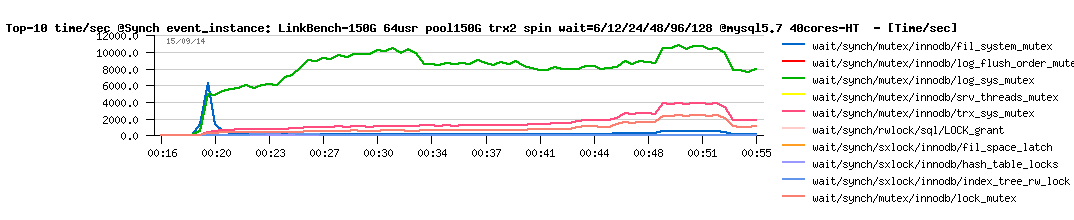
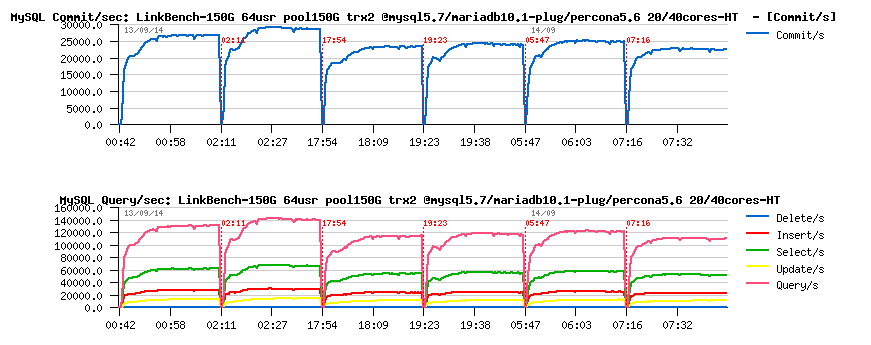
Now, let's replay the same test on the same 40cores-HT config, but with applied innodb_spin_wait_delay=48 on all engines and adding one more for REDO log flushing:
- the first test for each engine with innodb_flush_log_at_trx_commit=2 (trx2 : REDO fsync once per second)
- and the second one with innodb_flush_log_at_trx_commit=1 (trx1 : REDO fsync on every transaction)
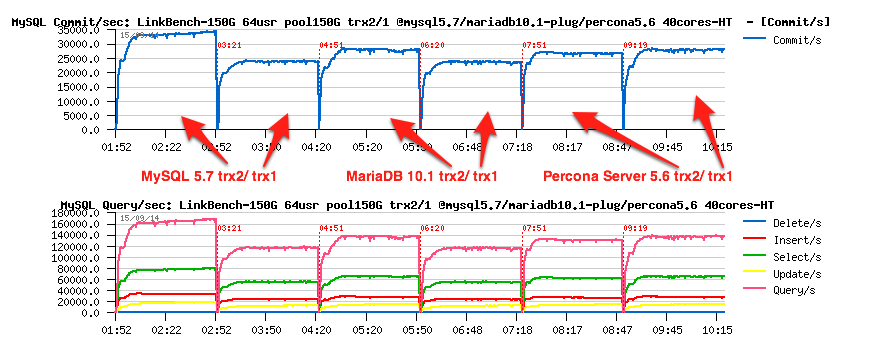
Observations :
- there are several surprises here..
- MySQL 5.7 : 35K TPS on trx2, but only 24.5K TPS on trx1..
- MariaDB 10.1 : 28K TPS on trx2, and 24.5K TPS on trx1..
- Percona 5.6 : only 27K TPS on trx2, but 28K TPS on trx1! ;-))
- well, if on MariaDB the gap between trx2 and trx1 results is as expected (redo writes fsync() on every transaction with trx1 cannot be free)..
- while on MySQL 5.7 it looks rather as regression (should be fixed)
- and on Percona Server there is rather a regression on trx2 ;-)
Then, to understand why all this happens you have just to look on the corresponding mutex contentions graph reported by PFS:
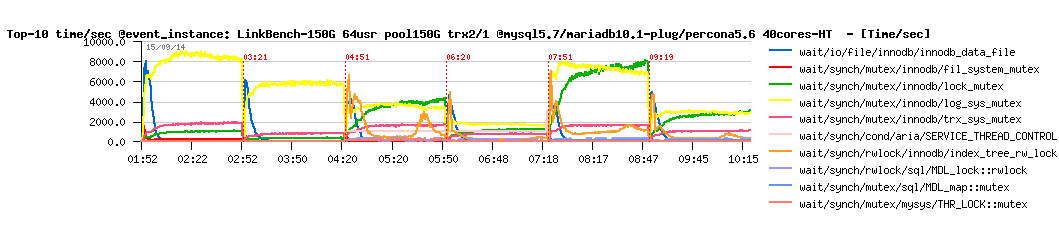
However, the most surprising for me here the drop on MySQL 5.7 from 35K TPS to 24.5K TPS just because we switched from innodb_flush_log_at_trx_commit=2 to innodb_flush_log_at_trx_commit=1.. - I'd not expect such a big regression just because of REDO fsync, specially when we're using an extremely fast flash storage.. And indeed, the story will likely change for 5.7 very quickly -- the following graph representing the result on exactly the same workload, but on the next-step-dev 5.7 version (after DMR5), get a look on this:
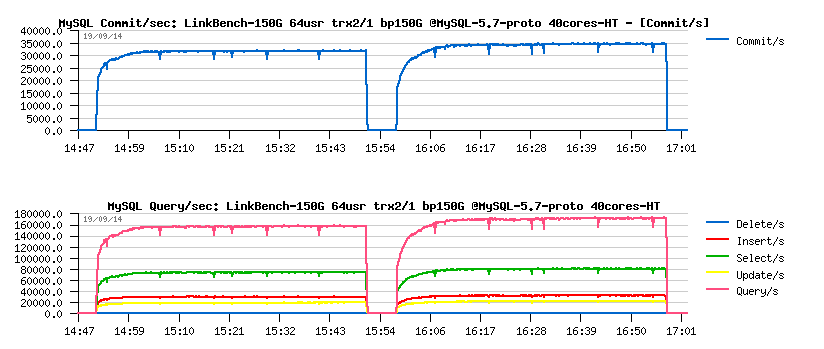
While the result with innodb_flush_log_at_trx_commit=2 is slightly lower than 35K TPS (need some more tuning/testing to find an optimal internals setting), but with innodb_flush_log_at_trx_commit=1 the result is even little bit bigger than 35K TPS!!!
All this means that in MySQL 5.7 we may be potentially not too far from having near the same level of performance for innodb_flush_log_at_trx_commit=1 setting as for innodb_flush_log_at_trx_commit=2 whenever it's possible.. - stay tuned! ;-)
Ok, now what will happen if the Buffer Pool size will be reduced to 75GB ? (instead of 150GB)...
The same test but with BP size=75G :
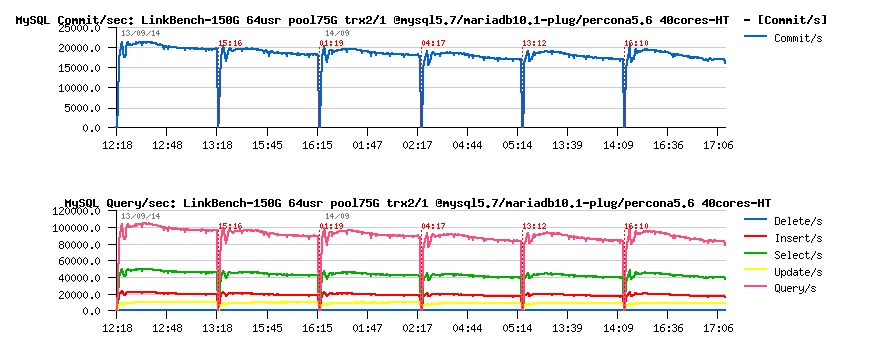
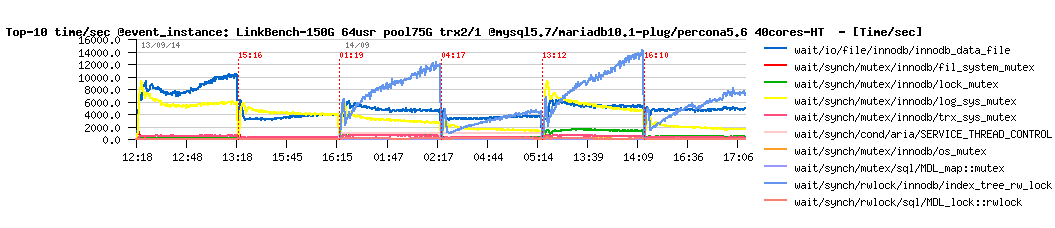
Observations :
- there is not too much difference anymore between trx2 and trx1 on all engines..
- a huge wait time part now is attributed to the IO reads..
- all engines are starting from the less or more the same TPS level on the beginning (except MySQL 5.7 which is starting from a higher TPS)
- but then over a time starting to decrease...
- MySQL 5.7 is loosing less than any others, and remains the best from all engines (and if one day I'll have a patience to run such a test for 24h I'll do to see the end of the graph ;-))
Any difference to expect if only 20cores will be user for database server?
The same test, but on 20cores-HT :
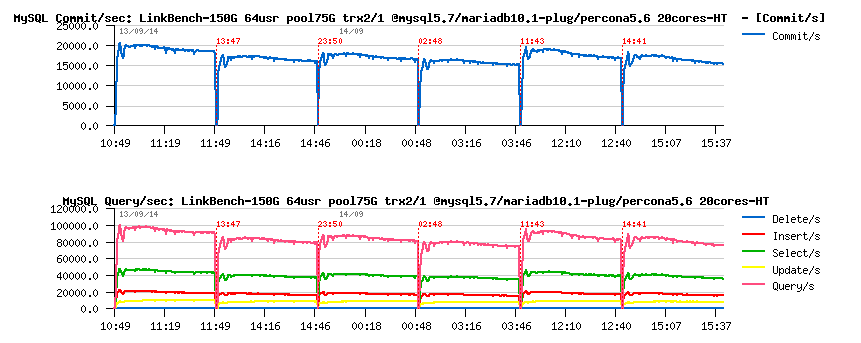
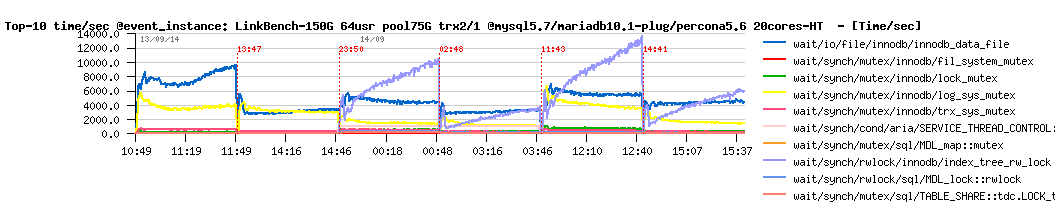
On 20cores-HT the overall result just little bit slower, but very similar to 40cores-HT..
And contentions levels are looking very similar as well, including growing over a time the index lock waits on MariaDB and Percona Server:
Instead of SUMMARY :
- indeed, the plugin InnoDB in MariaDB 10.1 seems to run better than their default XtraDB..
- however, it looks like there is just something wrong with XtraDB integration in MariaDB, because Percona Server itself is showing the same or a better result than MariaDB running with its own InnoDB plugin..
- as well I did not see any single point where MariaDB could be better on base-to-base conditions comparing to MySQL 5.7
- further investigation will come later once I'll have in my server the Fusion-io flash card supporting atomic IO and all the latest NVMFS stuff..
- more code changes in MySQL 5.7 are in pipe to better analyze these strange scalability issues and more higher and bigger database workloads.. - note: we're yet far here from reaching even a half of potential performance of this flash storage, so there is definitively a lot of things to improve ;-)
So, stay tuned ;-)
Additional NOTES : (as you're asking)
>> HOWTO monitor Commit/sec in MySQL ?
- you're getting on a regular interval (say every 10sec.) the value of the "Com_commit", for ex. :
- mysql> show global status like 'Com_commit';
- then do a subtraction from the current value the previous one, and divide it by your timeout interval (say 10sec)
- that's all ;-)
>> HOWTO monitor mutex time waits in MySQL ?
- you're starting MySQL server with PFS enabled and wait events instrumentation ON:
- performance_schema=ON
- performance_schema_instrument='%synch%=on'
- then on a regular time interval executing the following SQL query, and getting a diff from the current values vs the previous ones and divide them by your time interval
- SQL query:
mysql> select EVENT_NAME, max(SUM_TIMER_WAIT)/1000000000000 as WaitTM
        from events_waits_summary_by_instance group by 1 order by 2 desc limit 25;
+-------------------------------------------+----------+
| EVENT_NAME                                | WaitTM   |
+-------------------------------------------+----------+
| wait/io/file/innodb/innodb_data_file      | 791.3204 |
| wait/synch/mutex/innodb/fil_system_mutex  |  25.8183 |
| wait/synch/rwlock/innodb/btr_search_latch |   5.2865 |
| wait/io/file/innodb/innodb_log_file       |   4.6977 |
| wait/synch/rwlock/sql/LOCK_grant          |   4.4940 |
......
+-------------------------------------------+----------+
25 rows in set (0.06 sec)
As well you can use MySQL Enterprise Monitor (MEM) or use my tools from my site (dim_STAT @ http://dimitrik.free.fr) to get all this and other stuff ready for action..