« October 2012 | Main | July 2012 »
Saturday, 29 September, 2012
MySQL Performance: Welcome 5.6 RC, the best MySQL ever
Today we're announcing MySQL 5.6 RC availability, which is placing MySQL
5.6 to the "best ever MySQL" position, kept until now by MySQL 5.5 ;-))
In
one word: "Champagne !!!" :-)
While few graphs with
benchmark results will say you it better than any words...
Sysbench
OLTP_RO

Sysbench RO Simple-Ranges

Sysbench OLTP_RW

More details about during my presentation @MySQL Connect at 17:30 today..
Then my presentation slides will be posted here: MySQL Perf @Connect 2012
NOTE: the results are presented in QPS (query per second, counting only
Read + Write requests/sec reported by Sysbench), and representing the
most higher QPS results obtained on each MySQL version for each test
case with a best tunning possible in each case, and on the same Linux
32cores server...
Wednesday, 26 September, 2012
MySQL Performance: Speaking during MySQL Connect 2012

Seems I did not say it before, but I'm presenting "Demystified MySQL/InnoDB Performance Tuning" during MySQL Connect, this Saturday, 5.30 pm, Room Golden Gate 4.. And looking on my slides, I'm realizing that it'll be hard to tell within one hour all the stuff I want :-))
So, if you want me absolutely to cover some particular topic during presentation, please, leave a comment here or just drop me an e-mail, I'll then keep it in mind and not miss it for sure ;-)
MySQL Performance is a so passionating topic that it's quite easy to forget about time while speaking about.. And I'm very happy to see so many sessions about performance.. Seems it'll be hard for me too to manage my time optimally and attend all the presentations and speakers I want.. - but I very hope so :-)
Looking very promising so long awaited conference..
See you there! ;-)
Tuesday, 25 September, 2012
MySQL Performance: Collecting stats from your workload
Pretty often I was asked by many people about solutions I'm using while analyzing MySQL performance issues and generating various graphs presented in my reports and blog posts.. - Well, I've always used and continue to use dim_STAT - the tool I'm developing myself since 15 years now, and which is freely available on this site :-) The tool is mainly collecting any kind of stats from the system and applications, and then giving you a way to analyze them live or later via web interface - nothing new now days, but well, I have my habits, like to play with collected data and want to know exactly what I'm analyzing ;-)) (while many of you are using other tools, including a really excellent MySQL Enterprise Monitor, and it's all ok for me too - as in my mind changes are coming only since people become unhappy with what they have, or hitting some limitations, etc.) -- personally, I'm pretty happy, and wish you the same ;-))
But I have a small problem -- I'm very curious by problematic workloads (and already started a call for workload scenarios this year, and many thanks to all who answered) -- but now I'm also very interested by workload stats, specially if you're trying MySQL 5.6 and hitting some unexpected performance issues on your system ;-)
- provide a connect info for your MySQL instance (user/password/host:port)
- check some system libs are not missed on your system to run my binaries (and install few missed if any)
- collect stats with 10sec interval during your workload
- send me the result
- be sure your database is running ;-)
- be sure MySQL access via IP is not protected by your firewall
- be sure MySQL is listening on the IP port you've configured
- be sure user/password pair is correct..
- goto 1. and debug ;-)
- innodb_monitor_enable = '%'
- performance_schema=ON
-
performance_schema_instrument='%=on'
-
and once MySQL is started, execute the following SQL statements to
enable mutexes and I/O instrumentation only (if you don't need any
other):
- use performance_schema;
- update setup_consumers set enabled = 'no';
- update setup_consumers set enabled = 'yes' where name like '%instr%';
- update setup_instruments set enabled = 'no', timed = 'no';
- update setup_instruments set enabled = 'yes', timed = 'yes' where name like '%wait/synch%';
- update setup_instruments set enabled = 'yes', timed = 'yes' where name like '%wait/io/file%';
Tuesday, 04 September, 2012
MySQL Performance: Table Open Cache in 5.6
Over this summer I've observed several very curious MySQL performance
issues, but time was short to blog about (and vacation period is not
motivating to it either ;-))
But here is a one of them I'd like
to share.
The following graphs are representing a MySQL test case
running on 12cores Linux box from the same workload: simple Sysbench
OLTP_RO benchmark with a growing number of concurrent users (150, 200,
250, 300, 350): 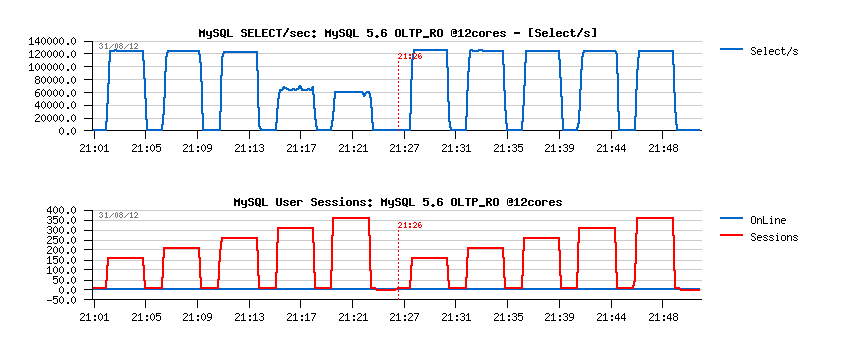
the
only difference here that in the fist case (the left part of the graph)
MySQL performance is dropping down since 300 concurrent users, while in
the second case it's fixed and remaining stable as expected (well, in
reality the issue came up since 1024 concurrent users, but I've forced
the config params to bring it earlier and to simplify explanation ;-)
Once
again, MySQL Performance Schema (PFS) is helping here to fire the
hottest contention in this workload: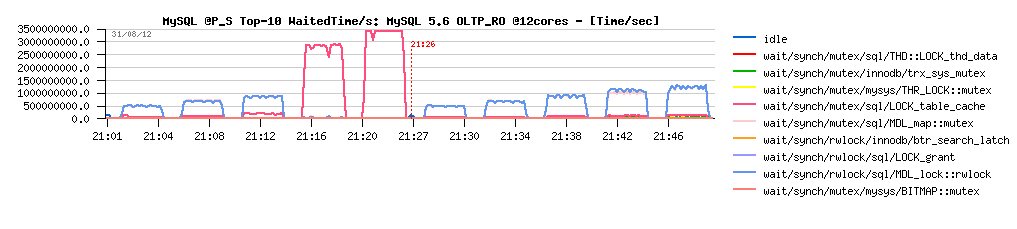
In
the "broken" case the top contention is firing on the LOCK_table_cache
mutex!..
Why?..
The exact answer is coming from the new
status variables introduced since MySQL 5.6.6 as a part of solution
fixing the old and so painful for many years LOCK_open mutex
contention: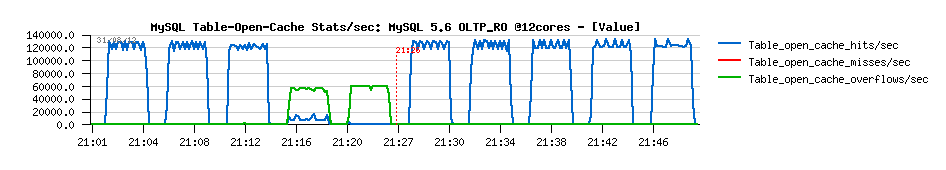
there
are now table_open_cache related status counters reporting the levels of
cache hits/misses and overflows (see: http://dev.mysql.com/doc/refman/5.6/en/server-status-variables.html#statvar_Table_open_cache_hits).
And as you can see from the graphs, in the "broken" case the hits were
out-passed by overflows, which is clearly indicating that the table_open_cache
variable was simply not set high enough!..
But which value is
"high enough" ?.. - it depends :-) depends on your workload and your
System/OS/HW capacities (and of course on the MySQL version you're using
;-)) -- currently to obtain the presented graphs I've set it to 100 -
sure, pretty small, but it was still enough to keep the load correctly
up to 250 concurrent users anyway ;-) While the current default value in
MySQL 5.6 is 400, and in the real test case it was still good enough to
keep up to 1024 users! - but was not enough for more.. However,
personally, from a long date I'm setting "table_open_cache" to several
thousands during my tests, and that's why I've never observed this issue
before :-)
But well, since MySQL 5.6 you have now a good
indicator from status variables (or I_S) to see if your setting is good
enough or not. While some may still say me that it was always a good
practice to set "table_open_cache" to something big enough, and I may
only agree (as I'm always doing the same myself too).. - but let me now
to present you another issue ;-))
Same workload scenario,
Sysbench OLTP_RO, table_open_cache is set to 8000, but now I'm running
the test on 32cores server: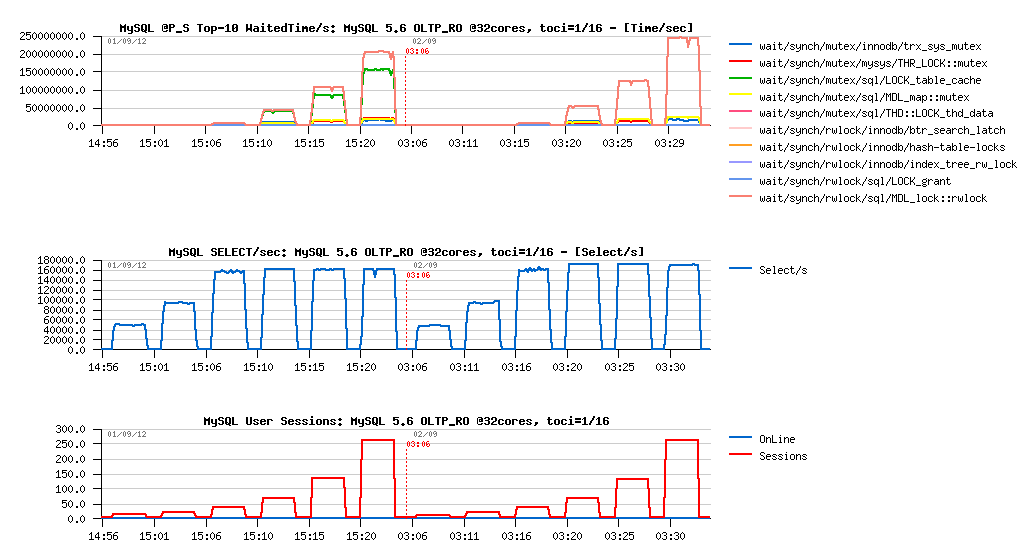
Observations
:
- on the left side the LOCK_table_cache mutex wait time is on the second position after MDL_lock::rwlock
- there is no more issues with cache hits, and table_open_cache=8000 setting is more than enough..
- in this case the LOCK_table_cache mutex becomes really much more hot due a much higher concurrency involved on 32cores (vs what is possible on 12cores)
- so, this contention can be fixed now by using a bigger table_open_cache_instances value (default is 1) -- setting it to 16 is completely removing the LOCK_table_cache mutex wait events (as you can see on the right side) and giving at once 10% performance improvement! ;-)
- the table_open_cache_instances setting was introduced since MySQL 5.6.6 (http://dev.mysql.com/doc/refman/5.6/en/server-system-variables.html#sysvar_table_open_cache_instances)
On the same time in the presented test case this mutex contention was not the top one, but only on the second position. So, of course, the gain may be even bigger when LOCK_table_cache mutex time arrives to the #1 in your workload ;-)
For example, over 15-20% gain on the following POINT-SELECT test workload:
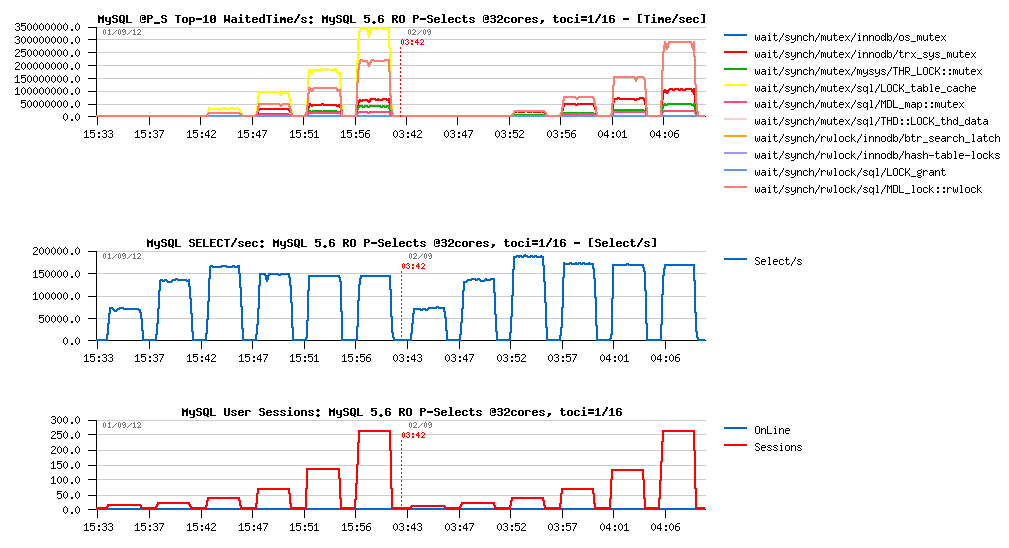
Observations :
- LOCK_table_cache mutex contention is #1 here (left side)
- and completely disappearing (right side) once I've set table_open_cache_instances=16 and bringing 15-20% performance gain!
Looks to me like we should adjust little bit the default settings within MySQL 5.6 to get all these features out-if-the-box. While I want also to note that PFS instrumentation is working better and better now! - during presented workloads I've used mutex instrumentation only within PFS, which lowered my base performance level by near 10%.. - however, keeping in mind that the instrumentation code path of the most hot mutexes was executed here over several tens of millions times per second(!) - 10% regression is looking in this case pretty acceptable for the amount of information PFS is providing for my analysis ;-)
Well, would be great now to remove contention on the MDL_lock::rwlock.. - but it's an another story ;-)
Rgds,
-Dimitri