Tuesday, 15 May, 2018
MySQL Performence : 8.0 GA and TPCC Workloads
Generally TPC-C benchmark workload is considered as one of the #1 references for Database OLTP Performance. On the same time, for MySQL users it's often not something which is seen as "the most compelling" for performance evaluations.. -- well, when you're still fighting to scale with your own very simple queries, any good result on something more complex may only look as "fake" ;-)) So, since a long time Sysbench workloads remained (and will remain) as the main #1 "entry ticket" for MySQL evaluation -- the most simple to install, to use, and to point on some sensible issues (if any). Specially that since new Sysbench version 1.0 a lot of improvements were made in Sysbench code itself, it really scales now, has the lowest ever overhead, and also allowing you to add your own test scenario via extended LUA scripts (and again, with lowest ever overhead) -- so, anyone can easily add whatever kind of different test scenarios and share with others ! (while I'd say "the most compelling test workload" for any given user should be the workload which is the most closely reproducing his production load -- and you can probably do it now with new Sysbench, just try it !).
However, from MySQL Dev side, every given benchmark workload is mostly seen asa yet one (or several ones) problem(s) to resolve. Some of problems are common for many workloads, some are completely different ones, but generally it's never about "something cool" -- and we're just progressing in this long road by fixing one problem after another (to hit yet another one again). So, TPC-C workload for MySQL is just yet another problem to resolve ;-))
Historically the most popular TPC-C implementations for MySQL were :
- DBT-2 : an open source version of TPC-C
- TPCC-mysql : another open source version of TPC-C developed by Percona
Both versions were implemented completely differently, but at least both were very "compelling" to MySQL users, as they can run TPC-C workload via SQL queries (and not via stored procedures, which are more popular for other DB vendors).. So, it was up to anyone preferences which of 2 test cases to use (while personally I'd say it was always more simple to install and use TPCC-mysql). However, since new Sysbench is here and Percona now ported their TPCC-mysql to Sysbench -- for me it's no doubt everyone should move to Sysbench-TPCC if interested on TPC-C testing ! (and kudos Percona to make this happen !! ;-))
So, what is good with new Sysbench-TPCC :
- first of all it's fully integrated with Sysbench, so if you already got Sysbench installed on your server, TPCC workload will just work, as well all your old sysbench scripts around to collect the test results and so on ;-))
- it also goes more far than original TPC-C test -- it's allowing you to run several TPC-C data sets in parallel (I was doing the same in the past by running several TPCC-mysql or DBT-2 processes on the same time -- which is allowing you to see "what is the next problem") -- but now you have the same out-of-the-box!
From the past testings I've already observed that the most "representative" data set size for TPCC workload is around 1000W (1K "warehouses") -- it's not too small, nor too big to take a long time to generate the data + allocate too much disk space (generally it's using around 100GB in InnoDB once loaded).. -- probably over a time I will also test a x10 times bigger volume (or more), but for the moment the 1000W volume is already big enough to investigate MySQL scalability limits on this workload..
So far, my test scenario will be the following :
- data set :
- 1000W (single dataset as in original TPC-C workload)
- 10x100W (10 datasets of 100W executed in parallel)
- concurrent users : 1, 2, 4, .. 1024
- InnoDB Buffer Pool (BP) :
- 128GB : data set is fully cached in BP (no I/O reads)
- 32GB : not more than 1/3 of data set can be cached in BP (I/O reads and yet more writes to expect)
- HW and my.conf are used the same as in the previous article about 8.0 OLTP_RW performance.
- and as well I'm curious how well MySQL 8.0 is scaling on this workload when 1CPU socket (1S) is used comparing to 2CPU sockets (2S)
Sysbench-TPCC 1000W
here is the result with MySQL 8.0 :
Comments :
- the above graph is representing the test executed on 1S (left side) and then on 2S (right side)
- the load is starting with 1 user session, then progressively increased to 2 users, 4, 8, .. 1024
- as you can see, there is no much difference between 1S and 2S results..
We're scaling on this workload only up to 32 concurrent users, so having more CPU cores could not bring any help here.. And what is the bottleneck ? -- we're hardly hitting index RW-lock contention here :
with such a hot contention the difference between MySQL 8.0 and older versions could not be big ;-))
Sysbench-TPCC 1000W, BP=128GB
Comments :
- interesting that MySQL 8.0 is still winning here anyway !
- and even on low load 8.0 is mostly matching TPS of 5.6, which is also very positive
- (and we may expect even better TPS once the index lock contention is lowered, but this is probably not a simple fix)..
- no idea why MariaDB is even not matching TPS level of 5.7 (while using InnoDB 5.7)
Sysbench-TPCC 1000W, BP=32GB
Comments :
- the same 1000W workload, but with BP=32GB, so more IO-bound activity is expected..
- however, TPS results between BP=128GB and BP=32GB configs are not that much different, right ?
- this is just because TPCC workload itself is not that much IO-intensive as many could imagine ;-))
- (well, yes, it'll still involve a lot of I/O writes and reads, but they will be often grouped around the same data, so already cached pages could be re-used)
- (this is completely opposite to, for ex., Sysbench OLTP_RW workload which with a similar amount of data and configured with BP=32GB will become extremely aggressive on I/O and get TPS decreased by several times)
- again, no idea about MariaDB..
From the other side, I don't recall to hit the same index lock contention while testing 1000W dataset with DBT-2, so I was very curious to compare it with Sysbench-TPCC 1000W on 2S and with BP=128GB :
DBT-2 1000W -vs- Sysbench-TPCC 1000W (2S, BP=128GB)
Comments :
- so far, DBT2 workload is on the left side, and Sysbench-TPCC is on the right
- as you can see, peak TPS level reached on DBT2 is nearly twice higher than on Sysbench-TPCC
- why ? -- this is a good question ;-))
- initially I supposed this is due more indexes used in Sysbench-TPCC schema, but removing them did not help..
- in fact, everything is looking similar, but there is still something which is making Sysbench-TPCC to have a different processing "signature" which is resulting in this intensive index lock contention..
- would be great if Percona eng. could find what is making this difference, and then making from this an additional test scenario ! -- after what we could definitively forget about DBT2 and use Sysbench-TPCC exclusively ;-))
So far, let's get a look how the things are changing when 10x100W dataset is used :
Sysbench-TPCC 10x100W
here is the result with MySQL 8.0 :
Comments :
- as in the previous case, the result on 1S is on the left, and 2S on the right side of the graph
- and you can see here that peak TPS on 2S is more than 50% higher !
- (but not yet near x2 ;-))
- as well peak TPS on 1S higher than 1000W result on 1S
This is because by using 10 datasets in parallel we multiplied the number of all tables by 10, which is dividing the initially observed "index lock" contention by 10 too (!) for the same number of concurrent users -- and moving the internal bottleneck to another place, and now it's hitting lock management part (lock_sys mutex contention) :
Comments :
- as you can see, the index lock contention is still present, but it's divided by 10 now
- and the presence of lock_sys contention is blocking us from going more far..
- work in progress, and I'm impatient to see this bottleneck gone ;-))
Ok, and now -- how MySQL 8.0 compares to other versions ?
Sysbench-TPCC 10x100W, BP=128GB
Comments :
- MySQL 8.0 is still showing the best TPS result on this workload as well !
- TPS is lower -vs- 5.7 on 512 and 1024 users load due higher lock_sys contention in 8.0
- (by fixing REDO locking in 8.0 we also made other locks more hot, and this is as expected)
- NOTE : I could "hide" this TPS decrease by limiting thread concurrency, but I did not do it here intentionally to see all the other locks impact..
- and yes, index lock itself makes a huge trouble when present -- as we see here x2 times better TPS -vs- 1000W
- note as well, that MySQL 8.0 is matching 5.6 TPS on low load (which, sadly, was no more the case for 5.7)
- no idea about MariaDB..
and now the same with 32GB BP :
Sysbench-TPCC 10x100W, BP=32GB
Comments :
- MySQL 8.0 is still do better than others here too !
- I'm a bit surprised to see 5.6 to do slightly better on low load (but hope it'll be improved in 8.0 soon)
- again, TPS is not that much different comparing to BP=128GB config, so the workload is not that much IO-bound as anyone could expect.. -- definitively not something to use as a test case if your target is Storage Performance evaluation..
And I was ready to finish my post here, while Percona published their benchmark results comparing InnoDB -vs- MyRocks on Sysbench-TPCC 10x100W workload ! -- I was happy to see that MyRocks is progressing and doing well, but my main attention was attracted by InnoDB results.. -- as you can see from all the results I've presented above, there is not too much difference when we're going from 128GB BP config to 32GB BP config.. While from Percona results we're seeing exactly opposite.. -- not far from x3 times lower TPS between 128GB and 32GB BP configs ! -- how ever such is possible then ?..
Unfortunately the article is not trying to explain what is going behind, but just showing you the numbers.. -- so, let's try to investigate this a little bit ;-))
First of all, in Percona tests was used 2S 28cores-HT server, so I'll limit my HW setup to 1S and use 24cores-HT only (for sure, it's not the same CPU chips, but at least the number of really concurrent tasks executed in parallel will be similar)..
Then, comparing the configuration settings, the most notable differences are :
- checksums = ON
- doublewrite = ON
- binlog = ON
- adaptive hash index = ON (AHI)
- and lower values for : io capacity / io max / lru depth / BP instances / cleaner threads / etc..
From the follow-up Percona results you can see that this TPS drop between 128GB and 32GB BP is NOT related to binlog, so I have at least one option less to investigate ;-))
So, first of all I wanted to re-check the "base line" results with BP=128GB.
The following graph is representing MySQL 8.0 under Sysbench-TPCC 10x100W workload with different config settings -- I'll try to be short and present all the test cases together rather one by one, so you can see all the 4 tests here :
Comments :
- the test #1 is executed with my config as presented in all the results above
- the test #2 is the same as #1, but doublewrite=ON and AHI=ON, and you can see a significant TPS drop..
- however, this TPS drop is exactly because of AHI ! -- and as I've mentioned to PeterZ during his "InnoDB Tutorial" @PerconaLIVE -- as soon as you have data changes in your workload, in the current implementation AHI becomes the bottleneck by itself.. -- so, the only one AHI option you should retain in your mind in this case -- is to switch AHI=OFF ! ;-))
- so, the test #3 is the same as #2, but with AHI=OFF -- and as you can see, we got our lost TPS back ! ;-))
- and another observation you may make here is that "doublewrite=ON" is not impacting TPS result at all in the current workload.. -- even it's still not fixed yet in MySQL 8.0
- (Sunny, please, push the new doublewrite code asap to show people a real power of MySQL 8.0 !)
- and the test #4 is with : doublewrite=ON, AHI=OFF, checksums=ON (crc32), io capacity=2K, io capacity max=4K, etc. -- mostly the same as Percona config, and you can see TPS on the same level again ;-))
- NOTE : while using so low IO capacities settings is not resulting here in TPS drops, it's lowering the resistance of MySQL Server instance to activity bursts -- Checkpoint Age is hitting its max limit, and sync flushing waits are already present during the test (aka "furious flushing").. -- so, I'd not suggest it as the right tuning.
- I don't test the impact of checksums here as it'll be simply not present in this workload (all data are in BP, checksums will be involved only on page writes which is going in background, so zero impact on overall processing)..
Now, let's see the same workload, but with BP=32GB :
Comments :
- the first test is, again, with my initial config settings, and TPS is not too much lower than with BP=128GB..
- the test #2 is as test #1, but with doublewrite=ON and AHI=ON, and indeed, not far from x2 TPS drop..
- let's switch AHI=OFF now as in the previous case..
- the test #3 is as test #2, but with AHI=OFF, and as expected, we can see increased TPS here ;-))
- now, what is the impact of checksums ?
- the test #4 is the same as #3, but with checksums=ON (crc32) -- mostly zero impact on TPS
- and the test #5 is mostly reusing Percona config, except with AHI=off -- which is slightly lowering TPS..
So far :
- the biggest impact here is coming from doublewrite=ON
- and the impact is NOT because we're writing the data twice.. -- but because there is a lock contention in doblewrite code ! -- historically doblewrite was implemented as a small write zone, and as soon as you have many writes going in parallel -- you have a locking fight..
- the new doublewrite code was implemented by Sunny without any of these limitation, and as soon as your storage is able to follow (e.g. to write twice the same data) -- your TPS will remain the same ! ;-))
- e.g. in my case I should obtain the same over 10K TPS as you can see in the test #1
- but Percona is claiming to have it fixed, so that's why this x3 TPS drop in their results between 128GB and 32GB BP configs is surprising me.. -- is it the AHI so much impacting in their tests ?.. -- no idea
- then, why doublewrite is more impacting in 32GB BP config comparing to 128GB BP ?
- with 32GB BP we are doing much more I/O :
- first of all, only 1/3 of data may remain cached in BP, so we'll often Read from storage
- but before to be able to Read, we need to find first a free page in BP to re-use
- and if most of pages in BP are "dirty" with changes, we need to Write these changes first before to declare a given page as "free" and ready to re-use
- which is resulting in much more Writes -vs- 128GB BP config (where you don't have any Reads at all)
- other point : you should also keep in mind to look on TPS results as on "one whole"
- e.g. if you'll look on 32 users load, you'll see 7.5K TPS, but if you'll look on 128 users only -- you'll see 5K TPS (or even less, depending on config ;-))
- and if you're looking for reaching a max possible TPS, your main load level is then around a peak TPS
- once the peak TPS is reached, your main worry then is only about how to not loose it with higher load..
- there are many solutions available around (and the most optimal IMHO is with ProxySQL pool) -- and you have as well the old good one -- "thread concurrency" tuning ;-))
So, let's add the test #6 which is the same as test #4 (doublewrite=ON, AHI=OFF, checksums=ON) but with innodb_thread_concurrency=32 :
Comments :
- as you can see, even on higher load TPS is "improved" now as well ;-))
- (I'd rather say it's "solved" from contention, as we're not improving here anything, just limiting the concurrency)
- one day we will have no more TPS drops on high load at all (even with thread concurrency=0), but this day is not yet today (nor tomorrow ;-))
Ok, we're able to "hide" the doublewrite contention, fine ! -- but could we reduce the overall Writes impact here ? (with reduced Writes we'll much less stress doublewrite buffer, means its lock contention will be lower, and probably overall TPS will be higher then ?.. -- And YES, in this workload it's possible ! ;-))
How ?.. -- remind that this TPCC, e.g. pure OLTP workload, and, as I've mentioned before -- the data access is "grouped" (so, some data are re-used from BP cache before to Read another ones). And these workload conditions are perfectly matching the story I've explained in 1M IO-bound QPS article with MySQL 8.0 -- let's try the same test #6, but with InnoDB configured with page size = 4KB, which will be the test #7 on the next graph :
Comments :
- as you can see, with 4KB page size the TPS level is even higher than in test #1 !! ;-))
- (note : we're still having doublewrite=ON and checksums=ON)
- and with the new doublewrite code it should be just the same in all test results here (just mind to switch AHI=OFF ;-))
- also, as you can see, even with x4 times less RAM for BP (32GB -vs- 128GB) and doublewrite=ON and checksums=ON we're still NOT x3 times worse on TPS, but rather near the same result as with 128GB BP !!
INSTEAD OF SUMMARY
- Sysbench-TPCC itself still has some surprises (comparing 1000W case with DBT2)
- MySQL 8.0 is doing better than any other/older version here !
- (but we're yet far from a good scalability -- work in progress, stay tuned ;-))
- believe me, you're not yet finished to be surprised by InnoDB ;-))
- Sunny, please, push to 8.0 the new doublewrite code ASAP !! ;-))
Thank you for using MySQL ! -- stay tuned ;-))
Rgds,
-Dimitri
Monday, 14 May, 2018
MySQL Performance : 1M *IO-bound* QPS with 8.0 GA on Intel Optane SSD !
Historically, Random I/O Reads were always a major PITA for any OLTP workload.. If Random I/O Writes you could yet "delay" via controller's caches (or any kind of other battery-protected caches -- specially if Writes are coming in bursts), there is no way to "predict" I/O Reads if they are fully Random (so you cannot "cache" or "prefetch" them ahead and have to deliver the data directly from storage, read by read.. -- which is hitting a huge "rotation penalty" on HDD).
Indeed, things changed dramatically since arriving of Flash Storage. You don't need to spend any particular attention if your I/O Reads are Random or Sequential. However, you still need to keep in mind to not hit the overall throughout limit of your Flash Device. As the result, reading by smaller I/O blocks allowing you to do more I/O operations/sec than with bigger blocks.
And what about InnoDB ? -- InnoDB is using by default 16KB page size (so by default all Random I/O Reads are of 16KB) :

And with 16KB Random Reads you definitively will reach your throughput limit sooner than with 8KB or 4KB Reads. Many users are seeing "compression" as the best matching solution here. And, indeed, if you're very lucky and can compress your data, say, by x4 times => you'll Read then only 4KB from storage to deliver 16KB of data. And, yes, you'll be able to deliver x4 times more Reads/sec :

The only problem is that you'll still deliver 16KB of data which you need first to copy to Buffer Pool (BP) to be able then to process the query, and your BP is not unlimited ! ;-)) -- so, in reality, you're able to read data x4 times faster from your storage, but still not able to process them faster due BP size limit :

However, if your rows are well grouped within 16KB page -- you may still win on doing less I/O Reads, but not get any overall QPS performance gain comparing to "non compressed" default case)..
On the same time you have another solution to radically improve your QPS and get a bigger profit of your Flash Device -- you may just use 4KB page size for your whole InnoDB instance, which will allow you within the same I/O throughput level to Read x4 times more and process x4 times more having the same BP size :

Unfortunately, such an approach was possible to use with InnoDB only "partially" until now, because historically every I/O operation in InnoDB was going via a global lock (fil_system mutex) quickly limiting your overall I/O rate. The good news is that since MySQL 8.0 this limitation is finally gone and our I/O scalability moved to the next level ! ;-))
But this all may still remain just a good "theory" if there was no any "practical" result to confirm the claim, right ? -- so, to confirm the gain I'll use IO-bound Sysbench Point-Select workload :
- test case : Sysbench 1.x uniform point-selects
- volume : 50M x 8 tables (400M rows in total, ~100GB)
- BP size : 32GB
NOTE : while there is still a possibility that some data will be re-used from BP, this test scenario is generally saturating any flash device much faster then you can imagine.. -- so, the whole processing here is really IO-bound and IO-driven.
And I'd say the timing was very favorable here to allow us to test it on the latest Intel Optane SSD drive ! -- this device by itself seems to bring the next level of standard to the whole Flash Storage Story ;-)) Here are few "pure IO" test results I've obtained from a single Optane device on my validation tests :
Intel Optane SSD drive :
- singe thread pure Random I/O Reads with 16KB : 65.000 reads/sec (!!), 1000 MB/sec
- avg latency : 0.01ms (!!)
- max throughput : 2000-2500 MB/sec
So, on a pure I/O test on this drive a single thread is already delivering 65K Random Reads/sec of 16KB ! -- but also reaching 1000 MB/sec throughput, means with 2 or 3 threads we're already reaching the max IO rate on this device. However, there is a big difference between "pure IO" test and database "IO-bound workload" -- there is still a lot of processing around every SQL request (not only I/O)..
But "in theory" by using x2 Optane drives together there should be possible to reach :
- with 16KB page size : 260K Random Reads/sec
- with 8KB page : over 500K/sec
- with 4KB page : probably 1M Reads/sec
and as usual, the real answer you obtain only by a real test ;-))
so far :
Sysbench 50Mx8tab IO-bound point-selects
Comments :
- yes, MySQL 8.0 is showing a real difference here by reaching over 1M IO-bound QPS !!!
- NOTE : the max QPS on MySQL 5.6 and 5.7 is reached with 8KB page size here (become worse on 4KB page due present in these versions fil_system lock contention)..
The results are obtained on the same Skylake server with the same config settings as described before. The only difference is that 50M rows were loaded per table and BP size was reduced to 32GB.
Thank you for using MySQL ! -- stay tuned ;-))
Rgds,
-Dimitri
Wednesday, 09 May, 2018
MySQL Performance : 8.0 RW & Binlog impact
In the
previous article I've intentionally skipped the topic related to
Binlog impact on MySQL 8.0 Performance because it's not a short story,
nor a simple one..
In fact, for most of people Binlog in MySQL is
generally representing an additional overhead, and historically it was
true. Since MySQL 5.6 there is Binlog Group Commit (BGC) feature
available, and it was rather doing well, decreasing
the gap between "binlog=OFF" and "binlog=ON sync_bin=1". However,
storage vendors are making flash drives more and more faster (and
cheaper) from year to year.. And when we delivered MySQL 5.7 the scope
of Binlog impact moved with code and flash storage improvements -- the
main impact was no more coming from the I/O operations related to
Binlog, but from the Binlog code itself ! -- indeed, this may sound odd
initially, but let's go to "pictures" to see it better in details ;-))
So
far, I'll reuse the same Skylake server as before, but will reduce it to
1S (1CPU Socket, 24cores-HT) -- so, you don't believe it's all because
I'm using a "big HW" (while 2S HW is the most common server config today
in all data centers where people are running MySQL, and having
16-24cores per CPU Socket is what is todays "commodity HW") -- but well,
let's stay with 24cores-HT for the following experiment ;-)) And as the
storage it'll be the same Optane drive with EXT4 filesystem.
I'll
now replay the same Sysbench OLTP_RW and Update-NoKEY tests as before,
but using only 1S (24cores-HT) and with the same previous my.conf but
with 4 additional variations :
- 1) binlog=OFF
- 2) binlog=ON sync_bin=0
- 3) binlog=ON sync_bin=1000
- 4) binlog=ON sync_bin=1
Sysbench OLTP_RW 10Mx8-tables @MySQL-5.7
Comments :
- as you can see, on a higher load enabling Binlog is helping a higher TPS !
- (well, in fact it's helping not to gain, but rather not to loose TPS on high load)
- but in any case, you're seeing here a positive impact ! ;-))
- and you can understand that in such a case it was difficult to blame Binlog code along MySQL 5.7 time ;-))
Specially that even more important "positive impact" happens on much more aggressive writes with Update-NoKey workload :
Sysbench Update-NoKey 10Mx8-tables @MySQL-5.7
Comments :
- as you can see, enabling Binlog is helping a lot MySQL 5.7 to not loose performance on high load..
- and this is all because it helps to "hide" the REDO log contention we have in 5.7
And it helped well, until we did not improve the whole REDO log code in MySQL 8.0 ;-)) -- since then the same story is looking completely different now :
Sysbench OLTP_RW 10Mx8-tables @MySQL-8.0
Comments :
- only negative impact from Binlog in MySQL 8.0
- and 20K TPS instead of 25K TPS is a pretty huge difference..
Sysbench Update-NoKey 10Mx8-tables @MySQL-8.0
Comments :
- but since the Writes are more aggressive in your workload, the impact then is even more dramatic..
- more that x2 times TPS drop..
In case you're still suspecting the above is only valid for Skylake & Optane, here are the similar results from 1S Broadwell 22cores-HT and other vendor flash drive :
MySQL 5.7 :
MySQL 8.0 :

This is the reason why Binlog stuff in MySQL 8.0 must be fixed asap, and I really hope it'll happen soon ! -- seems like the whole story around Binlog must be re-visited and re-implemented..
BTW, if you have a patch, you're more than welcome ! ;-))
Rgds,
-Dimitri
Tuesday, 08 May, 2018
MySQL Performance : 8.0 and Sysbench OLTP_RW / Update-NoKEY
This post is following previously published OLTP_RO results for MySQL 8.0 (latin1 and utf8mb4 charsets), and now is focusing on Sysbench RW workloads, particularly "mixed" OLTP_RW and Update-NoKey :
- OLTP_RW : while this workload has writes, it's mainly driven by reads (OLTP_RO + 2 updates + delete + insert)
- Update-NoKey : aggressively bombarding UPDATE queries (but with no changes on indexed columns)
Server configuration :
-
OS : Oracle Linux 7.4
- CPU : 48cores-HT Intel Skylake 2.7Ghz (2CPU sockets (2S), Intel(R) Xeon(R) Platinum 8168 CPU)
- RAM: 172GB
- Storage : x2 Intel Optane flash drives (Intel (R) Optane (TM) SSD P4800X Series)
- volume : RAID-0 via MDADM
- filesystem : EXT4
However, as running the test with all these config variations is taking a significant time, I've slightly reduced the scope of investigation to the following :
- trx_commit = 1 : along with our work on InnoDB REDO re-design we not only fixed the biggest related bottleneck, but also discovered and partially fixed several other issues around REDO (also mostly historical, but still) -- keeping all this in mind, I'd rather suggest you today to use "1" (flushing REDO log on COMMIT) whenever possible -- specially that with all the progress we're seeing on HW/Storage improvement last years -- the penalty of "1" with 8.0 becomes much less dramatic than before -vs- "2" (flush REDO log once per second), and also a big enough total size for the whole REDO space (currently I'm using x16 or x32 log files of 1GB each), more about later..
- PFS = off : I'm intentionally now switching Performance Schema OFF just because it's not a bottleneck, but a pure "overhead" (as many other things as well) -- my main target in all benchmark investigations is "to see what is our next bottleneck", and as HW resources are always limited, any additional overhead will help to "hide" the real problem.. While PFS overhead is part of MySQL QA testing, and every overhead higher than 5% for "default instrumentation" is considered as a bug (mind to file a bug if you see it bigger in your case!) -- while from the other side many users are asking to see more an more instrumentation enabled by default regardless overhead (and this "balance" between overhead and benefit from built-in instrumentation is generally can be observed only case by case).
- Checksums = off : this is also a pure "overhead" and not a bottleneck, while since CRC32 is supported, generally you'll not hit any problem..
- Charset = latin1 : while most of interest is moving to UTF8, I'm continuing to test with "latin1" for the same reasons as UTF8 -vs- latin1 "overhead" which may hide you more important problems (while using UTF8 in 8.0 is giving you a direct gain -vs- any previous MySQL release, but I'm rather looking to point on problems than hide them)..
- DoubleWrite = off : this, however, is a big problem and a big bottleneck, but the fix was already developed by Sunny since 2 years now, we worked on this together, and I can confirm you you'll not see any TPS drop as soon as your storage is able to follow (as you "writing twice", e.g. x2 times more) -- but the code is still NOT part of 8.0 because "there is always something more important to do" ;-)) -- please feel free to urge Sunny to push re-designed DoubleWrite code to 8.0 asap !! (Sunny's twitter : @sunbains) -- while for my part I need to see "what is after" once the new code is delivered..
- Binlog = off : this is another big problem, and on the same time both bottleneck and overhead.. -- but this one rather need a very particular attention, so I'll skip it here to say you more later..
The full list of all config options you may always find at the end of the article, while here are the final results :
Sysbench OLTP_RW 10Mx8-tables TPS
Comments :
- over 45K TPS with MySQL 8.0 !
- around 35K TPS with MySQL 5.7 -- interesting that similar result was obtained in the past with 5.7 on 4S 72cores-HT Broadwell server, and now 2S Skylake 48cores-HT is just enough to get the same ;-))
- NOTE : and we're still far from the max possible TPS to get from this HW ! => work in progress..

Sysbench Update-NoKey TPS
Comments :
- near 250K TPS with MySQL 8.0 !
- and indeed, there was a huge performance drop in 5.7 comparing to 5.6
- extremely happy to see this fixed finally with 8.0 ;-))
- (and no idea what to advice to MariaDB who just adopted InnoDB from 5.7)...
Then, for those who are curious about "overheads", the same test results but only for MySQL 8.0 with turned PFS=on and checksums=crc32 :
OLTP_RW :
Update-NoKey :
As you can see, the difference is really small and remains under 5% (in case you expected to see something more big here ;-))
However :
- even the results with MySQL 8.0 are looking better, we're yet far from scaling on Writes !
- work is still in progress..
the full list of configuration options I've used :
[mysqld]

# general
 max_connections=4000
 table_open_cache=8000
 table_open_cache_instances=16
 max_prepared_stmt_count=512000
 back_log=1500
 default_password_lifetime=0
 default_authentication_plugin=mysql_native_password
 character_set_server=latin1
 collation_server=latin1_swedish_ci
 skip-character-set-client-handshake
 ssl=0
 performance_schema=OFF
 skip_log_bin=1
 transaction_isolation=REPEATABLE-READ

# files
 innodb_file_per_table
 innodb_log_file_size=1024M
 innodb_log_files_in_group=32
 innodb_open_files=4000

# buffers
 innodb_buffer_pool_size=128000M
 innodb_buffer_pool_instances=16
 innodb_log_buffer_size=64M

# tune
 innodb_doublewrite=0
 innodb_thread_concurrency=0
 innodb_flush_log_at_trx_commit=1
 innodb_max_dirty_pages_pct=90
 innodb_max_dirty_pages_pct_lwm=10

 join_buffer_size=32K
 sort_buffer_size=32K
 innodb_use_native_aio=1
 innodb_stats_persistent=1
 innodb_spin_wait_delay=6

 innodb_max_purge_lag_delay=300000
 innodb_max_purge_lag=0
 innodb_flush_method=O_DIRECT
 innodb_checksum_algorithm=none
 innodb_io_capacity=10000
 innodb_io_capacity_max=40000
 innodb_lru_scan_depth=9000
 innodb_change_buffering=none
 innodb_read_only=0
 innodb_page_cleaners=16
 innodb_undo_log_truncate=off

# perf special
 innodb_adaptive_flushing=1
 innodb_flush_neighbors=0
 innodb_read_io_threads=16
 innodb_write_io_threads=16
 innodb_purge_threads=4
 innodb_adaptive_hash_index=0

# monitoring
 innodb_monitor_enable='%'
And if you wish to reproduce the same tests, you can find the MySQL 8.0 starter note here, and test related instructions from here and then here.
Thank you for using MySQL !
Rgds,
-Dimitri
Thursday, 26 April, 2018
MySQL Performance : 8.0 and UTF8 impact
The world is moving to UTF8, MySQL 8.0 has utf8mb4 charset as default
now, but, to be honest, I was pretty surprised how sensible the
"charset" related topic could be.. -- in fact you may easily hit huge
performance overhead just by using an "odd" config settings around your
client/server charset and collation. While to avoid any potential
charset mismatch between client and server, MySQL has from a long time
an excellent option : "skip-character-set-client-handshake" which is
forcing any client connection to be "aligned" with server settings !
(for more details see the ref. manual : https://dev.mysql.com/doc/refman/8.0/en/server-options.html#option_mysqld_character-set-client-handshake)
-- this option is NOT set by default (to leave you a freedom in choose
of charsets used on client and server sides). However, in my sense, it's
still better to align clients according to the server settings to avoid
any potential client misconfig..
As well if you wish to use UTF8,
please use "utf8mb4" as first of all it's the most complete for any kind
of characters (and probably the only one which makes sense as of today),
and second -- the related code was yet more improved in MySQL 8.0 for
better efficiency. How much more efficient ? -- let's see from the
following test results.
but first of all, the related config
setup :
  [mysqld]
   ...
   character_set_server=utf8mb4
   collation_server=utf8mb4_0900_ai_ci
   skip-character-set-client-handshake
   sort_buffer_size=512K
NOTE: mind to use a bigger sort buffer for UTF8
The results are obtained with on the same 2S Skylake as in the previously published RO tests with MySQL 8.0 and latin1 and with the same test workloads (just that for latin1 you need to change character_set_server=latin1 and collation_server=latin1_swedish_ci)
So far, here we are :
Sysbench OLTP_RO 10Mx8-tables UTF8mb4 on 2S 48cores-HT Skylake
Comments :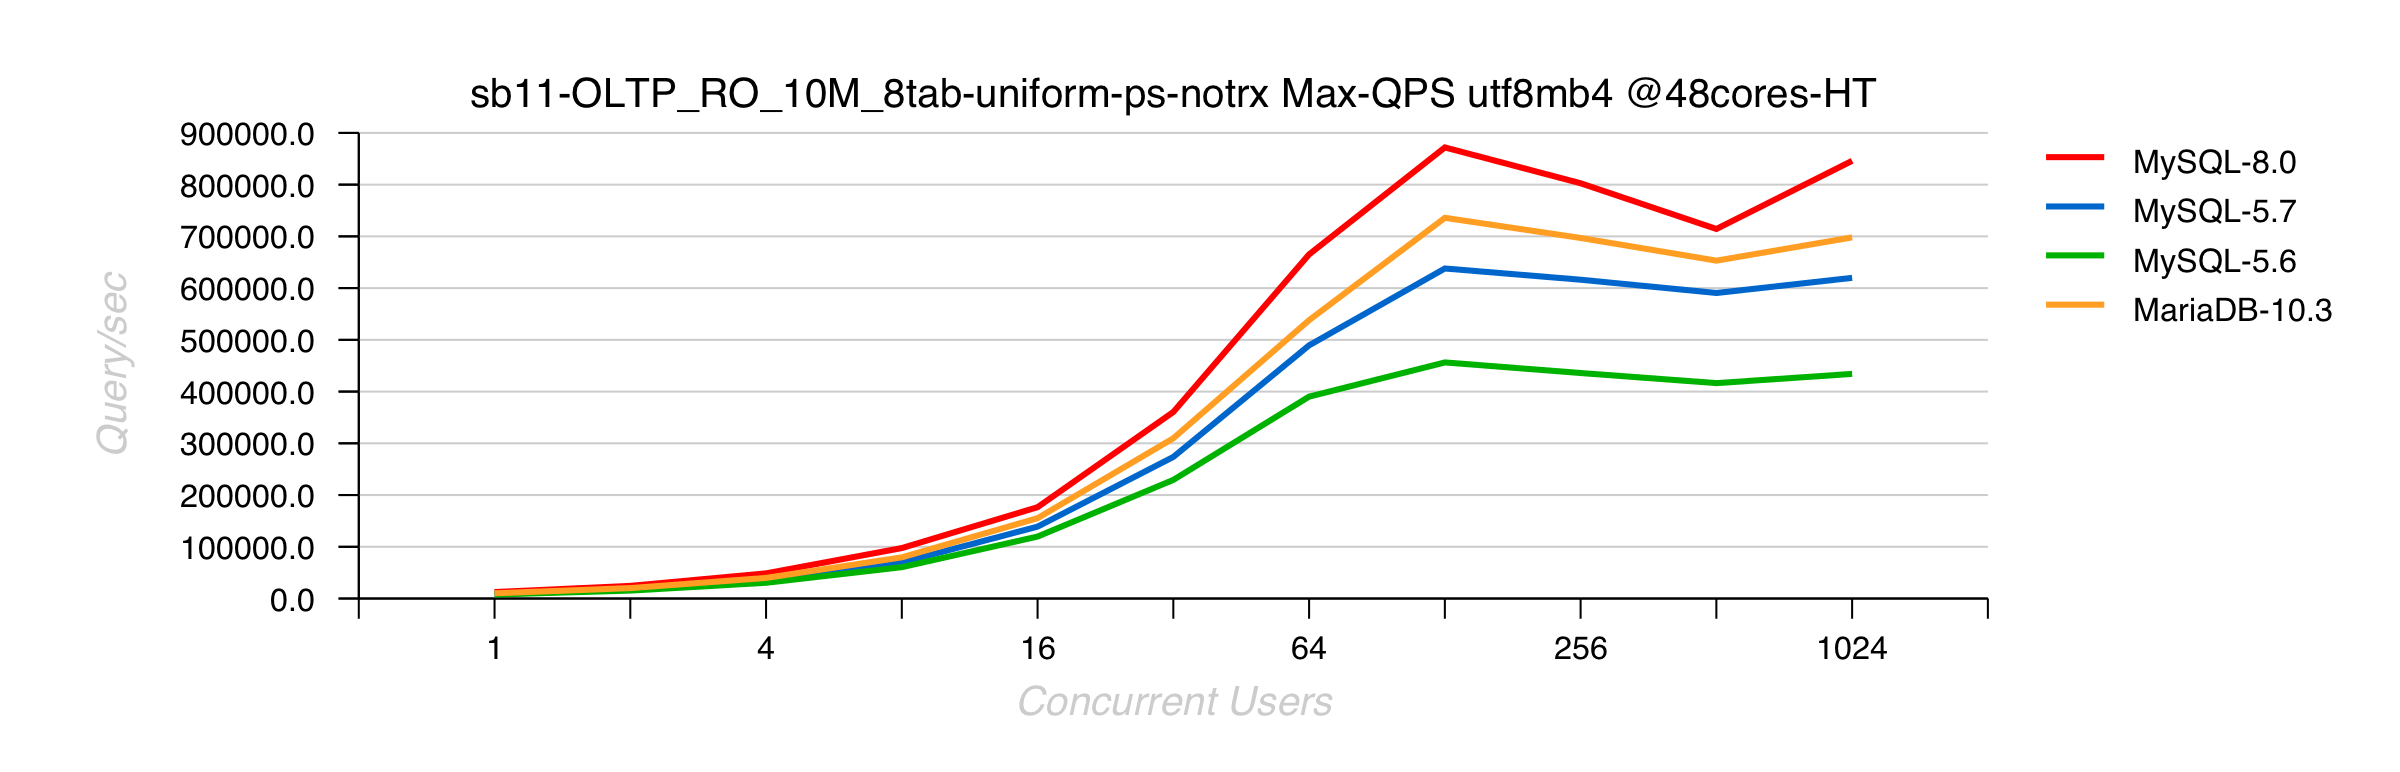
- MySQL 8.0 is doing up to 40% better than 5.7
- MariaDB 10.3.5 is trying to follow, but not yet there..
Sysbench RO Point-Selects 10Mx8-tables UTF8mb4 on 2S 48cores-HT Skylake
Comments :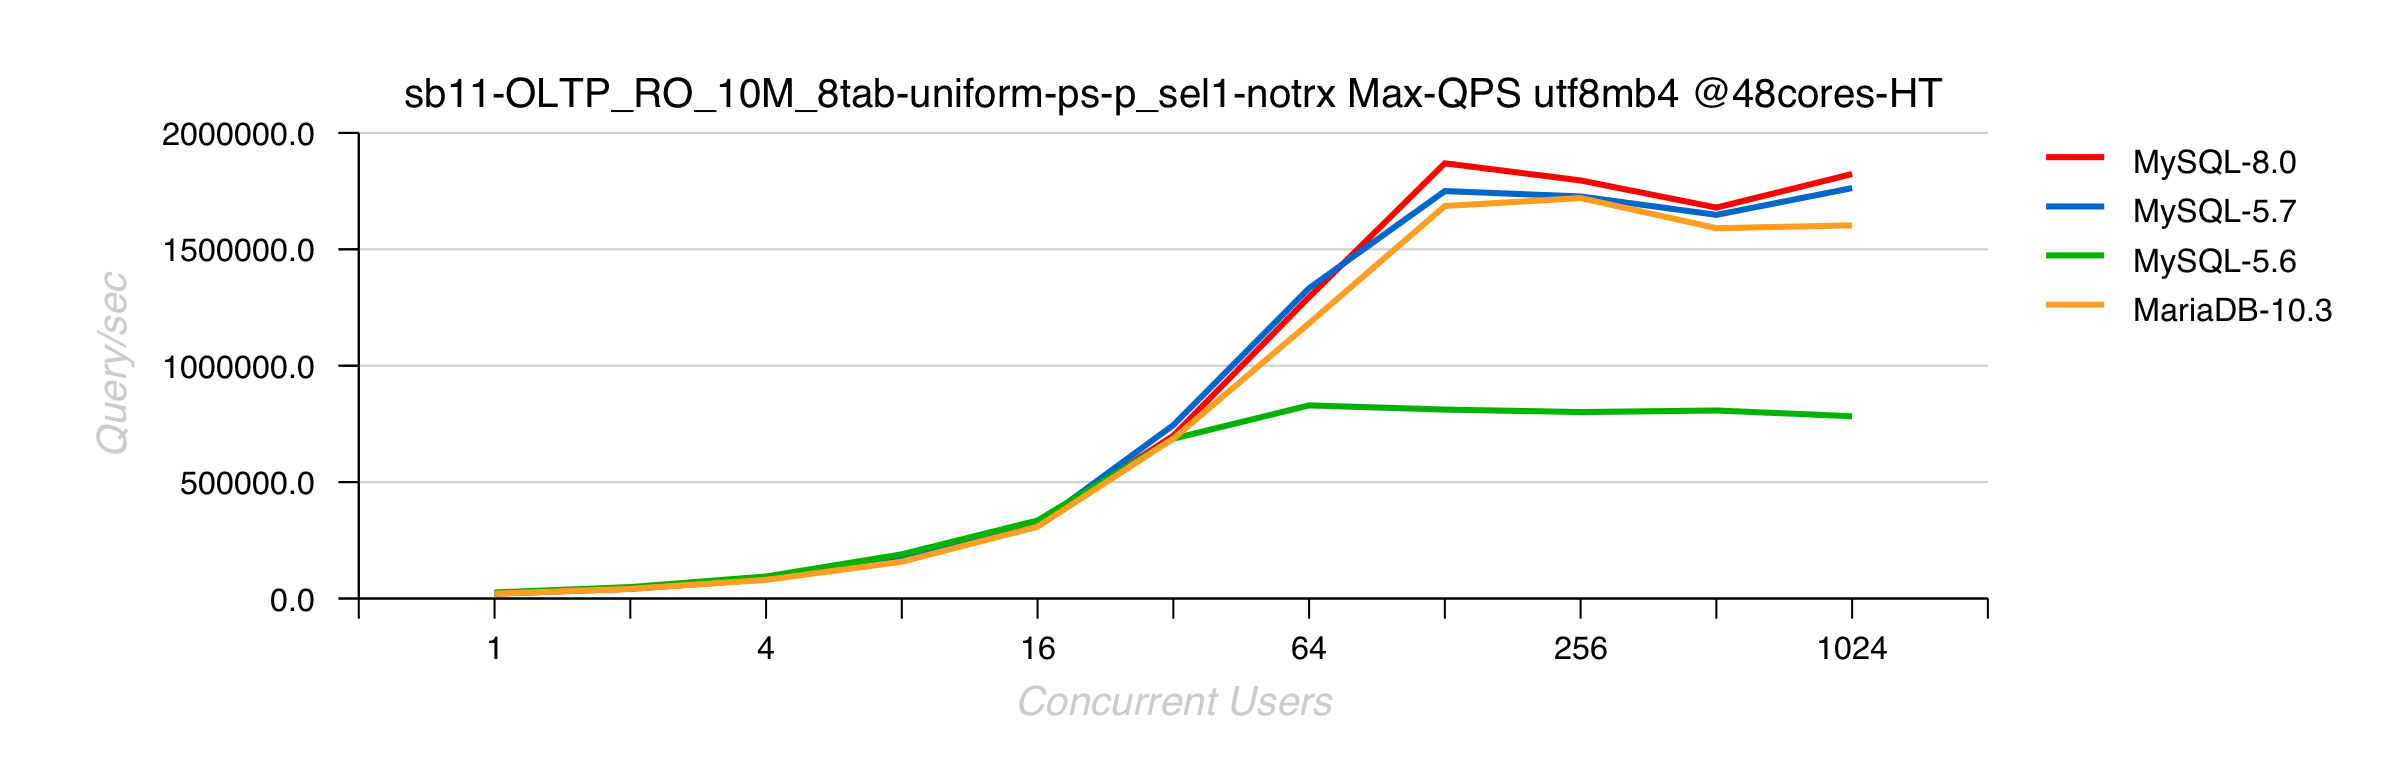
- point-selects workload is much less sensible to UTF8
- 8.0 and 5.7 are getting highest QPS due RO fixes in 5.7
- MariaDB 10.3.5 is going higher than before since adoption of InnoDB 5.7 code
- 5.6 is slower than others because it's 5.6, and has no 5.7 improvements ;-))
Sysbench RO Distinct-Ranges 10Mx8-tables UTF8mb4 on 2S 48cores-HT Skylake
Comments :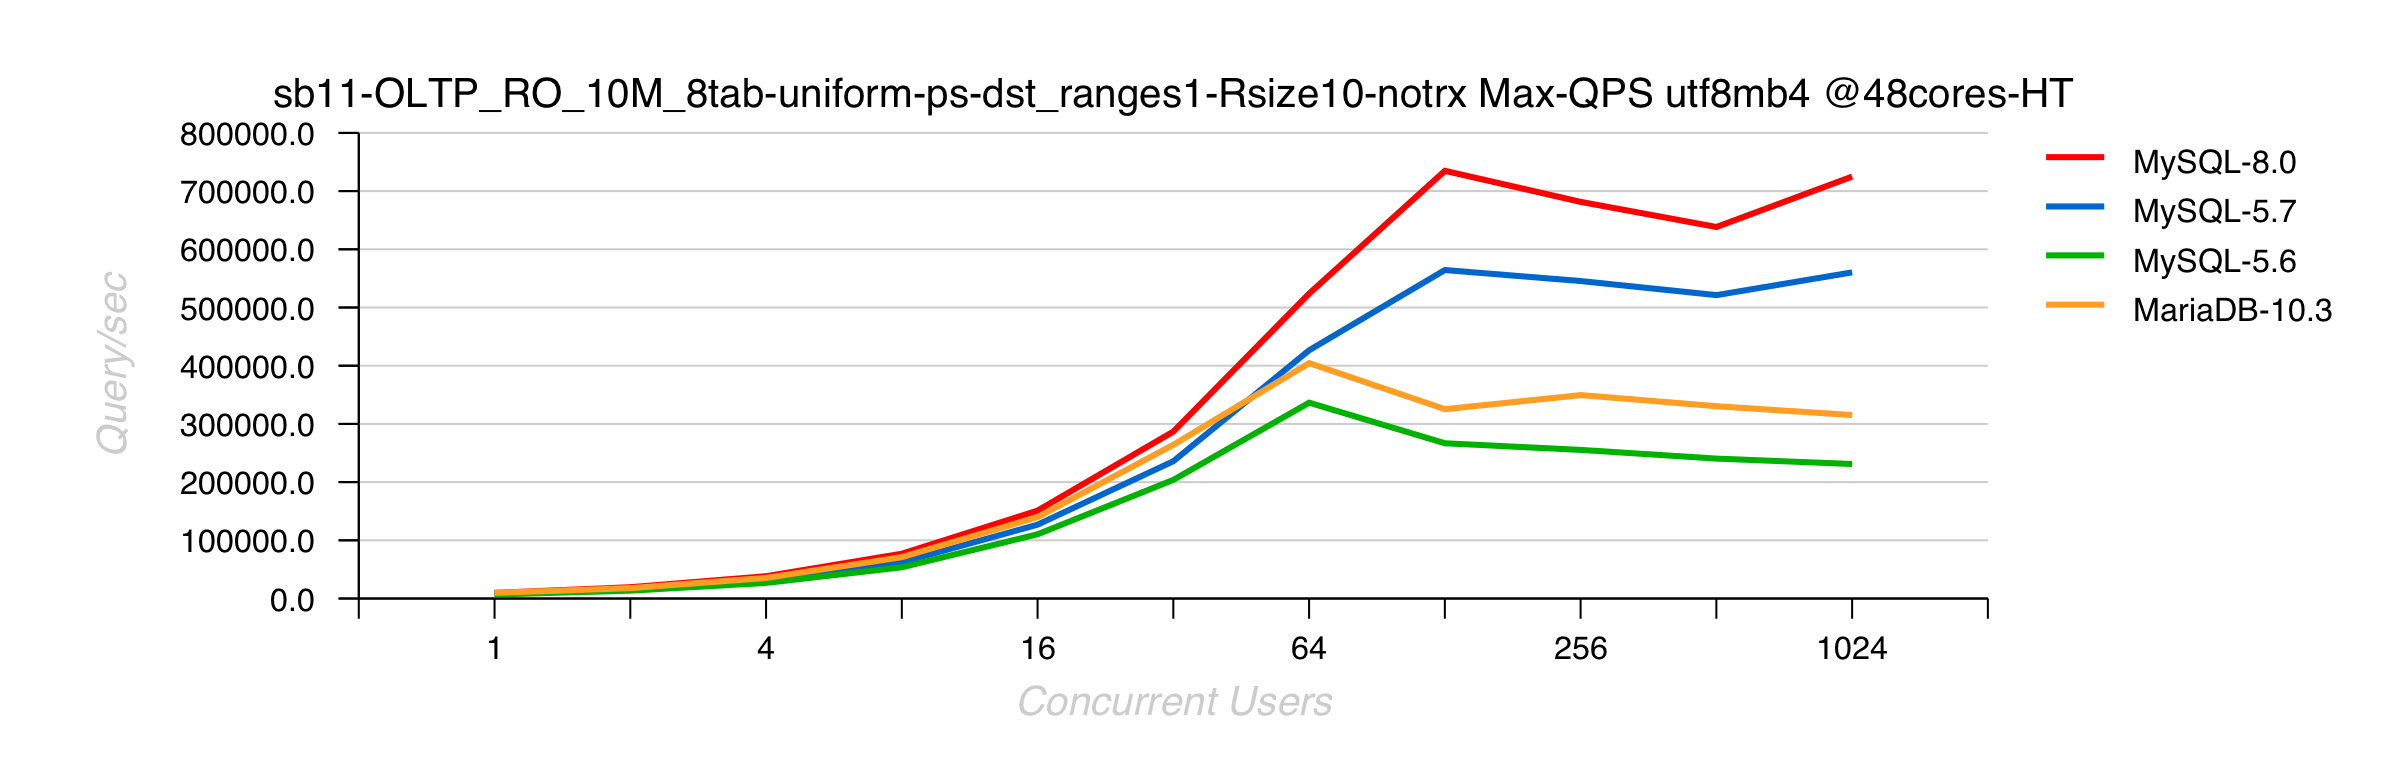
- MySQL 8.0 is doing 30% better than 5.7
- MariaDB is doing so bad here just because it's already doing something bad yet in previous latin1 tests..
Instead of Summary :
- a gentle reminder to PeterZ that MySQL is not "InnoDB only" ;-))
- if you're doing "benchmarKeting" -- very easy to be "the best" by comparing everyone with UTF8, and hide all other regressions and bottlenecks.. ;-))
- so, hope it's obvious why all my following benchmark results will be published with "latin1" only..
Thank You for using MySQL !
Rgds,
-Dimitri
Tuesday, 24 April, 2018
MySQL Performance : over 1.8M QPS with 8.0 GA on 2S Skylake !
Last year we already published our over 2.1M
QPS
record with MySQL 8.0 -- it was not yet GA on that moment and the
result was obtained on the server with 4CPU Sockets (4S) Intel Broadwell
v4. We did not plan any improvement in 8.0 for RO related workloads, and
the main target of this test was to ensure there is NO regressions in
the results (yet) comparing to MySQL 5.7 (where the main RO improvements
were delivered). While for MySQL 8.0 we mostly focused our efforts on
lagging WRITE performance in MySQL/InnoDB, and our "target HW" was 2CPU
Sockets servers (2S) -- which is probably the most widely used HW
configuration for todays MySQL Server deployments..
However, not
only SW, but also HW is progressing quickly these days ! -- and one of
my biggest surprises last time was about Intel Skylake CPU ;-)) -- the
following graph is reflecting the difference between similar 2S servers,
where one is having the "old" 44cores-HT Broadwell v4, and another the
"new" 48cores-HT Skylake CPUs :

the difference is really impressive, specially when you see that just on 32 users load (when CPU is not at all saturated not on 44cores nor 48cores) there is already 50% gain with Skylake ! (and this is about a pure "response time"), and on peak QPS level it's over 1.8M QPS (not far from 80% gain over Brodawell)..
And this results is marking our next milestone in MySQL RO performance on 2S HW ! ;-))
Sysbench RO Point-Selects 10Mx8-tables latin1 on 2S 48cores-HT Skylake

As already mentioned, the main gain is coming from MySQL 5.7 changes, and we're probably just little bit lucky here to see MySQL 8.0 slightly better than 5.7 ;-)) (while as you can see from the chart, it was also a good reason for MariaDB to move to InnoDB 5.7 to match similar gains comparing to InnoDB 5.6)..
So, it's as expected, to not see any difference on mixed OLTP_RO :
Sysbench OLTP_RO 10Mx8-tables latin1 on 2S 48cores-HT Skylake

and what is amazing here is that we're reaching on 2S Skylake now the 1M QPS result that we obtained in the past with MySQL 5.7 on the same 4S Broadwell v4 box (which was not yet upgraded to 96cores on that time).. And it makes me smile now to recall all the discussions with our users mentioning "they will never use anything bigger than 2S server" -- and here we're ! -- its exactly 2S, 48cores "only" box, but pointing on ALL the problems we already investigated on bigger HW and fixed them ON TIME ! ;-)) -- well, there is still a lot of work ahead, so let's hope we'll be "always on time", let's see..
The most "sensible" RO workload for me was always "distinct ranges" in Sysbench, as it's pointing on issues which anyone can have with "group by" or "distinct" queries.. -- which is involving temp memory tables code, and this code was completely rewritten in 8.0 "from scratch" to be finally more simple, "maintainable" and more scalable. But this is not always meaning "as efficient as before" (the most efficient it could be probably if it was re-written on assembler, but again -- who will want to maintain it again ? ;-))
Sysbench RO Distinct-Ranges 10Mx8-tables latin1 on 2S 48cores-HT Skylake

so far, MySQL 8.0 is doing mostly the same as 5.7 here, and it's really good keeping in mind the impact of the changes.. (while further improvements may still be done, as well many old "broken" cases are solved now, etc.)
(but have nothing to say about MariaDB 10.3.5 here)
well, this was about "latin1" RO results, stay tuned, there is more to come ;-))
And Thank You for using MySQL !
P.S. an "attentive reader" may ask himself -- if over 1.8M QPS are reached on 2S Skylake, what QPS level then will be matched on 4S Skylake ??? -- and I'd say you : we don't care ;-)) we know the result will be higher, but we're NOT running after numbers, and there are other more important problems waiting on us to be resolved, rather to show you "yet more good numbers" ;-))
Rgds,
-Dimitri
MySQL Performance : Testing 8.0 with less blood..
This is just a short reminder about what to keep in mind when you're preparing some MySQL 8.0 performance testing (or any other 8.0 evaluation) and want to do it "with less blood" ;-))
So far, here is the list :
- 8.0 is using UTF8 by default, so if you're expecting to compare apples-to-apples, configure it with "latin1" as it was before to compare to 5.7/5.6/etc. (or configure them all to UTF8 if your target is to compare UTF8)..
- binlog is enabled by default, so mind to switch it OFF if it's not in your target..
- SSL is ON by default (switch it OFF if not your target)
- auto UNDO truncate is ON by default (if you prefer to avoid any periodic spikes in background of flushing activity due UNDO auto truncate, just switch this features OFF (while you'll still be able to involve the same truncate manually whenever you need it))
- there is a new default authentication plugin (and if you want to see your old apps still working with 8.0, just initialize your MySQL instance + use in your config file the old plugin instead (NOTE: you may still switch plugins via ALTER))
- InnoDB doublewrite fix is still NOT part of the published code, so unless your target is to really show how this missed fix is impacting your workload, switch it OFF (but still mind to bombard Sunny with complaining messages about how this fix is important for you ;-))
MySQL 8.0 Server initialization :
to add to your my.conf file before you start your MySQL instance :$ ./bin/mysqld --user=mysql --datadir=./data --initialize-insecure \ --default-authentication-plugin=mysql_native_password
[mysqld]
 ...
 ssl=0
 default_authentication_plugin=mysql_native_password
 skip_log_bin=1
 character_set_server=latin1
 collation_server=latin1_swedish_ci
 skip-character-set-client-handshake
 innodb_undo_log_truncate=off
 innodb_doublewrite=0
Rgds,
-Dimitri
Monday, 23 October, 2017
MySQL Performance: 8.0 re-designed REDO log & ReadWrite Workloads Scalability
This post is following the story of MySQL 8.0 Performance & Scalability started with article about 2.1M QPS obtained on Read-Only workloads. The current story will cover now our progress in Read-Write workloads..
Historically our Read-Only scalability was a big pain, as Read-Only (RO)
workloads were often slower than Read-Write (sounds very odd: "add
Writes to your Reads to go faster", but this was our reality ;-)) -- and
things were largely improved here since MySQL 5.7 where we broke 1M QPS
barrier and reached 1.6M
QPS for the first time. However, improving Writes or mixed
Read+Writes (RW) workloads is a much more complex story..
What
are the main scalability show-stoppers in MySQL 5.7 and current 8.0
release candidate for RW and IO-bound workloads? - the most "killing"
are the following ones :
- REDO log contentions are blocking your whole transaction processing from going faster..
- Transaction (TRX) management becomes very quickly a huge bottleneck as soon as your transactions are fast and/or short..
- internal locking and row locking (LOCK) will quickly kill your performance as soon as your data access pattern is not uniform, etc..
- and yet more, historically as soon as you're involving any IO operations, they all will go via one single and global locking path (fil_system mutex) which will make a use of faster storage solutions (flash) simply useless..
so, it was definitively a time to take our hands on this ;-))
The whole story about is pretty amazing, but I have to be short, so :
- in short : we know exactly what we have to do to get a rid of this all
- we have a working prototype code allowing us to expect pretty important potential gains in RW and pure Write workloads
- the only real problem here is that a road from "prototype" to "production quality" code is much longer than anyone could expect (even me ;-))
- so within MySQL 8.0 GA timeframe we could not deliver all the fixes we have, and we have to go by priority here..
- and the priority #1 from the list of issues mentioned above is for sure going to REDO and IO problems, as the most common show-stoppers for most of RW workloads today
- the 8.0 planned changes are not yet final, but you may already get a first idea about by trying our "preview" MySQL 8.0-labs release
While this article will be mostly about the changes we're doing for REDO.
And in fact the story around InnoDB REDO contains many various surprises :
- historically, very often the perception of how REDO activity is impacting overall InnoDB performance was seen as a balance between performance -vs- security in "trx_commit" tuning settings, e.g. :
- innodb_flush_log_at_trx_commit=1 : flushing (fsync) REDO on every COMMIT
- innodb_flush_log_at_trx_commit=2 : flushing REDO only once per second
- general observations : using innodb_flush_log_at_trx_commit=2 gives a better performance
- common conclusion :
- fsync operations are having an important cost, doing it less frequently helps performance
-
use innodb_flush_log_at_trx_commit=2 if you want a better
performance and can accept to loose 1sec of last transactional
activity in case of power off..
- and the main key point in this perception is : "doing fsync to flush REDO is costly"
- while even 20 year ago there were many storage solutions capable to greatly improve write performance (like arrays having battery-protected-cache on controller, or simple write-cache chips, etc.) -- which are particularly will be very efficient with REDO writes which as small and fully sequential..
- however, most of the time the slowness of trx_commit=1 was mostly attributed to "frequent fsync calls" rather to REDO design itself..
- our very fist suspects about REDO design started yet 2 years ago when Sunny implemented a probe dirty patch just to see the potential impact of a different approach in REDO queueing.. => which gave a completely unexpected result : surprisingly observed performance on the same RW workload was better with trx_commit=1 comparing to trx_commit=2..
- after what it became clear that the whole issue is rather related to REDO design, while frequently involved fsync is not representing its main reason but just amplifying the problem..
During the past few years we came with several tentatives to improve InnoDB REDO log design, before to come with an understanding of what exactly do we need ;-)) -- our main target was to improve performance when trx_commit=1 is used (true security when we do flush REDO on every COMMIT), and from "do less fsync to improve performance" we came to conclusion "let's rather be driven by storage capacity".
So far, this is how the new REDO design is different comparing to before (very simplified) :

if before users were constantly fighting for permission to write to REDO, in new design they are not fighting anymore :
- User threads are sending their records to Log Buffer (lock-free)
- Log Writer thread is pushing the records further from Log Buffer to FS cache (buffered write())
- after what Log Flusher thread is involving fsync() to flush REDO asap
- if required, User threads are waiting to be notified their records are flushed (in case of COMMIT for ex.)
- the whole chain is asynchronous and event-driven
- we're not trying to write or to flush less or more / or more or less often.. -- all IO activity is driven by storage capacity
- if storage is capable to write quickly (low write latency) => fsync()s will be more frequent, but with smaller data
- otherwise there will be less frequent fsync()s, but with bigger amount of data to flush
- at the end, the whole processing rate will depend only on storage capacity to write REDO records fast enough !
This new model is only the first step in further REDO improvements. Currently by resolving bottlenecks on REDO layer, we're unlocking user threads to do more work, which is resulting in yet more hot bottlenecks on TRX and LOCK layers. So, there is still a lot of work ahead, and indeed, we're only on the beginning..
However, with new model we discovered few surprises we did not expect on the beginning :

this all related to "low level loads" :
- with old REDO when you have only 1-2 concurrent users, they are not fighting too much for writes
- while with new REDO all the processing work is event-driven and following a chain of events from thread to thread
- and a chain of events between different threads can hardly compete for efficiency -vs- a single thread which is doing all the work alone without any notification waits, etc..
- our final solution for low loads is not yet finalized, but several options are considered
- one of the options : involve CPU spinning in thread waits, which is on cost of additional 20% of CPU usage allowing to catch the same TPS on 1-2 users comparing to what it was with old REDO, but already on 4 concurrent users load reach a higher TPS than before !
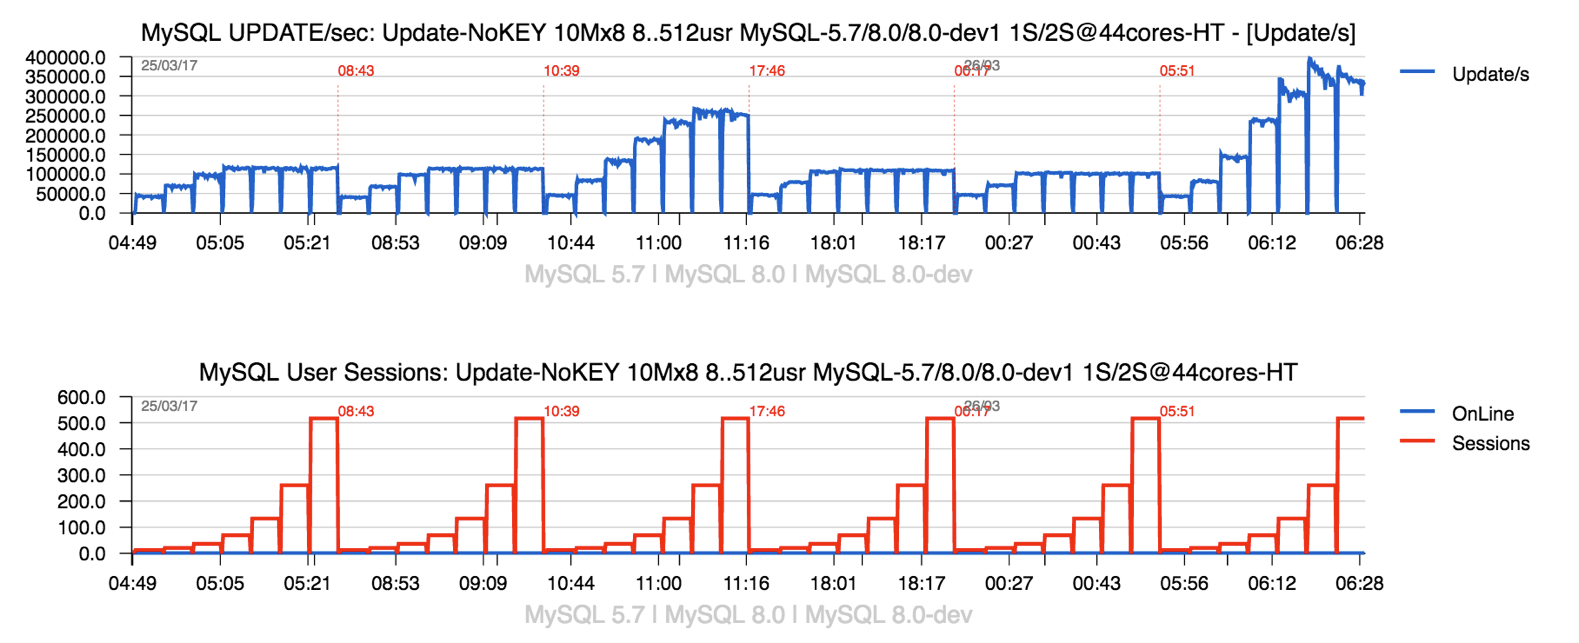
The following "dirty" snapshot from intermediate benchmark results on pure UPDATE workload comparing MySQL 5.6/ 5.7/ 8.0-rc/ 8.0-labs/ 8.0-labs-spinning could give you an idea what kind of headache we may have :

and our main expectation is by combining together all these bits + involving some kind of auto-tuning (or "auto-guided" tuning, etc.) come with something really stable and easy "tunable" for all kind of loads ;-))
While for the time being, here are few benchmark results we currently obtaining on Sysbench RW workloads :
- Server : 48cores-HT, 2CPU sockets (2S) 2.7Ghz (Skylake), OL7.3
- Storage : Intel Optane PCIe 375GB, EXT4
Sysbench OLTP_RW
- workload : New Sysbench OLTP_RW
- data volume : 8 tables of 10M rows each
- encoding : latin1
- user load levels : 1, 2, 4, .. 1024
- engines : MySQL 8.0-labs, MySQL 5.7, MySQL 5.6
-
innodb_flush_log_at_trx_commit=1
Observations :
- 30% gain over MySQL 5.7
- 50% gain over MySQL 5.6
- NOTE: in OLTP_RW workload the majority of queries are Reads, so it's really great to see such a gain, because the main gain on Reads scalability was already reached with MySQL 5.7 ;-)
- on the same time, TRX and LOCK bottlenecks are still remaining..
Sysbench UPDATE-NoIDX
- workload : New Sysbench UPDATE-no_index
- data volume : 8 tables of 10M rows each
- encoding : latin1
- user load levels : 1, 2, 4, .. 1024
- engines : MySQL 8.0-labs, MySQL 5.7, MySQL 5.6
-
innodb_flush_log_at_trx_commit=1
Observations :
- 100% gain over MySQL 5.7
- 50% gain over MySQL 5.6
- NOTE: there is no mistakes in the results ;-)
- 5.7 is really that worse -vs- 5.6 on this workload..
- so, we're very happy to fix this gap finally with 8.0 !
The following config settings was used during the presented benchmark workloads :
[mysqld]
# general
 max_connections=4000
 table_open_cache=8000
 table_open_cache_instances=16
 back_log=1500
 default_password_lifetime=0
 ssl=0
 performance_schema=OFF
 max_prepared_stmt_count=128000
 skip_log_bin=1
 character_set_server=latin1
 collation_server=latin1_swedish_ci
 transaction_isolation=REPEATABLE-READ

# files
 innodb_file_per_table
 innodb_log_file_size=1024M
 innodb_log_files_in_group=32
 innodb_open_files=4000

# buffers
 innodb_buffer_pool_size=32000M
 innodb_buffer_pool_instances=16
 innodb_log_buffer_size=64M

# tune
 innodb_doublewrite=0
 innodb_thread_concurrency=0
 innodb_flush_log_at_trx_commit=1
 innodb_max_dirty_pages_pct=90
 innodb_max_dirty_pages_pct_lwm=10

 join_buffer_size=32K
 sort_buffer_size=32K
 innodb_use_native_aio=1
 innodb_stats_persistent=1
 innodb_spin_wait_delay=6

 innodb_max_purge_lag_delay=300000
 innodb_max_purge_lag=0
 innodb_flush_method=O_DIRECT_NO_FSYNC
 innodb_checksum_algorithm=none
 innodb_io_capacity=4000
 innodb_io_capacity_max=20000
 innodb_lru_scan_depth=9000
 innodb_change_buffering=none
 innodb_read_only=0
 innodb_page_cleaners=4
 innodb_undo_log_truncate=off

# perf special
 innodb_adaptive_flushing=1
 innodb_flush_neighbors=0
 innodb_read_io_threads=16
 innodb_write_io_threads=16
 innodb_purge_threads=4
 innodb_adaptive_hash_index=0

# monitoring
 innodb_monitor_enable='%'
NOTE:
- yes, I know, PFS is turned OFF, the results comparing PFS=on/off are coming later, no worry ;-))
- with 32GB Buffer Pool the whole dataset is remaining in memory, only writes are going to the storage
- checksums were not set either as they are not impacting in this workload
- (the tests results comparing checksum impact are coming later too)
- other tuning details I'll explain in the next articles..
Also, I've intentionally skipped here all the problems related to InnoDB Double Write Buffer (the only feature protecting you today from partially written pages (except if you're using COW FS (like ZFS or similar)) -- this feature as it is became a huge bottleneck by itself.. -- our fix was ready yet for MySQL 5.7, but missed the GA timeframe, so was delayed for 8.0, where it met a list of several pre-requirement before allowed to be pushed, but finally it's only a question of time now to see the fix applied and delivered as part MySQL 8.0 features..
In case you want to replay the same tests, you may follow the same instructions as in the previous post to setup the scripts and load the test data, then just execute :
OLTP_RW :
cd /BMK
for nn in 1 2 4 8 16 32 64 128 256 512 1024
do
   sh sb_exec/sb11-OLTP_RW_10M_8tab-uniform-ps-trx.sh $nn 300
   sleep 60
done
UPDATE-NoIDX :
cd /BMK
for nn in 1 2 4 8 16 32 64 128 256 512 1024
do
   sh sb_exec/sb11-OLTP_RW_10M_8tab-uniform-upd_noidx1-notrx.sh $nn 300
   sleep 60
done
So far, we're expecting to see a significant progress on RW performance with MySQL 8.0 ! However, regardless positive overall benchmark results comparing to previous MySQL version, we're still far from scaling on Writes.. -- work in progress, stay tuned, yet more to come.. ;-))
and THANK YOU for using MySQL !
Rgds,
-Dimitri
Wednesday, 04 October, 2017
MySQL Performance : 2.1M QPS on 8.0-rc
The first
release candidate of MySQL 8.0 is here, and I'm happy to share few
performance stories about. This article will be about the "most simple"
one -- our in-memory Read-Only performance ;-))
However, the used
test workload was here for double reasons :
- 1) validate MySQL 8.0 performance
- 2) fully evaluate the "New" Sysbench developed by Alex (https://github.com/akopytov/sysbench)
Going ahead to the second point, the main worry about New Sysbench was about its LUA overhead (the previous version 0.5 was running slower than the old one 0.4 due LUA) -- a long story short, I can confirm now that the New Sysbench is running as fast as the oldest "most lightweight" Sysbench binary I have in use ! so, KUDOS Alex !!! ;-))
While regarding the improvements coming with MySQL 8.0 on Read-Only workloads I'd mention :
- several "overheads" were fixed
- the most notable one is related to UTF8, of course
- however, even latin1 related functions were improved little bit
- but this was only about "overheads", and nothing about "scalability"
- because the main "scalability" gap was already made with MySQL 5.7 two years ago ;-))
- so, our main merit with MySQL 8.0 here will be rather NOT TO LOOSE the already obtained gain !
- (agree, sounds very odd, but if you'll just look on the list of the all new features coming with 8.0 you can imagine our code path is not going to be shorter, right ? ;-))
- so the fair test here will be to compare 8.0 vs 5.7 and 5.6 with latin1 encoding
- (for UTF8 the winner is 8.0 and from very far, which you already know)
The most "sensible" RO workload in Sysbench is Point-Selects, so here is my test scenario:
- workload : New Sysbench RO point-selects
- data volume : 8 tables of 10M rows each
- encoding : latin1
- user load levels : 1, 2, 4, .. 1024
- engines : MySQL 8.0, MySQL 5.7, MySQL 5.6
- server : 96cores-HT 4CPU sockets 2.2Ghz (Broadwell), OL7.3
and here is the result :

Observations :
- 2.1M SQL Query/sec for MySQL 8.0 -- our current new Max QPS record obtained in MySQL history !
- which is great, no doubt !
- however, there is a clearly seen small, but visible QPS regression on lower load levels..
- which is not really cool (even if could be easily explained by increased code path + new DD + etc.. etc..)
- well, adding it to my list of "low load" performance issues and will investigate later..
So far, the 2.1M QPS result is obtained on the "old" Broadwell CPU, there is no any bottlenecks observed (only potential overheads), so for the moment I have no idea what to expect on the same workload on 4CPU sockets Skylake, will share the results once have such a box in my hands ;-))
Then, many people are constantly asking me about how to reproduce the presented results, so the following all all exactly details you may need:
1) install and start your MySQL 8.0 instance (rc or current labs release)
2) the config settings I've used is here :
[mysqld]

# general
 max_connections=4000
 table_open_cache=8000
 table_open_cache_instances=16
 back_log=1500
 default_password_lifetime=0
 ssl=0
 performance_schema=OFF
 max_prepared_stmt_count=128000
 skip_log_bin=1
 character_set_server=latin1
 collation_server=latin1_swedish_ci
 transaction_isolation=REPEATABLE-READ

# files
 innodb_file_per_table
 innodb_log_file_size=1024M
 innodb_log_files_in_group=3
 innodb_open_files=4000

# buffers
 innodb_buffer_pool_size=32000M
 innodb_buffer_pool_instances=16
 innodb_log_buffer_size=64M

# tune
 innodb_doublewrite=0
 innodb_thread_concurrency=0
 innodb_flush_log_at_trx_commit=1
 innodb_max_dirty_pages_pct=90
 innodb_max_dirty_pages_pct_lwm=10

 join_buffer_size=32K
 sort_buffer_size=32K
 innodb_use_native_aio=1
 innodb_stats_persistent=1
 innodb_spin_wait_delay=6

 innodb_max_purge_lag_delay=300000
 innodb_max_purge_lag=0
 innodb_flush_method=O_DIRECT_NO_FSYNC
 innodb_checksum_algorithm=none
 innodb_io_capacity=4000
 innodb_io_capacity_max=20000
 innodb_lru_scan_depth=9000
 innodb_change_buffering=none
 innodb_read_only=0
 innodb_page_cleaners=4
 innodb_undo_log_truncate=off

# perf special
 innodb_adaptive_flushing=1
 innodb_flush_neighbors=0
 innodb_read_io_threads=16
 innodb_write_io_threads=16
 innodb_purge_threads=4
 innodb_adaptive_hash_index=0

# monitoring
 innodb_monitor_enable='%'
NOTE: yes, I know, PFS is turned OFF, the results comparing PFS=on/off are coming later, no worry ;-))
4) download the tarball with my scripts + sysbench binary + my.conf, and then untar it into "/" directory
5) this will create /BMK directory with all the stuff inside, so edit the ".bench" file to provide the account details to connect to your MySQL instance (user, passwd, host, port)
6) create "sysbench" database
7) run the load data script :
this will load 8 tables with 8M rows each$ cd /BMK $ sh sb_exec/sb11-Prepare_10M_8tab-InnoDB.sh
8) run ANALYZE on each table within sysbench database to be sure your stats for these tables are up-to-date
9) run the test :
$ cd /BMK
$ for nn in 1 2 4 8 16 32 64 128 256 512 1024
do
   sh sb_exec/sb11-OLTP_RO_10M_8tab-uniform-ps-p_sel1-notrx.sh $nn 300
   sleep 60
done
10) enjoy ;-))
stay tuned, more to come..
Rgds,
-Dimitri
Tuesday, 09 May, 2017
MySQL Performance: 8.0-dev Progress Details
As promised, here is the follow up of the MySQL 8.0-dev Progress teaser
;-)
so, yes, we expect to see the most hot contentions gone, as
it's seen from the following graph :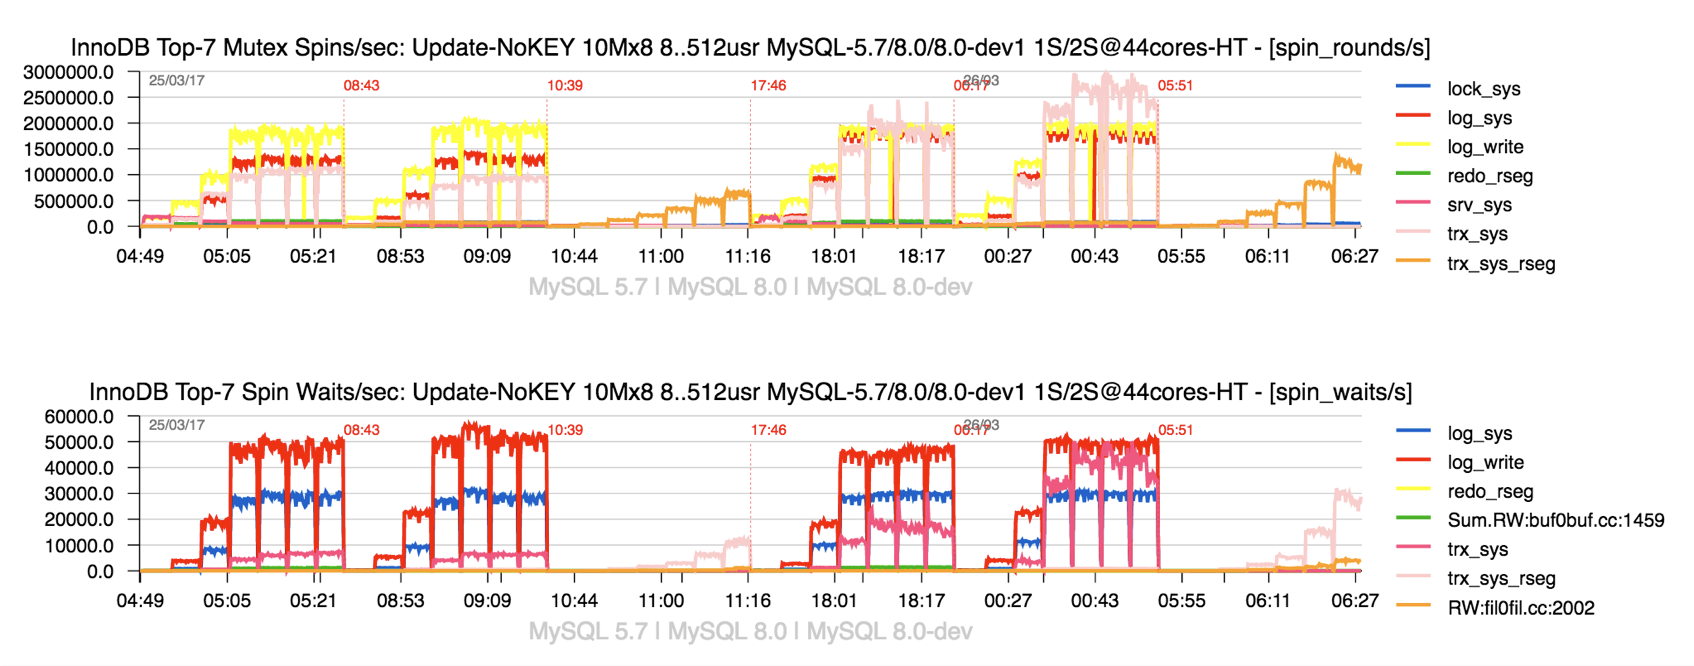
Observations
:
- the graph is representing the spin waits / spin rounds events happening during the same Sysbench Update-NoKEY workload
- the load is progressing from 8 concurrent users to 16, 32, .. 512
- 3 engines are tested one after one : MySQL 5.7, MySQL 8.0 (current DMR), MySQL 8.0-dev (current prototype)
- first all 3 engines are running on 22cores-HT only (1 CPU socket)
- then, the second time : on 44cores-HT (2 CPU sockets)
- and the most important thing to retain about this graph is that on 8.0-dev we see all main hot contentions gone ;-)
Observations :
- one of the most painful things about current InnoDB WRITE performance is its scalability.. (in fact the absence of scalability ;-))
- the problem is not new, just that since READ scalability was greatly improved since MySQL 5.7, seeing WRITE to remain not scaling become even more painful..
- and this is because of all overhead and contentions we have on REDO level, transactions & lock management, etc..
- so, MySQL 5.7 and 8.0 DMR are limited by this, and moving from 1 CPU socket to 2 CPU socket cannot help here (in fact the things may become only worse as with more CPU cores all these contentions will become only higher)..
- while 8.0-dev code is giving us a huge expectation to finally see all these problems gone, and potentially get x2 times better performance even on a single CPU socket !! ;-))
- NOTE : we're not running for "high numbers" here, there was a long and hard battle to see performance improvement since a low load as well, so a positive difference is already seen on 8 users, and even more seen since 16 ;-)
However, this is not the only benefit.. -- the story is going way more far, because all this deep remastering is potentially allowing us to get a rid of all the overhead we see when READ COMMITTED (RC) transaction isolation is used.. - example of such an overhead you can see from here :
- http://dimitrik.free.fr/blog/archives/2015/02/mysql-performance-impact-of-innodb-transaction-isolation-modes-in-mysql-57.html
and this was one of many reasons why REPEATABLE READ (RR) transaction isolation is historically used within InnoDB by default (and still continue to be the default in MySQL 5.7)..
While potentially with 8.0-dev the things could finally change ;-)
The following graphs are representing the results from Sysbench OLTP_RW workload comparing MySQL 5.7 and 8.0-dev :

Observations :
- first the test is executed with RR isolation on both 5.7 and 8.0-dev
- yes, 8.0-dev is doing better than 5.7, but the most important is the next ;-)
- the next step both are executed with RC isolation
- and then you can see TPS on 5.7 going lower..
- while on 8.0-dev TPS level remains just the same on RC as on RR !! ;-)
Well, work in progress, crossing fingers, stay tuned ;-))
the last remark: just to bring your attention once more that MySQL 8.0 is moved to have UTF8 charset by default !!! => so, if you're planning to run any tests with 8.0 DMR, please, mind to remember this !! - so use UTF8 on both sides (server and client) and consider the UTF8 overhead, or switch the server back to latin1 if your "client" apps are latin1.. -- otherwise you'll not be happy ;-))
more benchmark results and further observations about MySQL 8.0-dev you can find in my slides :
- MySQL-8.0-dev-Benchmarks-Scalability-Apr.2017-dim.pdf
Thank you for using MySQL ! and Go MySQL !! ;-))
Rgds,
-Dimitri