« May 2013 | Main | March 2013 »
Sunday, 21 April, 2013
MySQL Performance: What are your top-5 performance issues?..

|
I have a talk
about MySQL 5.6 Performance related stuff during Percona Live
(this Wednesday, 24 April 2:00pm - 2:50pm @ Ballroom A). But my main
interest during this Conference is to exchange with you as much as
possible about what kind of performance problems you meet generally
and what are your top-5 performance issues in MySQL workloads
you have today right now? (ordered by priority).. Come to discuss it live -- we have also:
As well there are several evening events first day, second, and third - if you prefer to discuss it around a beer ;-)) While you may also left a comment about your top-5 issues here, and then let's talk about.. Rgds, -Dimitri |
MySQL Performance: Analyzing Benchmarks, part 4: TRX list
This article inspired by benchmark
results published by Alexey @Percona related to the "trx_list"
modifications came with latest
Percona Server 5.5. I was particularly curious about this feature,
because the exactly the same solution was rejected by Sunny two years
ago while analyzed this kind of problems (described within presented bug
report and others)..
But well, one real test result is better
than many discussions, so let's see what kind of results I will get on
my own server. I'll test the same OLTP_RO Point-Select workload using 8
tables (by running 8 Sysbench processes in parallel). I'd say that this
kind of load was initially pretty problematic for MySQL 5.6, as queries
here are very short and running particularly fast. So, the idea of
Read-Only transaction feature coming in 5.6 initially because of this
workload, before being useful in other cases as well.
So, lets
try the first case when transactions are not used and user sessions are
using auto-commit (which is automatically will use Read-Only
transactions in 5.6). The following graph is representing OLTP_RO
Point-Select test on 16cores (MySQL server is running within a taskset
with 16cores HT-enabled):
MySQL 5.6 -vs- Percona 5.5
@16cores-HT :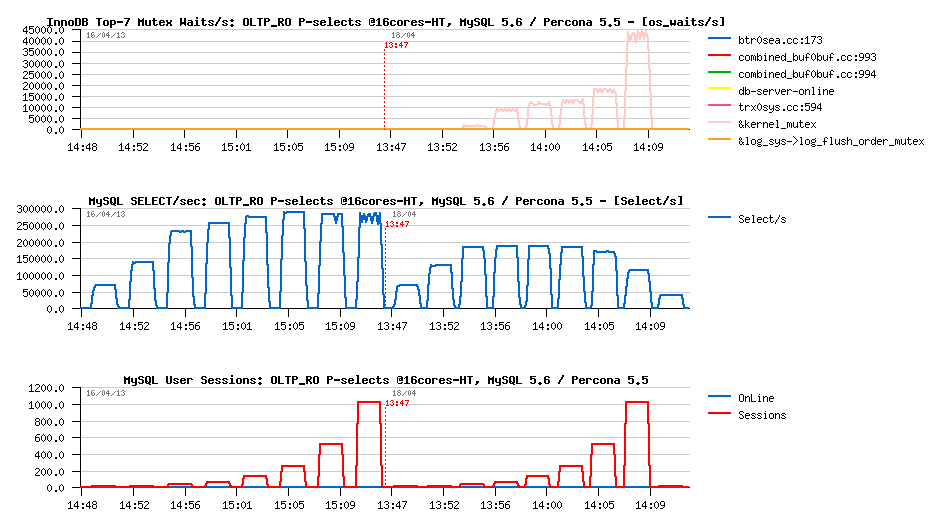
Observations
:
- Percona Server 5.5 is still hitting kernel_mutex contention here
- While MySQL 5.6 is hitting now trx_sys_mutex contention here, which is much lower also and near invisible comparing to kernel_mutex waits on the InnoDB mutex waits graph...
- Percona Server is reaching near 200K QPS here (seems like my server is not as fast as tested by Alexey to show higher QPS)..
- while MySQL 5.6 is not far from 300K QPS within the same workload..
- so, looks to me like Sunny was right ;-)
- or probably we will have more details once Percona will release their 5.6 code tree? - let's see..
- however, the advantage of 5.6 on this test is pretty clear and doesn't need any comment ;-)
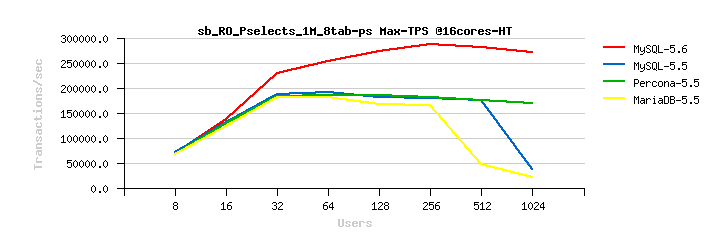
Now, let's bring to the same picture also MySQL 5.5 and MariaDB 5.5.
MySQL 5.6/ MySQL 5.5/ MariaDB 5.5/ Percona 5.5 @16cores-HT :
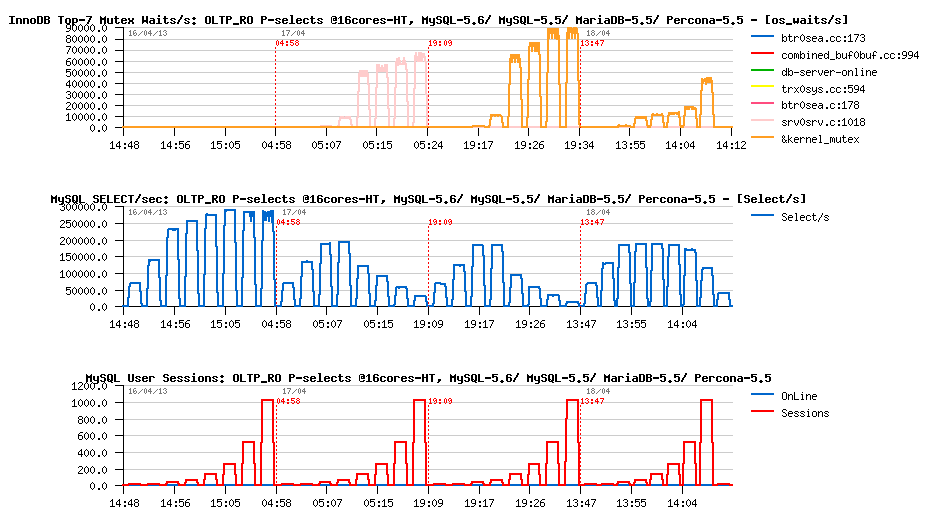
Observations :
- Percona 5.5 has a clear advantage here over MySQL 5.5 and MariaDB 5.5
- kernel_mutex contention is dominating on all 5.5 based engines
- while MySQL 5.6 is just out-passing them all..
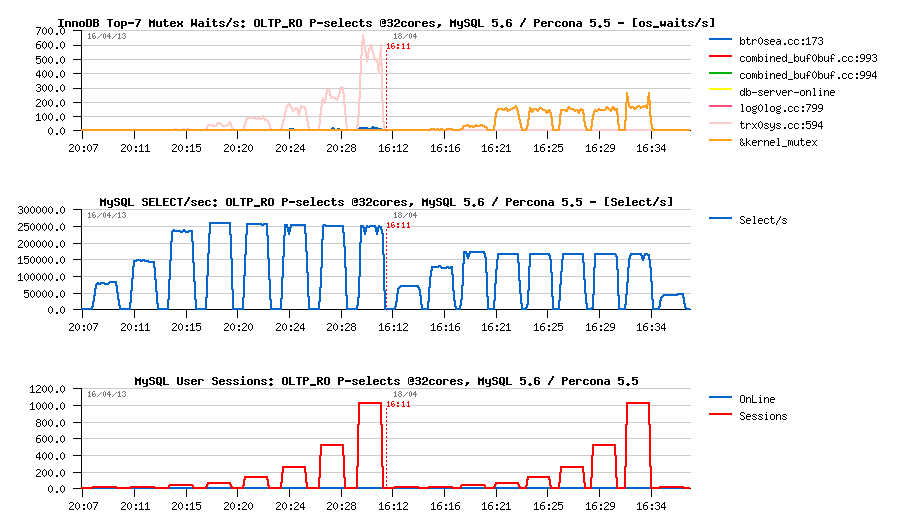
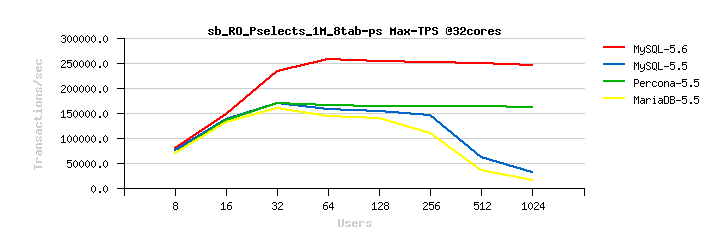
However, more work is needed in 5.6 to get a rid of this trx_sys_mutex contention, because on 32cores it kills performance and we are hitting QPS drop rather increase. And again, have to lower this contention by using a bigger "spin delay" value (96 here) to avoid getting things even worse.. However MySQL 5.6 is still better here than Percona 5.5:
MySQL 5.6 / Percona 5.5 @32cores :
And if we enable HT here the result will be only worse:
MySQL 5.6 @32cores, HT=off / on :
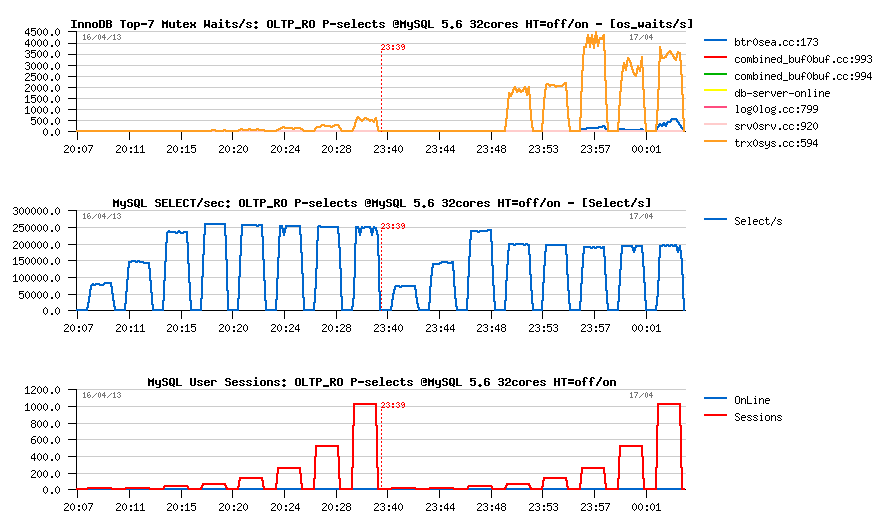
Probably this is a good example of problems related to hot contentions (enabling HT on 16cores improving performance, and using 16cores-HT giving a better result than pure 32cores -- as this contention is so hot, it's as expected then..)
While, of course, as soon as you're having slightly more heavy queries within your workload, this contention will have much less impact, and you'll get higher QPS on 32cores rather on 16cores and matching your HW capacity.. But we have a good challenge here, so work continues, stay tuned ;-)
Regarding the test case #2 (when transactions are used) - well, nothing surprising in results, because it was exactly the reason to have Read-Only transactions feature, right? ;-) However, I may say you now that in the next MySQL 5.6 release the code is discovering "auto-magically" Read-Only transactions (in fact any transaction is considered Read-Only until it did not involve any writes, and switching to a "normal" transaction model as soon as the first write was involved).. - just wait little bit before the code is published..
To summarize, here are few "simple" charts presenting obtained results:
OLTP_RO 8-tables Point-Selects @16cores-HT :
OLTP_RO 8-tables Point-Selects @32cores :
All this said, there was a very good progress we made already in MySQL 5.6, but there are still tons of challenges in MySQL to improve performance and yet more to do ;-) (and many similar things coming in mind while on road to Percona Live MySQL Conference and flying from Paris to San Francisco.. - looking forward to discuss about any MySQL Performance problems there, so see you soon, it's already within 2 days! ;-))
Rgds,
-Dimitri
Wednesday, 10 April, 2013
MySQL Performance: Analyzing Benchmarks, part-3 : Low Level Workloads with MySQL 5.6
This article was inspired by problems on low level workloads initially
reported by Peter Zaitsev (Is
MySQL 5.6 is slower than 5.5?, and then Why
mysql performance at low concurrency is important) and Mark
Callaghan (MySQL
5.6 single-threaded read-only, MySQL
5.6 single-thread update-only, MySQL
5.6 - incomplete perf-guide..)..
Sorry, it'll be long.. :-)
Of
course the "low level" performance is important and remains significant.
And "small servers" performance too. In many cases people supposing they
have a heavy load because there are observing hundreds or thousands
"active" connections, while in reality only few of them are truly active
on the same time, and concurrency level is much lower than initially
supposed.. Such workloads may remain near free from any internal or
external contention, and have performance level depending only on the
pure code path overhead..
I'll start first with Read-Only tests
(Sysbench OLTP_RO, which is used so often), as this test case is the
most simple and really only few factors coming into the game.
Single User OLTP_RO Performance |
What is important here... - single user (or single thread) workload is completely free of any possible or potential contention, so if there is any difference in execution time, then it represents a pure overhead (coming from "somewhere").. Now, if we're comparing MySQL 5.6 with 5.5 (and yet with 5.1) we have to keep in mind that there was no fundamental changes made between them to improve the code path itself. MySQL was lacking "must have" features that people needing in production, so every new release came with a bigger code (means more and more longer code path).. - so just from a "common sense" single user performance cannot be better on MySQL 5.6 than on 5.5 (and not on 5.1 which is even not having MDL code)..
And then we may always speculate on Performance Schema (PFS) impact, Optimizer Traces, not optimal MDL, etc. etc. - forgetting that exactly all these "goodies" will completely change and speed-up your developments and workload analyzes ;-) So, yes, you may still compile MySQL 5.6 without all this stuff and win some 5% or maybe even 10% in performance.. - but it'll be likely you decided to remove from your own car all counters, electronics and air conditioning just to save in autonomy by lowering electricity consumption.. - but will you then still consider it as a "safe driving"? ;-)) (but well, we're not stopping to work on it, and things are constantly improved, stay tuned ;-))
BTW, also while analyzing various MySQL 5.6 "overheads" I've also discovered that on some queries/workloads I'm getting up to 12%(!) performance improvement with MySQL binaries are compiled without "-fno-omit-frame-pointer" GCC option.. - but will you ever consider to use such a MySQL server binaries in production? - because from such a binary you'll never able to get a complete stack trace, means if you'll have any core dumps they all will be just useless, and could be sent directly to /dev/null.. ;-)
But well, this is still yet a half of the problem.. - the main problem for me is that single user OLTP_RO is giving me completely different results from run to run (same test, same config, same HW - but different results from run to run).. Thing are going so fast on OLTP_RO workload once all the data are cached by InnoDB Buffer Pool, then performance result becomes depending on many small things (CPU cache, RAM latency, etc.).. So, when on the same run without any changes you may already get 3% difference, it becomes even harder to understand if some applied new changes will bring you real improvement or additional overhead..
However, we may expect a better stability when we're observing more concurrent sessions running, right? - so, on the following example I've started with 8 concurrent users.
Low Level OLTP_RO Workloads |
Let's get a look on the following test results:
- this is a "classic" Sysbench OLTP_RO workload on 12cores server
- note: used here MySQL server binaries are compiled without(!) PFS
- transaction clauses are not used..
- MySQL server is started cold, then few tests executed to "pre-warm" the cache
- then the same "referenced" OLTP_RO test executed 3 times (one after one)
- then MySQL server restarted again, pre-warn and the same 3 tests executed again..
- and all these 3 times too, so in total we have 9 test results which are expected to be "near the same", right?..
Le't see now what we're getting in reality:
+------------------+---------+-------+-------+-------+
| Test             | Engine  | PFS   | Users | QPS   |
+------------------+---------+-------+-------+-------+
| sb_OLTP_RO_1M-ps | mysql55 | noPFS |     8 | 69577 |
| sb_OLTP_RO_1M-ps | mysql55 | noPFS |     8 | 70721 |
| sb_OLTP_RO_1M-ps | mysql55 | noPFS |     8 | 70779 |
| sb_OLTP_RO_1M-ps | mysql55 | noPFS |     8 | 71245 |
| sb_OLTP_RO_1M-ps | mysql55 | noPFS |     8 | 71418 |
| sb_OLTP_RO_1M-ps | mysql55 | noPFS |     8 | 71507 |
| sb_OLTP_RO_1M-ps | mysql55 | noPFS |     8 | 71564 |
| sb_OLTP_RO_1M-ps | mysql55 | noPFS |     8 | 71721 |
| sb_OLTP_RO_1M-ps | mysql55 | noPFS |     8 | 72015 |
| sb_OLTP_RO_1M-ps | mysql56 | noPFS |     8 | 65489 |
| sb_OLTP_RO_1M-ps | mysql56 | noPFS |     8 | 66156 |
| sb_OLTP_RO_1M-ps | mysql56 | noPFS |     8 | 66833 |
| sb_OLTP_RO_1M-ps | mysql56 | noPFS |     8 | 67293 |
| sb_OLTP_RO_1M-ps | mysql56 | noPFS |     8 | 67328 |
| sb_OLTP_RO_1M-ps | mysql56 | noPFS |     8 | 67395 |
| sb_OLTP_RO_1M-ps | mysql56 | noPFS |     8 | 67494 |
| sb_OLTP_RO_1M-ps | mysql56 | noPFS |     8 | 68655 |
| sb_OLTP_RO_1M-ps | mysql56 | noPFS |     8 | 69030 |
+------------------+---------+-------+-------+-------+
Observations :
- you can see that 5.6 results are in range of [65489 - 69030] QPS..
- and 5.5 are in [69577 - 72015] QPS..
- so, there is already 5% variation on the 5.6 results
- and 3% on 5.5
- however, if you're really unlucky and in your test series will match the worse time of 5.6 and the best time of 5.5 then you'll observe 10%(!) regression from 5.5 to 5.6..
- and if you're unlucky in opposite side: then the difference will be only 0.7%(!) and you'll even not consider it, right? ;-))
So, seems like to understand something here the only solution is to repeat the same tests as much an possible, and then get an AVG value from obtained variations, which will look then like following:
+------------------+---------+-------+-------+------------+
| Test             | Engine  | PFS   | Users | Avg_QPS    |
+------------------+---------+-------+-------+------------+
| sb_OLTP_RO_1M-ps | mysql55 | noPFS |     8 | 71171.8889 |
| sb_OLTP_RO_1M-ps | mysql56 | noPFS |     8 | 67297.0000 |
+------------------+---------+-------+-------+------------+
which is giving us 5.8% performance regression comparing 5.5 to 5.6 on 8 user sessions.. - pretty strange how it was possible that such a difference escaped from our QA tests, because our "red line" there is around 3% (and every test is executed 3 times) - probably we were just little bit more lucky here, etc. - don't know..
But result is a result, and we cannot ignore it, right? ;-)) However, the most interesting for me here is to know exactly from where the difference is coming (and fix it then if it's possible) -- but there is another fun stuff coming ;-)
So, I'm profiling now the same 5.6 and 5.5 workloads with "perf" and getting:
- 5.6 : 64400 QPS
- 5.5 : 70800 QPS
both results are slightly worse than expected (yes, "perf" tool also has its overhead, not only MySQL stuff ;-)), however the result is the result, and there is really 10% difference happened during these tests under profiling, so we should see something pretty visible and big in profiler reports, right? (well, at least expect to see finally something and then at least to know what to fix)..
From a long time I've developed a tool helping me to compare several "perf" reports and highlight the difference. As well we have to keep in mind this "regression level" and do a kind of "normalization" between 5.5 and 5.6 reports -- CPU% time should be slightly increased for the slowest engine (5.6) to be comparable with another one (5.5), so I've used here a multiplier of x1.10 and the result is the following with top-50 most "hot" functions:
Perf List :
|
| Top-50 Function Name(s) | CPU% #1 | CPU% #2 | + | +w |
|---|---|---|---|---|
| my_hash_sort_simple | 10.68 | 11.58 | +8.44% | +0.90 |
| memcpy | 3.71 | 3.67 | ||
| row_search_for_mysql | 3.46 | 2.77 | ||
| ptr_compare_0 | 1.62 | 0.24 | ||
| my_strnxfrm_simple | 1.34 | 1.41 | +5.06% | +0.07 |
| libjemalloc | 1.23 | 1.01 | ||
| make_join_statistics | 0.93 | 1.29 | +38.37% | +0.36 |
| btr_search_guess_on_hash | 0.98 | 1.01 | +3.25% | +0.03 |
| JOIN::optimize | 0.97 | 0.85 | ||
| row_sel_store_mysql_rec | 0.88 | 0.33 | ||
| buf_block_align | 0.87 | 0.97 | +11.25% | +0.10 |
| __merge_sort_loop | - | 0.90 | +0.90% | +0.90 |
| __pthread_mutex_lock_internal | 0.81 | 0.89 | +9.99% | +0.08 |
| rec_init_offsets | 0.81 | 0.79 | ||
| rec_get_offsets_func | 0.74 | 0.82 | +9.99% | +0.07 |
| __merge_sort_with_buffer | - | 0.76 | +0.76% | +0.76 |
| _spin_lock_bh | 0.69 | 0.69 | +0.42% | +0.00 |
| my_strnncollsp_simple | 0.66 | 0.73 | +9.99% | +0.07 |
| Field_string::pack | 0.65 | 0.65 | ||
| tcp_recvmsg | 0.60 | 0.71 | +17.32% | +0.10 |
| __memset_sse2 | 0.55 | 0.36 | ||
| my_lengthsp_8bit | 0.54 | 0.54 | ||
| open_table | 0.51 | 0.31 | ||
| lock_clust_rec_cons_read_sees | 0.49 | 0.47 | ||
| dispatch_command | 0.43 | 0.53 | +22.78% | +0.10 |
| cmp_dtuple_rec_with_match_low | - | 0.52 | +0.52% | +0.52 |
| buf_page_get_gen | 0.39 | 0.52 | +32.55% | +0.13 |
| cmp_dtuple_rec_with_match | 0.46 | - | ||
| evaluate_join_record | 0.45 | 0.51 | +12.43% | +0.06 |
| my_qsort2 | 0.45 | 0.22 | ||
| open_tables | 0.45 | 0.46 | +2.66% | +0.01 |
| JOIN::prepare | 0.39 | 0.48 | +24.09% | +0.09 |
| tcp_sendmsg | 0.37 | 0.48 | +30.80% | +0.11 |
| mysql_execute_command | 0.37 | 0.47 | +27.83% | +0.10 |
| tcp_ack | 0.42 | - | ||
| filesort | 0.42 | 0.32 | ||
| __pthread_mutex_unlock | 0.41 | 0.29 | ||
| row_sel_field_store_in_mysql_format_func | - | 0.44 | +0.44% | +0.44 |
| fget_light | 0.30 | 0.44 | +46.65% | +0.14 |
| buf_page_get_known_nowait | 0.30 | 0.42 | +39.32% | +0.12 |
| ha_innobase::general_fetch | 0.23 | 0.42 | +81.72% | +0.19 |
| mysql_select | 0.33 | 0.41 | +23.32% | +0.08 |
| trx_start_low | 0.21 | 0.40 | +88.55% | +0.19 |
| Item_func_between::val_int | 0.35 | 0.37 | +6.85% | +0.02 |
| THD::enter_stage | - | 0.39 | +0.39% | +0.39 |
| copy_user_generic_string | 0.28 | 0.37 | +33.56% | +0.09 |
| hp_write_key | 0.34 | 0.37 | +9.99% | +0.03 |
| __pthread_getspecific_internal | 0.33 | 0.37 | +13.32% | +0.04 |
| build_template | 0.33 | - | ||
| make_join_select | - | 0.36 | +0.36% | +0.36 |
|
+613.88% |
+6.67 |
|||
Observations :
- you can see that the most hot function here is my_hash_sort_simple(), however there is only 8.4% difference between 5.5 and 5.6 here, and only 0.90% of "pure weight"..
- while there are function going up to 88% in difference, like trx_start_low(), but having only 0.19% in weight..
- or __merge_sort_loop() and __merge_sort_with_buffer() which are completely new for 5.6 (and not present in 5.5), and their sum weight will at least out-pass 1.5% ;-)
- so, from where the main difference is coming?..
- while it's sure if in 5.6 we were able to divide by 2 time spent in the my_hash_sort_simple() function -- then we may expect to see a pretty positive difference in this workload, but it's not yet a case ;-))
- and not the the summary percentage weight at the end of the report - it's 6.67% in difference comparing diff 5.5 vs 5.6
Here is the result:
Perf List :
|
| Top-50 Function Name(s) | CPU% #1 | CPU% #2 | + | +w |
|---|---|---|---|---|
| my_hash_sort_simple | 11.58 | 10.68 | ||
| memcpy | 3.67 | 3.71 | +1.02% | +0.04 |
| row_search_for_mysql | 2.77 | 3.46 | +24.97% | +0.69 |
| ptr_compare_0 | 0.24 | 1.62 | +569.49% | +1.38 |
| my_strnxfrm_simple | 1.41 | 1.34 | ||
| libjemalloc | 1.01 | 1.23 | +21.55% | +0.22 |
| make_join_statistics | 1.29 | 0.93 | ||
| btr_search_guess_on_hash | 1.01 | 0.98 | ||
| JOIN::optimize | 0.85 | 0.97 | +14.53% | +0.12 |
| row_sel_store_mysql_rec | 0.33 | 0.88 | +166.69% | +0.55 |
| buf_block_align | 0.97 | 0.87 | ||
| __merge_sort_loop | 0.90 | - | ||
| __pthread_mutex_lock_internal | 0.89 | 0.81 | ||
| rec_init_offsets | 0.79 | 0.81 | +2.28% | +0.02 |
| rec_get_offsets_func | 0.82 | 0.74 | ||
| __merge_sort_with_buffer | 0.76 | - | ||
| _spin_lock_bh | 0.69 | 0.69 | ||
| my_strnncollsp_simple | 0.73 | 0.66 | ||
| Field_string::pack | 0.65 | 0.65 | +0.16% | +0.00 |
| tcp_recvmsg | 0.71 | 0.60 | ||
| __memset_sse2 | 0.36 | 0.55 | +51.53% | +0.19 |
| my_lengthsp_8bit | 0.54 | 0.54 | +0.20% | +0.00 |
| open_table | 0.31 | 0.51 | +65.60% | +0.20 |
| lock_clust_rec_cons_read_sees | 0.47 | 0.49 | +3.60% | +0.02 |
| dispatch_command | 0.53 | 0.43 | ||
| cmp_dtuple_rec_with_match_low | 0.52 | - | ||
| buf_page_get_gen | 0.52 | 0.39 | ||
| cmp_dtuple_rec_with_match | - | 0.46 | +0.46% | +0.46 |
| evaluate_join_record | 0.51 | 0.45 | ||
| my_qsort2 | 0.22 | 0.45 | +104.57% | +0.23 |
| open_tables | 0.46 | 0.45 | ||
| JOIN::prepare | 0.48 | 0.39 | ||
| tcp_sendmsg | 0.48 | 0.37 | ||
| mysql_execute_command | 0.47 | 0.37 | ||
| tcp_ack | - | 0.42 | +0.42% | +0.42 |
| filesort | 0.32 | 0.42 | +31.67% | +0.10 |
| __pthread_mutex_unlock | 0.29 | 0.41 | +43.37% | +0.12 |
| row_sel_field_store_in_mysql_format_func | 0.44 | - | ||
| fget_light | 0.44 | 0.30 | ||
| buf_page_get_known_nowait | 0.42 | 0.30 | ||
| ha_innobase::general_fetch | 0.42 | 0.23 | ||
| mysql_select | 0.41 | 0.33 | ||
| trx_start_low | 0.40 | 0.21 | ||
| Item_func_between::val_int | 0.37 | 0.35 | ||
| THD::enter_stage | 0.39 | - | ||
| copy_user_generic_string | 0.37 | 0.28 | ||
| hp_write_key | 0.37 | 0.34 | ||
| __pthread_getspecific_internal | 0.37 | 0.33 | ||
| build_template | - | 0.33 | +0.33% | +0.33 |
| make_join_select | 0.36 | - | ||
|
+1102.46% |
+5.10 |
|||
- I'm pretty sure that if I'd show this report to anyone without saying who is running faster, 5.5 or 5.6, and just asking to point to the source of regression, there are many functions which can be easily chosen as candidate for the most problematic ;-))
- ptr_compare_0() is a very good candidate with it's 569% difference ;-)
- and my_qsort2() too (with some others as well ;-)
- while it's till 5.5 which is running faster!..
- and the sum weight in 5.6 vs 5.5 is finally 5.10%, which is comparing to 6.67% in 5.5 vs 5.6 is giving only 1.57%..
- as you can see, it'll be very hard to find something there..
Looks like the best "potential" candidate is still my_hash_sort_simple() function, because improved time on this one will at least be very visible as it represents 10% of the whole execution time..
A similar story is coming with 32 users on this server too, except that it has a smaller variation:
+------------------+---------+-------+-------+--------+
| Test             | Engine  | PFS   | Users | QPS    |
+------------------+---------+-------+-------+--------+
| sb_OLTP_RO_1M-ps | mysql55 | noPFS |    32 | 149592 |
| sb_OLTP_RO_1M-ps | mysql55 | noPFS |    32 | 149593 |
| sb_OLTP_RO_1M-ps | mysql55 | noPFS |    32 | 149681 |
| sb_OLTP_RO_1M-ps | mysql55 | noPFS |    32 | 149699 |
| sb_OLTP_RO_1M-ps | mysql55 | noPFS |    32 | 149745 |
| sb_OLTP_RO_1M-ps | mysql55 | noPFS |    32 | 149762 |
| sb_OLTP_RO_1M-ps | mysql55 | noPFS |    32 | 150522 |
| sb_OLTP_RO_1M-ps | mysql55 | noPFS |    32 | 150586 |
| sb_OLTP_RO_1M-ps | mysql55 | noPFS |    32 | 150603 |
| sb_OLTP_RO_1M-ps | mysql56 | noPFS |    32 | 149007 |
| sb_OLTP_RO_1M-ps | mysql56 | noPFS |    32 | 149017 |
| sb_OLTP_RO_1M-ps | mysql56 | noPFS |    32 | 149147 |
| sb_OLTP_RO_1M-ps | mysql56 | noPFS |    32 | 149195 |
| sb_OLTP_RO_1M-ps | mysql56 | noPFS |    32 | 149308 |
| sb_OLTP_RO_1M-ps | mysql56 | noPFS |    32 | 149497 |
| sb_OLTP_RO_1M-ps | mysql56 | noPFS |    32 | 149514 |
| sb_OLTP_RO_1M-ps | mysql56 | noPFS |    32 | 149541 |
| sb_OLTP_RO_1M-ps | mysql56 | noPFS |    32 | 149671 |
+------------------+---------+-------+-------+--------+
So,
- 5.6 : [149007 - 149671] QPS, 0.4% variation
- 5.5 : [149592 - 150603] QPS, 0.6% variation
And in average QPS we're getting finally 0.4% regression only :
+------------------+---------+-------+-------+-------------+
| Test             | Engine  | PFS   | Users | Avg_QPS     |
+------------------+---------+-------+-------+-------------+
| sb_OLTP_RO_1M-ps | mysql55 | noPFS |    32 | 149975.8889 |
| sb_OLTP_RO_1M-ps | mysql56 | noPFS |    32 | 149321.8889 |
+------------------+---------+-------+-------+-------------+
However, if we'll add now on it 2% in binary is compiled with PFS instrumentation, then another 1-2% if you enable only PFS (keeping instrumentation inactive, but able to be activated dynamically) -- then you're getting 4%-5% difference comparing to MySQL 5.5 which is having PFS disabled by default and bigger PFS overhead when enabled (that's why it's disabled by default in 5.5 ;-))
But then, would you refuse this gold mine of information which is proposing you PFS today in exchange of 5% in QPS?.. - Seems to me I have to present you some more detailed stuff here about every potential overhead in PFS to break last doubts if any ;-)) -- and don't forget that more you test PFS and report your problems - better it will be!
Let's get a look now on the OLTP_RW (Read-Write).
Low Level OLTP_RW Workloads |
Things are going slightly different on OLTP_RW:
- the gap is not so big as on OLTP_RO (I/O latency is coming in game too as we have writes)
- many parts of the new code are representing fixes just to do things right (so, just for that 5.6 is already better ;-))
- while there are still some areas in 5.6 which should be improved (see: Heavy I/O RW workloads limits in 5.6 - and work is in progress here, stay tuned)..
While again, even on this "small server" I'm still observing a slightly lower TPS (Commit/sec) here on 5.6 vs 5.5, then looking not just on the TPS numbers, but on details about OLTP_RW on both engines we can see the following:
OLTP_RW @32usr, 5.6 -vs- 5.5 :

Observations :
- as you can see, there is no drops on 5.6 in Commit/sec activity
- and Checkpoint Age is remaining much lower, still allowing a room against some unexpected activity spikes
- and to keep things stable, we're writing slightly more (as you can see from I/O activity graph)..
- you just see 5.6 improved Adaptive Flushing in action
- and just for this reason I'd migrate to 5.6 asap ;-))
While, of course, on a bigger server this workload will run way better on MySQL 5.6 (as you can see from the previous posts).
More in depth |
Let's now go more in depth, but with a bigger server - my lovely 32cores host. What is good with a bigger server that we're able to simulate small one with it as well, but have a room for different test configs ;-) By binding MySQL server and Sysbench binary to 8 or 16cores we may observe less or more what we may expect from an 8 or 16cores server..
NOTE: for the following tests MySQL binaries were compiled with PFS instrumentation, but PFS was turned off during the tests.
Observations :
-
On 8cores OLTP_RO, 4 or 8users :
-
the most hot functions on 5.5 are :
- ptr_compare_0( 4% )
- row_search_for_mysql( 3% )
-
and on 5.6 are :
- row_search_for_mysql( 3% )
- merge_sort_loop( 2% )
- merge_sort_with_buffer( 2% )
- interesting that my_hash_sort_simple() on this server is much lower (1.3% only)
- but 5.6 is still worse than 5.5..
-
the most hot functions on 5.5 are :
-
On 16cores OLTP_RO :
- 5.6 becomes better than 5.5 only since 16 or 32 concurrent users
- and this is as expected at least, because it's since this load level the first internal contention are appearing ;-)
-
On OLTP_RW 8 or 16cores :
- pretty similar barrier is here too..
- on 8cores 5.5 is up to 5% better than 5.6
- on 16cores 5.6 becomes better since 16 concurrent users
Few graphs so far:
OLTP_RO @8cores-HT :

OLTP_RO @16cores-HT :

OLTP_RO Point-Selects @8cores-HT :

OLTP_RO Point-Selects @16cores-HT :

OLTP_RW @8cores-HT :

OLTP_RW @16cores-HT :

OLTP_RW Updates-only @8cores-HT :

OLTP_RW Updates-only @16cores-HT :

So far :
- MySQL 5.6 showing here a direct speed-up if you have 16 (or more) CPU cores on your HW server and at least 16 concurrent user sessions..
- with a smaller amount of CPU cores (or concurrent user sessions) you may see the same or slightly lower QPS level on MySQL 5.6 comparing to 5.5, and if this difference with PFS turned off is still out-passing 5-10% -- file a bug, you're really hitting something abnormal ;-)
- in any case, even on a small server, you'll still get a benefit of the all other performance improvements coming with MySQL 5.6 (ex: stable writes, binlog group commit, etc. etc. etc. - the most complete lists by Rob and Peter)..
And, of course, work is continuing, so stay tuned ;-)
As well, I have yet more benchmark results that I'm planning to present and discuss during Percona MySQL Conference - so come to join us during 5.6 BoF, our talks, or just around a beer ;-) BTW, if you're still hesitating if you should attend this Conference.. - just trust me, you should! ;-)
Rgds,
-Dimitri