« July 2013 | Main | April 2013 »
Thursday, 30 May, 2013
MySQL Performance: Percona Live & Few Perf Stories..
It's now two.. three.. four weeks
since Percona MySQL Conference was finished.. - and there are still many
things and new ideas running in my mind inspired by this great MySQL
tech + community event (regardless many public holidays and spring
vacations in May (which is also the reason why I'm late with this
article ;-)). There was a lot of things to learn from others, tons of
stuff to share, and as well enjoy long and deep discussions with many
MySQL users/ hackers/ gurus/ mentors/ devs/ etc.. etc.. We were very
proud to speak about MySQL 5.6 GA during this conference, and also
present the first labs release of the future MySQL 5.7 version (and you
may already download and play with it, or compile yourself from sources
which are always here).. - don't miss presentation made by Tomas about
all MySQL Innovation
happening today @Oracle! And if MySQL 5.6 for today is the best MySQL
release ever, you can be sure we will yet more surprise you with MySQL
5.7, just trust me ;-))
My talk during this conference was about
MySQL 5.6 Performance, and I'd like to thank all who attended it - thank
you for your interest in MySQL and in what we're doing! There is yet
more to come, so stay tuned! ;-) My special thanks to Domas who was
seating in the first line and making me laugh all the time (while I'm
usually never taking things too seriously - with Domas it was yet more
easier ;-)). Well, you may find slides of my presentation on Percona
site or directly from here..
As
promised, I've also polled every person I've discussed with about most
important MySQL Performance problems they are meeting currently on their
production or dev environments.. - the results were very surprising:
- For majority of people their own "dev team" creating the most of their performance troubles ;-))
- Then there are many people having actually performance issues, but they are just not aware about ;-) -- my only advice here is very simple: use a right monitoring tool to see what is going on your system and your MySQL server..
- And there are many as well who are taking care about everything, so speaking to them I saw all our future problems, and what is great that we are already working on it ;-)
So, again, thanks to all! It was really amazing and very productive time! Hope to see you all again during MySQL Connect as well (and next Percona Conferences of course ;-))
Then, during any MySQL Conference it's really fun to collect many true stories related to MySQL history (specially from old MySQLers).. - it helps to better understand the whole story, who is right and who is wrong, and who you should blame and who you shouldn't.. - piece by piece you're obtaining a full picture of this huge puzzle.. Probably one day someone will take a time to write a book based on such memories and for sure it'll be a great and teachable reading ;-))
But well, let's stay focused on MySQL Performance, which is my primary interest ;-)) and it'll be pity to not to continue started recently a series of fun stories around MySQL, so I'd like to add also few more ones from me.. - and you'll see it's not an off-topic ;-))
MySQL Black Horse |
The story is starting on the time of MySQL 5.4 (the improved performance release of joined efforts from MySQL and Sun teams).. On that time there was not yet any useful instrumentation implemented within MySQL/InnoDB code, and finding and fixing sources of contentions and bottlenecks was yet more difficult task than today (thanks to Performance Schema, since version 5.5 MySQL internals became much more transparent ;-)) -- but on time of MySQL 5.4 such a finding was mostly based on the code analyze made by perf engineers, their expectations of "potential impact" of one or another code part, and then a patch with proposed "fix".. "Fixed" binary was then tested on various benchmarks to see if the effect was positive or not.. - and believe me, there was many right stuff rejected just because the test result was negative (while in fact fixing of one contention simply making sometimes another contention(s) more hot, making an overall result worse.. - while if we continue to dig in the same direction, we may fix further contention(s) as well, and finally fix a whole part of a problem!) - but on that time only "one shot" changes were accepted, and then again rejected, because a combination then of several supposed to be "right fixes" produced a negative result on benchmarks again (for a big surprise of all of us... ;-))
So, during that time we progressed "eyes widely closed" ;-)) and then, after some time of reflection, Mikael started to produce so called "perf builds" - tarballs of MySQL source code with various patches applied on it. There was in total over a hundred of perf builds, one more different than others.. - and I was happy to test them all on SPARC servers to compare and analyze them as in depth as on this time it was possible (we expected a lot from DTrace, but there was yet a need to add probes within the code to analyze "home made" lock and sync solutions implemented within Innodb)... So, comparing, analyzing, re-thinkingn and analyzing again was our "favorite" activity those days ;-))
The traces with test results on most of such perf builds you may still find within my blog articles during 2009 year. There were many builds the results I've published and they mostly looked promising... - But there was a one "special" perf build which results I've never published.. - on my tests it was way better in performance comparing to 5.4, but was rejected due some "unexpected behaviors".. I've called it "black horse" in my internal reports, and always tested it against any other proposed improvements in MySQL code. Even over a time we started to forget what exactly changes were applied within this build, I was still expecting than one day it'll drive us in a right direction ;-))
And this day happened! - it was during 5.5.4 development ;-) On that time MySQL and InnoDB code contained all kind of "goodies" supposed to improve performance a lot, but in fact it was still worse than our "famous black horse".. ;-)) - and once again we were out of ideas, I came back with "black horse" results and profiling pattern.. And this made Mikael thinking hard to try to remember what exactly we finally changed long time ago... - which is then resulted in impressive performance improvements we demonstrated on MySQL 5.5 ;-))
But what is amazing in the story that MySQL 5.5 is simply reached the "black horse" level.. - while only since MySQL 5.6 it was finally out-passed truly far away! ;-))
The very first NDB Benchmark |
Reading all recent MySQL Cluster related articles, specially by Stewart and Mikael, remaining me the story which was not mentioned by no one until now (while Mikael was, probably, the most directly concerned ;-)) The story was starting in February 2002 when the "MySQL Cluster" name was not yet even pronounced, and there was just "NDB Cluster" software developed by Alzato.. They came to Sun Benchmark Center to test it and demonstrate that NDB is able to reach 1M TPS (yes, 1M transactions per second!) on Read-Only workload and over 200K TPS on Read-Write.. It was yet 2002, and our biggest SPARC server on that time had only 72CPUs running on 900Mhz.. - and they planned to use specifically this one. However, regarding these high ambitions, all this testing looked like a full disaster.. But we wanted to help them as much as we can, so finally this testing arrived in my hands.. But I was yet far to imagine all dramatic events waited on me ;-))
So far, they started to install their NDB "software".. - and I'm calling it "software", because at this stage it was yet far from something that you'd call a "product".. - while in Benchmark Center I've got a habit to meet customers having something already properly working and mainly coming to understand their bottlenecks, to tune, and then improve yet more better a working code (or simply get an idea about HW sizing, etc..) - but the case of NDB was probably the "most fun" I've ever seen until that time.. - the code was so poor that the problem #1 initially was just to get it compiled properly! and then to avoid to crash with a core dump on a simple probe test.. ;-))
My disappointment was so big that it was impossible to hide it.. I've finally expressed it to Alzato by explaining that we're wasting our time debugging a crappy code instead to leave this powerful HW to other customers which are, opposite to NDB, having an already working stuff and just waiting for a platform availability to test it..
I'm skipping here all dramatic moments of the story, and will just say you that the most of NDB future was played here.. And a probability that there will be no future at all was really very high.. ;-))
But well, since the first days of our common work I've started to add into NDB code various event counters and collect live stats from NDB internals via my dim_STAT monitoring tool (which I've always used and continue to use it right now).. With such a monitoring we were able then to fix all crashes and core dumping first, and then understand all the bottlenecks present in the code!.. - combined with long discussions about NDB design and why the proposed code may work or will never work ;-)
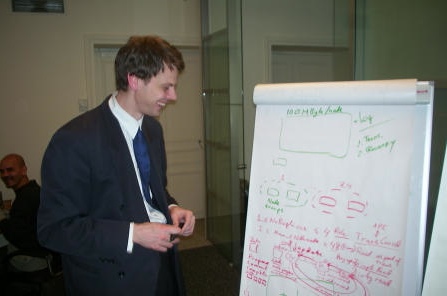
Here is a historic photo where yet 11 years younger Mikael trying to break my arguments why the NDB design is far from optimal ;-)
So, step by step, day by day we were able to improve performance more and more..
Here is the famous snapshot with dim_STAT graphs reflecting the reached TPS level:
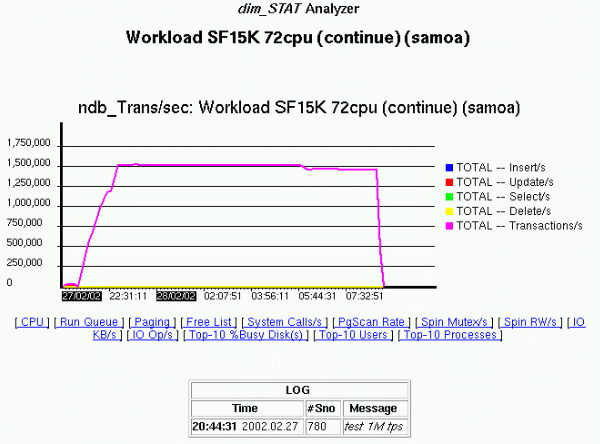
To be sure the result is not random and not hitting any regressions over a time, we left the test workload running more than 12 hours over a night.. - and as you can see from the graph, when in the morning we were back in the office, the test was still running and showing the same near 1.5M TPS result.. That was really amazing.. And I've expected that now by using all 72CPU of the server we'll beat all imagination levels with 2M or even 3M TPS (to be honest, from the beginning nobody really expected to see 1M TPS.. - this was like "top of all expectations", so showing 1.5M TPS was still a big surprise for everybody ;-))
So, what was a TPS limit when all 72CPUs are used?.. - for my big surprise this question remained without answer.. - the goal of 1M TPS was reached, and for Mikael the testing was finished.. - and the same day the whole team packed their baggages and left the office.. ;-))
Few years later Alzato was acquired by MySQL, and MySQL Cluster was born.. And today's over(!) 20M TPS obtained on MySQL Cluster even on Read+Write workload is no more a subject of surprise for anyone.. But the main performance victory in NDB milestones for me will be still these 1.5M TPS obtained 11 years ago in Paris ;-))
~/~
Over a time you're always finishing by realize that the most surprising stuff in the life is the life itself...
-Dimitri