Saturday, 30 December, 2017
dim_STAT v.9.0 CoreUpdate-17-12 is here !
Year is finishing, and as a kind of "end-of-year" gift, I'm happy to
announce that a freshy new CoreUpdate-17-12 is available from now
! ;-))
IMPORTANT : this is a very "sensible" update, and you
cannot just to apply it on the top of already deployed dim_STAT instance
as before.. -- there was a need to fix several issues within "under
hood" binaries to make the new stuff working properly, so the new code
has simply no chances to work with old binaries.. So far, I decided to
make it all as a "single shot move" -- align a new update shipment with
a moving to "64bit" versions support only :
- e.g. this is not a new version of dim_STAT
- this is just a "remastered" 64bit release + several visible and internal fixes
- any 32bit releases are remained "as it", and it makes no more sense to continue to support them..
- 64bit versions of dim_STAT v.9.0 are available for Linux and MacOSX (macOS)
- any further CoreUpdate will work only with 64bit version having the latest supported binaries..
So, what about this "new stuff" requiring such deep changes to go till the binaries remastering ?.. -- a very long story short, this is all about support of SVG images ! ;-)) -- I've started to develop dim_STAT exactly 20 years (!!) ago.. (hard to believe time is flying so fast..) -- initially dim_STAT used Java Applets (it was very lightweight (yes! it was so 20 years ago ;-)) and it was really cool, "live", etc.) -- but then Java support in a browser became only heavier and heavier, so I've added PNG images support (which could bring back the initial lightweight to dim_STAT and make it "usable" again ;-)) -- and today, things are changing again ;-)) -- "retina" and other "high resolution" screens become more an more popular, and on these screens my previously "good enough" PNG graphs are looking just "ugly" (to be polite ;-)). After testing and analyzing tons of various JS-based (or other) live graphing tools/libs, I've finally stopped my choice on SVG ! -- it's already supported by most of web browsers, still lightweight, and has a huge advantage -- it's extremely well "readable" !! and you can scale (!!) it very easily as much as you want ;-)) (so, no more color confusions and simply ugly graphics ;-))
An SVG graph is looking like this :

well, this is just a snapshot, but hope you already can get an idea about how much "more clean" your graphs could be ;-))
NOTE : some web browsers (for ex. FireFox) may require to not be limited in the "smallest" font size to draw SVG images correctly (as the text you see on your graphs is reproduced by your browser itself).
Now, few words about how SVG is integrated in dim_STAT :
- you have a new option for Graph image now : SVG (default)
- and in fact at any time you're selecting SVG or PNG -- your graph is generated in both formats on the same time
- however, the same image "size" may look differently in PNG vs SVG..
- for this reason there is an additional option : SVG Scale (which is x1.0 by default, but you may change it as you like)
- and most of dim_STAT "modules" are considering SVG option since now ;-))
So far, what is new in CoreUpdate-17-12 :
- SVG support !
- mandatory : remastered dim_STAT v.9.0 64bit version
- always generating PNG & SVG together
- SVG Scale option (web interface)
- default SVG Scale=1.0
- Snapshots :
- always containing PNG & SVG
- editing :
- allow image reordering by mouse dragging
- use SVG or PNG images according to what was recently used..
- redesigned Snapshots list :
- select criteria : Title pattern, order by time / title
- show all || first / last [N]
- option : show first N SVG/PNG images..
- option : show notes..
- click on title link involves snapshot editing
- redesigned Published Snapshots :
- have now also PNG and SVG document versions (HTML)
- HTML documents are now composed from first 2 images of each Snapshot + its notes, then <<More>> link is pointing on a full Snapshot page..
- PDF documents format remains the same (single document starting with a list of links to all included Snapshots)..
- Multi-Line stats :
- "CacheList" feature to speed-up names look-ups ! (generated once, then only re-used, can be re-generated again at any time on demand)
- allow bigger varchar limits for Add-On "name" collumn : 8/ 16/ 24/ 32/ 48/ 64/ 80/ 96/ 128
- Report Tool :
- you can now add Published Snapshots to your reports !
- code remastering / cleanup
- better / more accurate formatting
- remove external / java editors
- minor bug fixes..
- Bookmarks :
- Duplicate existing Preset
- Edit Preset (via checkbox list + reorder)
-
code remastering..
- STAT-service :
- STAT-service script now saves PID on start
- new commands: status, restart
- status : check if process with saved PID is running
- stop : call x.killSTAT with saved PID
- x.killSTAT : remaster to use CMD or PID
- restart : calls itself with stop, then start
- respecting chkconfig standard
- respecting LSB standard
- to setup under systemd :
- # ln -s /apps/STATsrv/STAT-service /etc/init.d
- # systemctl enable STAT-service
- # service STAT-service start
- # service STAT-service status
- # /apps/STATsrv/STAT-service status
- involving ALARM signal : ejecting on x10 Timeout non-activity period in all MySQL/ PG/ ORA scripts !!!
- => this could be very important in case when your monitored database engine becomes "frozen", but still continue to accept new connections..
- so dim_STAT will not see any stats coming from your database and suppose the connection was lost..
- and dim_STAT will then start a new stat command..
- which may still connect to your database, but not go any further, as database is frozen..
- and this may continue endless in loop every time once "connection timeout" is expired..
- and your server will get tons of stat commands started on its side and trying to collect some stats from your frozen database engine..
- so, to avoid this, each stat command is now having its own "non-activity alarm" -- if within x10 times Timeout period there was nothing collected from a given database, the stat command will self-eject by alarm event ;-))
- innodbMUTEX : advanced aggregation with tot@ / max@ / avg@ wait stats !
- Linux netLOAD_v2 : reports also MB/sec + fixed counters overflow
- Linux mysqlSTACK / ProcSTACK (based on quickstack from Yoshi (@FB))
- Linux mysqlCPU / ProcCPU (based on tiptop, not compatible with "perf", use with caution)
- Linux PerfCPUSTAT (based on "perf", reports CPU HW counters)
- Linux PerfSTAT_v2 (improved PerfSTAT)
- extended with Cycles/s numbers !!
- new option : -Event ... (ex: -Event cycles:u)
- EasySTAT :
- extended on Linux with : mysqlSTACK, mysqlCPU, netLOAD_v2, PerfCPUSTAT, PerfSTAT_v2
- now also auto-generating start/end log messages (to simplify post-analyze)
-
LoadDATA.sh is allowing now to pass args from command line (path
to BatchLOAD and DB name)
- General :
- Analyze Top-N values : choice => MIN/ MAX/ AVG/ 95% !
- export data in CSV format via Analyze page & dim_STAT-CLI
- tag LOG Messages with different colors according text pattern !
- on stat names checkbox => popup with note description (when available)
- improved auto-scaling Y-axe values according image size !
- improved default HTML style, re-look, etc.
- New Add-Ons & their Bookmarks :
- mysqlSTACK
- mysqlCPU
- ProcSTACK
- ProcCPU
- netLOAD_v2
- PerfCPUSTAT
- PerfSTAT_v2
- ...
- minor bug fixes..
Hope you'll enjoy all this new stuff as I'm already doing ;-))
For those who already using dim_STAT and want to preserve their collected data -- here are few simple steps to make the migration to the latest 64bit version smooth :
- first of all - no matter if you used 32bit version before, or 64bit (or SPARC, etc.), instructions are exactly the same
- however, even the version remains the same, we're moving to new remastered binaries..
- so the whole process is looking as "migration" (rather a simple CoreUpdate apply)
- (and if your data are critical, better to try you migration steps on another host first ;-))
- so far, let's suppose you already deployed dim_STAT into "/apps" on your host1
- 1) stop dim_STAT : # /apps/ADMIN/dim_STAT-Server stop
- 2) backup your whole (!!) database directory : /apps/mysql/data
- 3) if you created any Reports or Snapshots, then backup also the whole web server docs directory : /apps/httpd/home/docs
- 4) now on host2 install the latest 64bit dim_STAT version (supposing it'll be re-installed to the same default "/apps" path)
- 5) restore your "docs" backup into "/apps/httpd/home/docs" on host2
- 6) from your databases backup restore all to "/apps/mysql/data" on host2 except the following directories :
- /apps/mysql/data/mysql
- /apps/mysql/data/performance_schema
- /apps/mysql/data/dim_00
- 7) start dim_STAT on host2 : # /apps/ADMIN/dim_STAT-Server start
- 8) connect to your newly installed dim_STAT on host2 and check you can find all your previously collected data and created documents / snapshots..
- 9) if something is going odd.. -- then ping me back, let's see what is going wrong ;-))
- 10) if all is fine, then test if for a while, and once everything is really ok, then you're comfortable to migrate your host1 too ;-)) (and don't hesitate to ping me with good news too ;-))
Crossing fingers.. -- hope all will go just fine for you ;-))
And for the end.. -- there is yet "one more thing"..
This "one more thing" was inspired by observing many dim_STAT users doing some completely "unexpected things" (unexpected in my mind, but looking very "natural" for those who are doing) -- honestly, I'm really surprised by all use cases I've seen over past years (even users generating graphs via CLI commands involved from app servers and then grouping them into various documents, charts, etc.) -- but the most painful for me was to see users trying to involve "web oriented" actions in dim_STAT via curl, wget, etc.. -- this could bring to something wrong as there could be tons of options used within each POST/GET order, and all expected calls could be just broken after further CoreUpdates..
And to make your life more simple for such use cases, let me present you the REST-like Interface available since CoreUpdate-17-12 ! ;-))
dim_STAT-REST interface is supporting the following commands right now :
- DB_LIST -- list all available databases
- DB_CREATE -- create a new database
- HOST_LIST -- print current host list in database
- HOST_ADD -- add new hostname into host list in database
- HOST_STATS -- request the list of available STATS from host STAT-service
- COLLECT_LIST -- list all available STAT collects in database
- COLLECT_NEW -- create and start a New Collect in database
- COLLECT_STOP -- stop Active Collect(s) in database
- COLLECT_RESTART -- restart Stopped Collect(s) in database
- LOG_MESSAGE -- add a LOG Message to database
the output of each command is going in simple "pre-formatted" ASCII text, easy to parse and check.
Here is an example of "COLLECT_LIST" output :
==========================================================================================
 dim_STAT-REST (dim) v.1.0
==========================================================================================
 > CMD: COLLECT_LIST
  ----------------------------------------------------------------------------------------
      1 | goldgate     | -OFF- | 1998-12-18 16:28:27 |  15 sec. | Demo 1
      6 | test         | -OFF- | 2002-10-20 23:37:01 |  15 sec. | test
      7 | bezout       | -OFF- | 2003-06-26 13:46:51 |  30 sec. | test err
      9 | fidji        | -OFF- | 2003-09-17 13:23:12 |  10 sec. | test MPXIO + nocanput
     12 | test         | -OFF- | 2003-10-06 17:15:43 |  20 sec. | test MTB bug
     15 | localhost    | -OFF- | 2004-09-26 21:48:49 |  20 sec. | test
     16 | localhost    | -OFF- | 2004-09-26 21:51:59 |  20 sec. | test
     17 | gauss        | -OFF- | 2004-10-01 12:29:37 |  20 sec. | test RESTART
     18 | neel         | -OFF- | 2004-10-01 12:30:00 |  20 sec. | test RESTART
     19 | monod        | -OFF- | 2004-10-01 12:33:52 |  20 sec. | test RESTART
     20 | monod        | -OFF- | 2004-10-01 20:36:37 |  20 sec. | test RESTART
     21 | localhost    | -OFF- | 2004-10-12 20:30:51 |  15 sec. | test statOEE
     22 | dimitri      | -OFF- | 2007-01-21 21:06:43 |   5 sec. | test IObench
     23 | dimitri      | -OFF- | 2009-06-15 16:36:49 |  10 sec. | System Load...
  ----------------------------------------------------------------------------------------

 > OK
==========================================================================================
but I think more simple is to discover this all by yourself -- right now, try to execute the following command from your shell to test dim_STAT installed on your host2 (port 80) :
$ curl -L "http://host2:80/cgi-bin/WebX.mySQL/dim_STAT/x.REST"
this will print you the following help message :
==========================================================================================
 dim_STAT-REST (dim) v.1.0
==========================================================================================
 > Usage: curl -L "http://host2:80/cgi-bin/WebX.mySQL/dim_STAT/x.REST?CMD=Command[&..options..]"

    CMD=DB_LIST                    -- list all available databases

    CMD=DB_CREATE                  -- create a new database "Name"
      &DB=Name                        -- db name
      &Engine=InnoDB|MyISAM           -- db engine (InnoDB or MyISAM)
      &Passwd=password                -- optional password to protect admin actions

    CMD=HOST_LIST                  -- print current host list in database "Name"
      &DB=Name                        -- db name

    CMD=HOST_ADD                   -- add new hostname into host list in database "Name"
      &Host=hostname                  -- new hostname (format: [alias/]hostname[:Port])
      &DB=Name                        -- db name
      &RESET=1                        -- optionally: reset hostlist to empty

    CMD=HOST_STATS                 -- request the list of available STATS from host STAT-service
      &Host=hostname                  -- alias OR hostname (format: [alias/]hostname[:Port])
      &DB=Name                        -- db name

    CMD=COLLECT_LIST               -- list all available STAT collects in database "Name"
      &DB=Name                        -- db name

    CMD=LOG_MESSAGE                -- add a LOG Message to database "Name"
      &DB=Name                        -- db name
      &Message=text                   -- text message
      [&Host=hostname]                -- hostname (multiple Host args can be used)
      [&ID=id]                        -- Collect ID (multiple ID args can be used)
                                      * Host and ID are optional :
                                        > if ID is given : use provided ID(s) only
                                        > if no ID nor Host : add the message to all active collects
                                        > if only Host : add the message to active collects matching hostname(s)

    CMD=COLLECT_NEW                -- create and start a New Collect in database "Name"
      &DB=Name                        -- db name
      &Host=hostname                  -- hostname (only one Host can be user at time)
      &Timeout=Nsec                   -- STATs timeout in seconds
      &Title=title                    -- Collect title
      &STATS=list                     -- list of STATs to collect: stat1[,stat2[,stat3]...] or "all"
                                         all: means all STATs available from Host STAT-service
      [&LOG=filename]                 -- full filename of LOG file to watch
      [&Message=text]                 -- text message to log Collect start

    CMD=COLLECT_STOP               -- stop Active Collect(s) in database "Name"
      &DB=Name                        -- db name
      [&Message=text]                 -- text message to log on Collect(s) stop
      [&Host=hostname]                -- hostname (multiple Host args can be used)
      [&ID=id]                        -- Collect ID (multiple ID args can be used)
                                      * Host and ID are optional :
                                        > if ID is given : use provided ID(s) only
                                        > if no ID nor Host : stop all active collects
                                        > if only Host : stop active collects matching hostname(s)

    CMD=COLLECT_RESTART            -- restart Stopped Collect(s) in database "Name"
      &DB=Name                        -- db name
      [&Message=text]                 -- text message to log on Collect(s) restart
      [&Host=hostname]                -- hostname (multiple Host args can be used)
      [&ID=id]                        -- Collect ID (multiple ID args can be used)
                                      * Host and ID are optional :
                                        > if ID is given : use provided ID(s) only
                                        > if no ID nor Host : restart all recently stopped collects
                                        > if only Host : restart recently stopped collects matching hostname(s)

    ...
==========================================================================================

## ERROR:
=> CMD is not filled !!

==========================================================================================
while you can see there many options listed, there are many actions are simplified "by default" -- and to explain this, let me show you a simple use case of the whole workflow by example :
- you're starting a testing with say "Customer 1234"
- so, first you creating a dedicated database CU_1234_YourName
- (adding your name to dbname to be sure the name is unique ;-))
- then you adding to this database the hosts you're wanting to use (say: host_N1, host_N2, host_N3)
- (note: this also can be the same HW server, but running several STAT-services (each one for different db instance, etc.)
- once you're ready, you're :
- starting New Collect for host_N1
- starting New Collect for host_N2
- starting New Collect for host_N3
- NOTE: instead of building the list of stats you want to collect from your hosts, you can use "STATS=all" option, which will collect everything -- this could be dangerous (sometimes too much is too much ;-)) -- but you can easily limited "everything" to "just what you need" by editing the STAT-service "access" file (and leave uncommented there only the stats you'll really need) -- so, again, you can keep your own "pre-configured" STAT-service tarball, deploy & start it on your host(s) before any testings, and then in your scripts always use just "STATS=all" (regardless which system you're using and delegate it to your pre-defined STAT-service config ;-))
- after what, you can run your first test workload..
- your test script may contain in any place a command to send a Log Message
- NOTE: without mentioning any ID in the command, the Message will be automatically added to all currently active Collects !
- (so, in your scripts you even don't need to worry which exactly hosts are used, etc. -- all you need to know is the URL of your dim_STAT server and the dbname you're using ;-))
- supposing you got your first results, and now need a feedback from Customer/Dev about, so no more tests for the moment.. -- then you just involve COLLECT_STOP for your database
- NOTE: without any ID provided the command will stop all active collects within your database (so, no need to worry you forgot anyone ;-))
- then, few days later, you have more info, and need to run other tests within the same conditions and on the same hosts..
- so, all you need to do is just to involve COLLECT_RESTART command, and again, without any ID and by only giving DBNAME the tool will restart the latest most recent existing collects ;-))
- and in case you need to run some tests only on say "host_N2" => you then just giving "DB=CU_1234_YourName&Host=host_N2" and the tool will automatically find the most recently created Collect corresponding to "host_N2" and restart it !
- same, your test script continues to send Log Messages, and if the only host_N2 Collect is active during this time => then only host_N2 Collect will log them, and not other Collects ;-))
- and then again, but involving COLLECT_STOP with no ID, it'll stop all your running collects, no need to worry to miss any one of them ;-))
Well, don't hesitate to ping me if you need any more details !
That's all for the moment. As usual, all the stuff above is available for free download from my site :
- http://dimitrik.free.fr
Rgds,
-Dimitri
Tuesday, 17 January, 2017
dim_STAT v.9.0-u16-12 CoreUpdate is available !
I'm happy to announce the new CoreUpdate-16.12 for dim_STAT v9 is
available !! ;-))
in reality there were many small changes/fixes
made in the code over the past year, and I even started to include the
"month number" to numerate the update versions -- however, it was still
looking for me as "intermediate" steps, until reaching the "release"
level by the end of the year ;-)) However, the "releasing" itself of
this update took me much more time than expected, as I've started a
progressive move to deliver a fully 64bit stuff on all levels..
NOTE:
this is not about delivering a new dim_STAT version, but about a full
64bit re-packaging (with some binaries upgraded to a newer version,
while some are just recompiled in 64bit, etc.)) the first candidates are
Linux/x64 and MacOSX/x64 (or macOS) -- Solaris x64 and SPARC will come
later..
So far, what is new coming with this CoreUpdate ?..
While
there are many small changes (or code remastering), I'll like to bring
your attention to the following long awaited and key "visual" features: Graph
Bottom Label & Overlap Time Periods !.. ;-)
to
show both of them in action, let me do it by example :
so far, I
have a STATS collect in my dim_STAT instance, and I want to compare 2
test workloads together (in the current example OLTP_RW workload was
tested on MySQL 5.7, and in the first test InnoDB was configured with
trx_commit=1, and in the second trx_commit=2 (if you're not MySQL user,
no need to go to details, just keep in mind there were 2 tests executed
with different config parameters, and we're wanting to compare both of
them ;-))
for each executed test I have a logged detailed message
in dim_STAT, so it's easy to select the time period when each test was
started, so I'm just selecting corresponded LOG Messages for each test
and using "22min after the message" time interval, as you can see from
the following screenshot: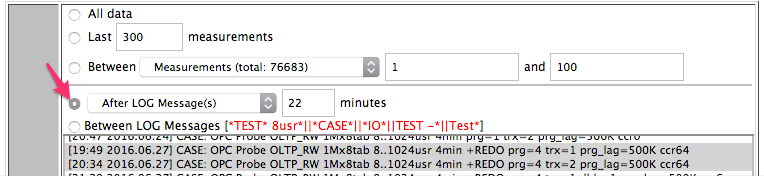
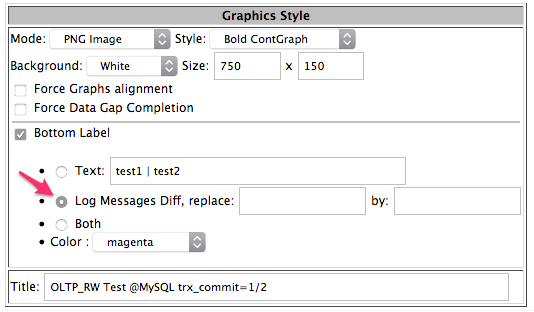
then,
as usually, I'm selecting corresponding Graph Style options and entering
the Title for generated graph(s):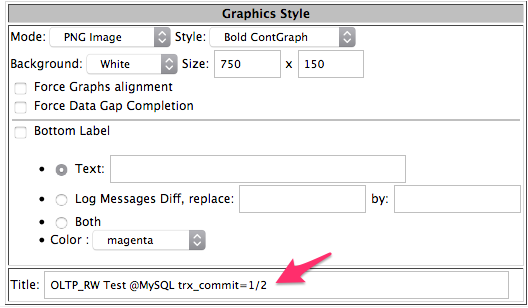
after
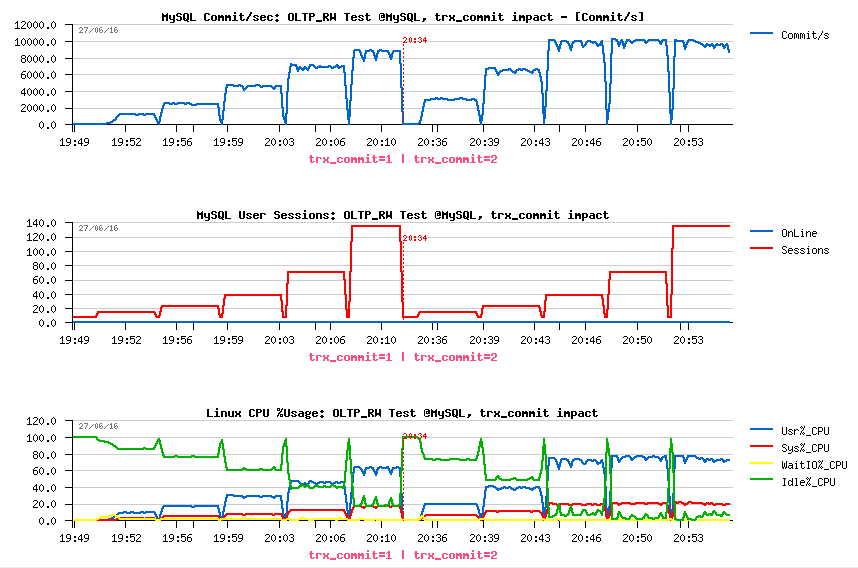
what I'm just selecting the STATs I want to see:
- MySQL Commit/sec
- MySQL Sessions
- CPU Usage%
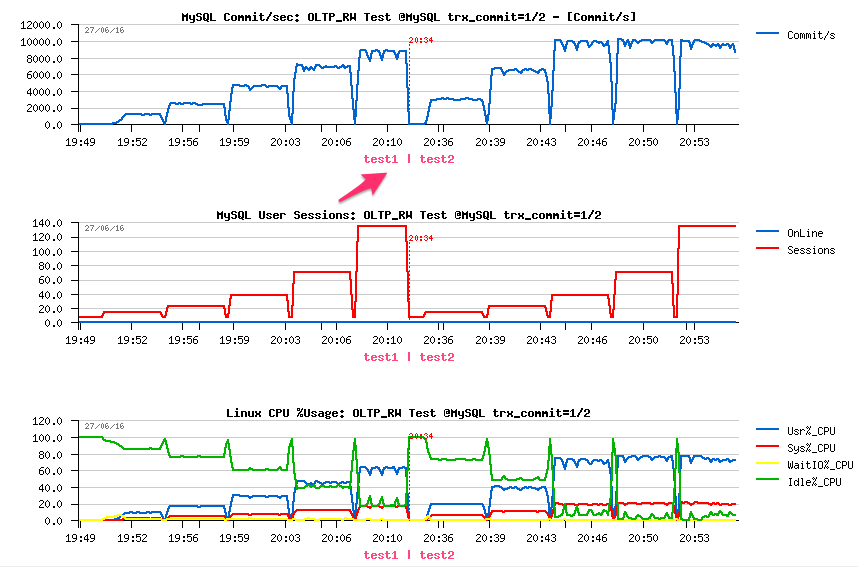
which is giving me the following graphs:
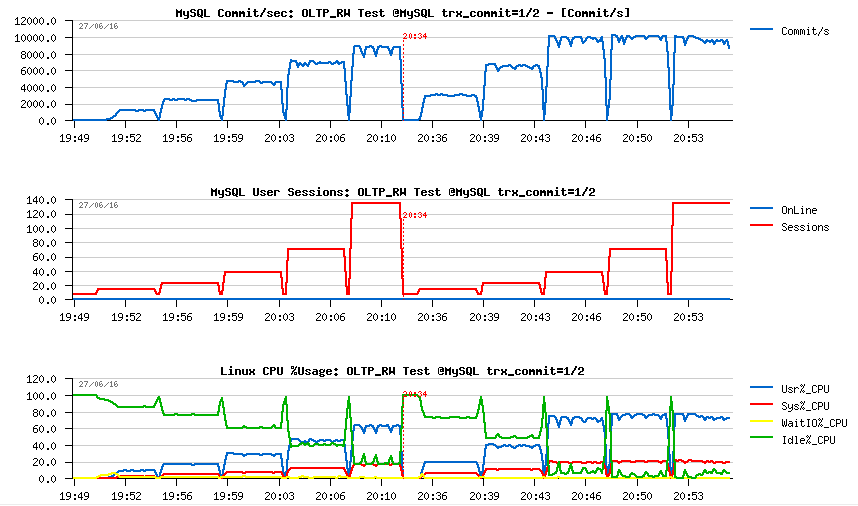
and as you can see, the only way until now to put any details about what I want to show on the graphs was to put all of them to the Title (or use some external image editing tools to annotate some parts of graphs, etc.)..
things are changing since the new CoreUpdate ;-))
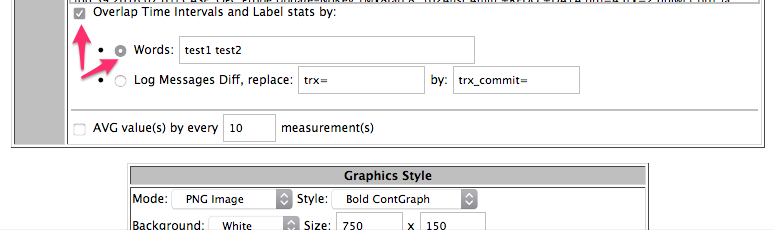
on the Graph Style form you can select now the "Bottom Label" to be placed on the graph, and enter explicit text to use or get the text "automagically" generated from the LOG Messages (in fact it'll be based on the difference present in the messages you're using, but lat's see it later)..
in the following example I'll just use a text "test1 | test2" :
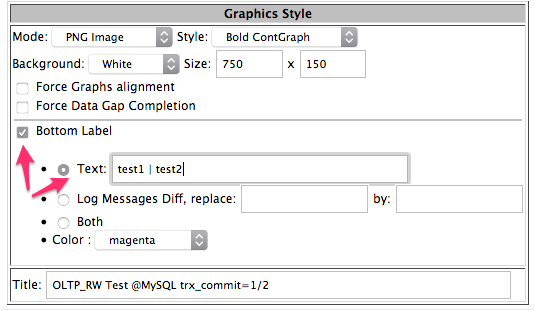
and you can see it immediately added to the bottom of all my graphs:
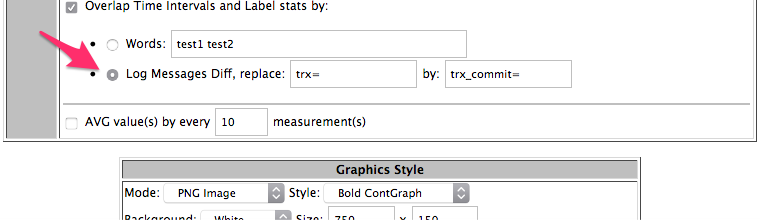
now, let's see what will be the result if I'll select the auto generated text from the LOG Messages difference :
all the graphs are now having the "trx=1 | trx=2" text on the bottom (and, indeed, the only difference between the messages I've selected from the beginning of this demo is "trx=1" vs "trx=2):
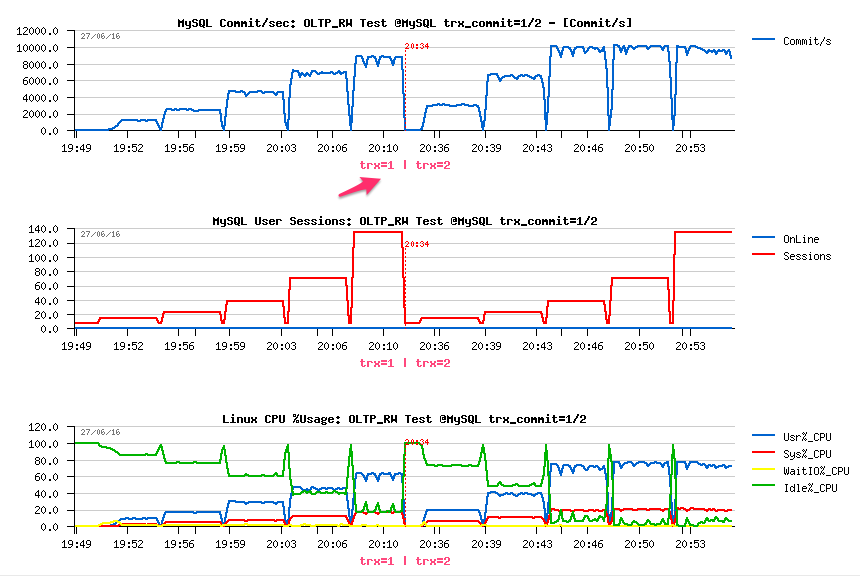
however, "trx" is just my own abbreviation to name "trx_commit" setting used in my test, so for a more "human friendly" graphs I'd rather prefer to show "trx_commit" instead ofr just "trx" ;-))
and this also can be automated via "replace" option:
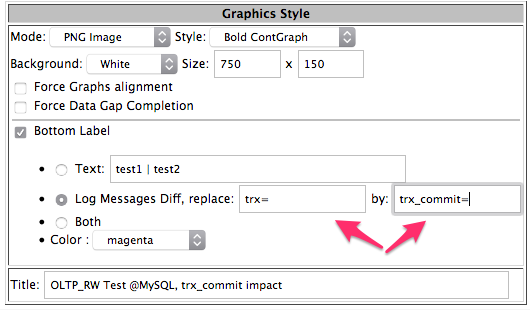
and we can see the expected result :
this was about the new "Bottom Label" feature! ;-))
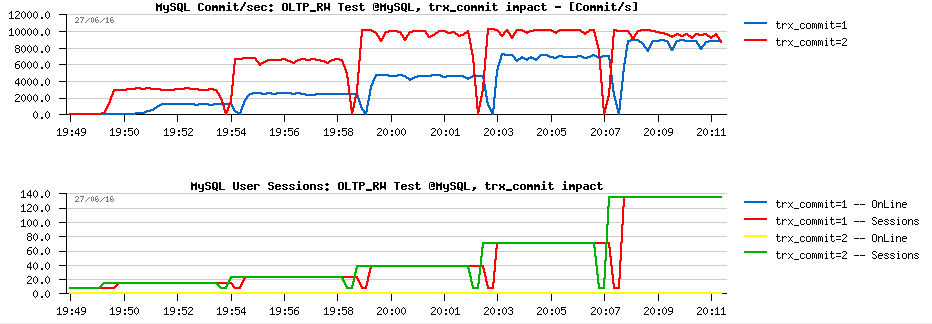
now, going more far, from a long time I wanted to be able to "combine" several workload stats from different time periods into a single graph, but not one-after-one (as you see it above), but rather one-on-another (e.g. to see the above MySQL Commit/sec graph on the same "scale", for a better "visibility").. -- and, indeed, this is also possible now sine the new CoreUpdate ! ;-))
you can select now the "Overlap Time" option and assign corresponding Labels to time periods - directly from the list of words, or again, "automagically" from the LOG Messages differences..
in the following example I'll assign "test1" to the first tested workload (trx_commit=1) and test2 to the second one (trx_commit=2):
as you can see from the following graphs, such a data representation can be much more "spelling" for result analyze (for ex. it clearly seen now how faster 10K TPS level is reached with trx_commit=2 settings (following the Sessions level )):
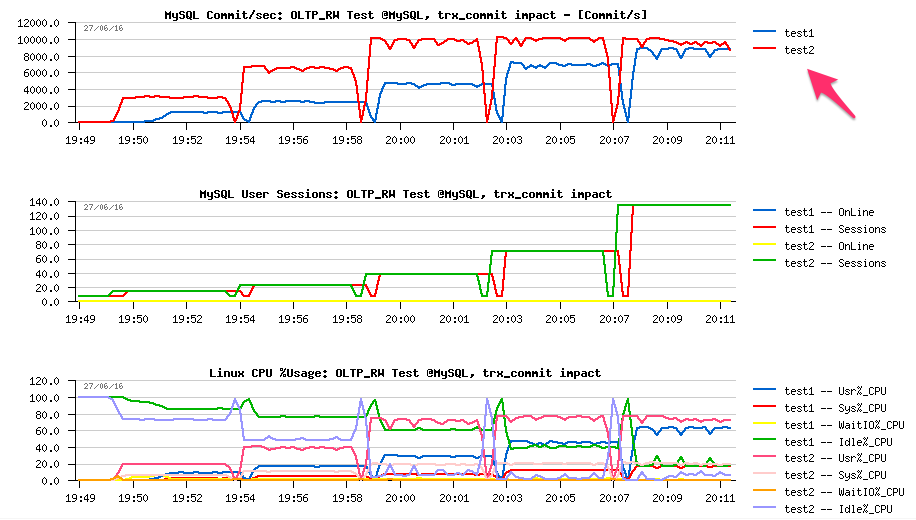
NOTE: however, you may see that the graph is more "readable" if only one single stats metric is used, and not many (e.g. Commit/sec graph is more readable than CPU Usage% :-)) -- so, it's always preferable to select only one stat when generating "overlapping" graphs..
and as in Bottom Label, an "automated" labeling can be obtained also from the LOG Messages as well :
and the result:
so, it was about "Bottom Label" and "Overlap Time Intervals" features.. -- let me know if it was clear enough, and don't hesitate to share your own experience ;-))
and there are few more thing in the new CoreUpdate as well related to Snapshots:
- you can now add new Snapshots to already "published" ones (e.g. keep all you need in a single document)
- you can re-edit a "published" document and now also re-order listed Snapshots in the document by holding your mouse ;-))
- any "published" document can be now also protected by password from accident editing by someone else ;-))
- once you're done with document editing, you can click on [Finish] button now and prohibit any further editing..
well, this is all about the new CoreUpdate where I wanted to bring your attention ;-))
you can download and install the latest CoreUpdate right now :
- dim_STAT v.9.0 CoreUpdate-16-12 .tgz
- yes, you can deploy it live, no need to stop anything on your dim_STAT host ;-)) => the instructions are the same as before.
the remastered 64bit versions for Linux and MacOSX can be found here:
- dim_STAT v.9.0 @Linux/x64 .tgz
- dim_STAT v.9.0 @MacOSX/x64 .tgz
NOTE: dim_STAT for Linux x64 now could be installed on most of latest Linux distros out-of-the-box (no any additional libs are required (well, crossing fingers ;-))
as well a short reminder about updated STAT-service tarballs for all the platforms:
New STAT-service rev.5.5 kit (Agent) Updated! (Dec.2016)
- Solaris10+/SPARC .tgz (Solaris 10+)
- Solaris10+/x86/x64 .tgz (Solaris 10+)
- Linux/x86/x64 .tgz (tested on: MEPIS, Debian, Ubuntu, openSUSE, Fedora, RHEL, OL, CentOS)
- Linux/x86/x64 + MySQL stats .tgz (same as above + MySQL stats already "pre-configured")
- Linux/x64 .tgz (full 64bit version, tested on: Ubuntu, RHEL, OL, CentOS - normally should "just work" on any recent Linux)
- Linux/x64 + MySQL stats .tgz (full 64bit version, same as above + MySQL stats already "pre-configured")
- MacOSX/x86 .tgz (tested on: MacOSX 10.6+)
- MacOSX/x64 .tgz (tested on: MacOSX 10.6+)
- NOTE : source code is included within each .tgz tarball
enjoy & have fun !..
and as usual, any feedback is welcome ! ;-))
Rgds,
-Dimitri
Saturday, 19 December, 2015
dim_STAT v.9.0-u15 CoreUpdate is ready !
The 2015 year is finishing, and I'm happy to present you the latest dim_STAT
v.9.0 CoreUpdate-15 (just on time ;-))
So, what is new ?
First
of all I'd like to tell you about the new experimental STAT-service
v.5.0 :
- the main difference in this version is coming with remastered code of the daemon
- now you're no more attached to the fixed /etc/STATsrv directory on your server
- you can install STAT-service anywhere you want ! ;-))
- this is resolving any situations when you don't have write permissions in /etc
- or simply need to monitor several database instances running in parallel on the same host
- now you may just duplicate your STAT-service instances into different directories and start them on different IP ports
- also, to simplify scripts management, STAT-service is publishing as environment variables its currently used home directory (as SRV_HOME) and IP port number (as SRV_PORT)
- you can use them in your scripts or config files to make their maintenance much more simple
- and yes, both variable are also considered within the access file as well
- while the name of the access file is now also configurable, so you can use different files according needs, etc.
- in parallel many bundled scripts are remastered and simplified
- all the stats you need to collect via EasySTAT for ex. now are moved to .env-easystat file
- for SysINFO - into .env-sysinfo
- so, you don't need to edit a big script file to change the list of your options, but just a small one, etc.
- also, to simplify configuration of connection setting for Oracle RDBMS, MySQL and PostgreSQL stats all related scripts are checking the corresponding .env-oracle, .env-mysql and .env-pgsql files -- so, just one file to edit to make all scripts working
- whenever possible, the scripts were remastered to avoid zero sleep time and unlimited sleep time due OS clock time changes or heavy system load..
- well, there was a lot of ile editing, that's why I'm calling this STAT-service version experimental, as it's still possible that I've missed something on one of the scripts ;-))
- STAT-service v.5.0 is available for Linux, Solaris 10+ SPARC and x64, MacOSX :
- NOTE: each tarball is also containing "src" directory with new STATsrv.c and STATcmd.c code -- just in case if you have any issues with new binaries on your systems, you may always recompile them yourself..
PerfSTAT
Analyzing performance problems on Linux I'm often needing a profiler, but rather a profiler with a low overhead ;-)) - the "perf" tool is pretty good for that, but I was missed from a long time live profiling collects saved directly into dim_STAT. Now it's fixed, and you can use this new PerfSTAT Add-On to see the top-N hot functions from various programs running on your system to understand what is really going odd.. -- in the following example I'm just analyzing from where the regressions are coming in different MySQL engines :
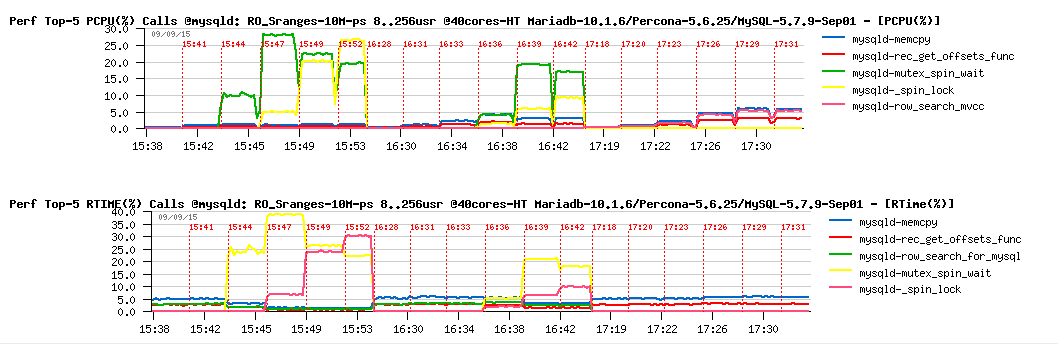
don't hesitate to try it yourself, you may discover very interesting things on your machines ;-))
Command Line Interface
I'm surprised how many people are using dim_STAT from the command line to generate various graphs for their reports or different workflows.. - so, I've extended then existing options/features yet more :
-
dim_STAT-CLI :
- there is a new "-Times" option to allow you to select several time intervals on the same graph T1-T2[,T3-T4[,..]]) similar as you do via web interface
- the "-RAW" option allows now to directly export raw stats data from your database
-
dim_STAT-Admin :
- delete ALL is now involving TRUNCATE on tables which is giving a really huge speed-up ;-))
-
dimSTAT-Server :
- there is now also a "start-force" option available to by-pass the situations when you're starting your dim_STAT instance for the first time and some database files are missed just because your database was not yet initialized..
Other changes & fixes
just to mention few more :
- you can now Backup and Restore your Bookmark Presets ;-))
- Bookmark IMPORT was improved to allow you better manage all bundled Add-Ons
- in case you're needing to collect very big numbers in your Add-Ons, there are new data types were added: Big-Integer and Big-Float
- any use of "/tmp" in the code for temporary files was removed, everywhere the TMP_DIR environment variable is used (it's configured when you're installing dim_STAT and saved within /opt/WebX/x.env file -- you may modify it at any time)
- the Log messages are better checked now for odd characters on entry (did not expect such, and don't know if it'll be enough ;-))
- and various other code remastering and minor fixes..
Hope you'll enjoy the new release! ;-))
The upgrade process is simple as usual :
- 0.) no need to stop anything, update can be applied live on your running dim_STAT instance ;-))
- 1.) download the latest tgz (WebX_apps-v90-u15.tgz) file from the CoreUpdates repository: http://dimitrik.free.fr/Core_Updates/
-
2.) backup your current apps scripts:
- $ cd /opt/WebX ; tar czf apps-bkp.tgz apps
-
3.) deploy the CoreUpdate-15 scripts bundle:
- $ cd /opt/WebX; tar xzf /path/to/WebX_apps-v90-u15.tgz
- 4.) enjoy ;-)
As usually, any feedback is welcome!
Rgds,
-Dimitri
Saturday, 12 July, 2014
dim_STAT v.9.0-u14 Core Update is here!
I'm happy to present you the latest CoreUpdate-14 for dim_STAT
v.9.0 !
This update includes many minor fixes and small
improvements making life better (like few more options on CLI scripts,
more smart logic on dim_STAT-Server start/stop, few more options in web
interface, updated look & feel, etc. etc.) - well, all these changes are
inspired by my own and many other users daily usage of this tool. So,
indeed, it remains alive and still helpful ;-)
However, there is
a completely new feature I'd present to you which is coming with
CoreUpdate-14 - and it's calling "Snapshots" ;-)
What
are Snapshots? - in fact this feature was inspired by a more and more
often need to save somewhere all or most of the graphs I'm seeing right
now, while analyzing collecting data, rather generate them later when
the work is done and observed issue was solved.. ReportTool is great for
the post-analyze work, or for a straight forward reporting, etc. (you
know exactly the time intervals you want to see, stats to graph, and so
on) -- while during a live performance analyze you may have many
intermediate graphs you're looking on which are part of the whole story
board during your investigation, and they are all important as well as
the base of your step-by-step logic and your final conclusion..
So
far, Snapshots :
- at any time you see any PNG graphs on your dim_STAT web page you'll also a small [Snapshot] button on the bottom of the page
- as soon as you click on [Snapshot] button a new Tab/Window will be opened within your web browser and containing all the graphs you're currently seeing + the 2 special fields: Title and Notes to allow you to add some annotations related to your graphs (as well you may select all the graphs or only a part of them)..
- similar to ReportTool, the wiki-style syntax is allowed within Notes content, while HTML syntax is also allowed (see details from the dim_STAT UsersGuide)
- once editing is finished, you click on [Save] and your given Snapshot is saved
- each Snapshot has a [PermaLink] (a static URL link you may use to share your Snapshot page with any users having an access to your dim_STAT web server)
- at any time you may re-edit your Snapshot once again, or duplicate it to make a different version (ex.: less graphs, shorter Notes, etc.)
- you can delete Snapshots as well, but be careful - there is no restore ;-)
- also, Snapshots data are partially saved within your database, so they are depending on it, and from one database you cannot access Snapshots of another one (except you're clicking on a [PremaLink], but this will just print you a static document, without any editing possibility)..
The Snapshots page is looking like that:

So, at any time you may select to see :
- the latest N Screenshots
- the Screenshots matching a Title pattern and ordered by Time or Title, Ascending or Descending..
- link to [PermaLink] is pointing to a URL with a static page with Snapshot content
- link to [tar.Z] is pointing to a compressed TAR archive containing the whole Snapshot data (so can be sent as it and then deployed on any other computer as an HTML document)..
Publishing Snapshots :
- at any time one or several Snapshots may be selected for publishing
- a published document is then no more depending on a database, has its own Title and Notes, and containing all the data from the selected Snapshots
- once generated, a published document will have as well its own [PermaLink] and [tar.Z], but also a [PDF] link as sometimes sharing a PDF document may be more preferable ;-)
- the published document may still be re-edited in place (then PDF and tar.Z will be re-generated on every Save)
- keep in mind that all data of a published document are kept only locally within its own directory and nowhere else (nothing in database, etc.) - so, re-editing is really implemented in place and based on content files
- saving a document under a different title will create a new document leaving the original as it
- re-editing can be disabled for a given document if its directory contains a file with a name ".noedit"
- re-editing of all published documents may be disabled globally if the "pub" (upper) directory contains ".noedit" file
- there is no way to delete a published document via a web interface (and this is made intentionally, as all "published" is expected to remain forever) -- while of course you may delete it manually, all these documents are just simple files after all.. ;-))
Few comments about internals :
- as soon as you're involving any Snapshot action, there will be created a missed dim_Snapshot table in your current database and additional directories on your dim_STAT web server (/apps/httpd/home/docs/Snapshots/*)
- Snapshot path: /apps/httpd/home/docs/Snapshots/data/{DBNAME}/{Snapshot-ID}
- Published Document path: /apps/httpd/home/docs/Snapshots/pub/{Title}
Well, it's much more fun to use Snapshots than speak about, so hope you'll adapt it very quickly and and enjoy as me ;-)
The upgrade process is as usual :
- 1.) download the latest tgz (WebX_apps-v90-u14.tgz) file from the CoreUpdates repository: http://dimitrik.free.fr/Core_Updates/
- 2.) backup your current apps scripts: $ cd /opt/WebX ; tar czf apps-bkp.tgz apps
- 3.) deploy the CoreUpdate-14 scripts bundle: $ cd /opt/WebX; tar xzf /path/to/WebX_apps-v90-u14.tgz
- 4.) enjoy ;-)
As usually, any feedback is welcome!
Thursday, 31 October, 2013
dim_STAT v.9.0-u13 Core Update (Halloween Edition ;-))
This is a special Halloween Edition of dim_STAT Core Update-13 available (as it's Update #13 it was hard to resist to not ship it exactly for Halloween day ;-))

The Update contains all the goodies from the #12 version plus "one more thing" ;-)
- Bookmark Presets are now introduced to the Multi-Host too (extended or not)
- And also directly accessible from the full Bookmark list on a Single-Host Analyze a well - you should be able to see all your preferred graphs within a one single click now ;-)
- Presets can be removed now and extended (you may at any time add any new Bookmark(s) to existing Preset)
- and just for fun, there is a possibility now to include a customized "welcome" message on the dim_STAT Home Page -- the code is testing for a presence of the "welcome.html" file in the /opt/WebX/apps/dim_STAT directory.. - and it exists, it'll be automatically included within a Home Page (in case you want to add some guide lines to your users, instructions, daily message - up to you ;-))
The installation instructions are exactly the same as before, except that I was too paranoid in the past with Core Updates when it was yet experimental ;-)) -- in fact you don't need to stop dim_STAT Server to apply a Core Update.. - you can do it live without any problem ;-)) (and I'm doing it every time on my servers) -- however, before to upgrade, don't forget to backup your existing /opt/WebX/apps content!!! (we never know ;-))
Enjoy!
Rgds,
-Dimitri
Wednesday, 11 September, 2013
dim_STAT v.9.0-u12 Core Update
I've realized that over a time I'm adding more and more small changes to the "core" scripts of dim_STAT, while completely forgetting to share them with others on a regular basis ;-) So, here is my current v.9.0-u12 tarball (.tgz) containing all the changes I've added during last 2 years.. (and other updates you may find as well in the dedicated Core Updates Repository )..
In fact I'm continuing the idea of experimental Core Update I've tried in the past which is worked very well (and works for now too) -- to apply the Core Update you should be running the v.9.0 of dim_STAT (whatever update), and just follow the same instructions as before:
-
stop dim_STAT server:
# /apps/ADMIN/dim_STAT-Server stop -
untar the .tgz archive file containing Core Update scripts :
# cd /opt/WebX
# tar xzf /path/to/tgz
-
restart dim_STAT server :
# /apps/ADMIN/dim_STAT-Server star - enjoy! ;-))
To be honest, I don't really remember today all the changes I've made.. ;-)
But from the most notable last ones which people asked several times are:
-
dim_STAT-Server script now has few more improvements/features:
> option -RESTART flag -- where flag can be: auto, no, yes, force (def: auto) -- to better manage STAT collects restart on the server start-up..
> option -SLEEP sec -- to sleep few seconds between STAT collect restarts and avoid "activity waves" (def: 2)
> if STAT collect restart is required, dim_STAT-Server will wait until MySQL database become available (in case there is some recovery process in progress or something else).. -- this will ensure STAT collects restart in this case
-
Bookmark Presets : as over a time you may have more and more
created Bookmarks for various STATs within your dim_STAT server, it
become more and more painful to find the right ones from the long list
+ select them.. Then Bookmark Presets may help you here -- just go to
the Home->Bookmarks page, select some of Bookmarks you're mostly
using, and than save this selection as a Preset (naming it as you like
+ clicking on the "Save" on the bottom of the page).. This new name
then will appear on the Analyze page just right near the [Bookmarks]
button, and with a single click on it you'll get a list of Bookmarks
only placed by yourself into corresponding Preset ;-) You may create
as many Bookmark Presets as you like, for any kind of your needs
(however I intentionally did not add the "remove" functionality to not
have a complete solution, while creating a Preset with existing name
will replace the old one by the new one)..
- Configurable colors in PNG Graphs : you may now use your own colors for PNG graphs via Preferences interface (while always may revert to the initial default colors at any time).. Time to time people are complaining that some colors are not very visible on white or black background.. - so, now you may experiment by yourself how easy graphs may be readable or not ;-)
Any required additional tables in the database to support these features are created automatically, so you don't need to do anything. However I did not add any interface to export or import these data.. - you may do it on the database level very easily if you need it..
So far, this a compromise solution I've found to keep your dim_STAT installation under GPL and just update time to time core scripts.. - let me know if it worked for you ;-)
Rgds,
-Dimitri
Tuesday, 25 September, 2012
MySQL Performance: Collecting stats from your workload
Pretty often I was asked by many people about solutions I'm using while analyzing MySQL performance issues and generating various graphs presented in my reports and blog posts.. - Well, I've always used and continue to use dim_STAT - the tool I'm developing myself since 15 years now, and which is freely available on this site :-) The tool is mainly collecting any kind of stats from the system and applications, and then giving you a way to analyze them live or later via web interface - nothing new now days, but well, I have my habits, like to play with collected data and want to know exactly what I'm analyzing ;-)) (while many of you are using other tools, including a really excellent MySQL Enterprise Monitor, and it's all ok for me too - as in my mind changes are coming only since people become unhappy with what they have, or hitting some limitations, etc.) -- personally, I'm pretty happy, and wish you the same ;-))
But I have a small problem -- I'm very curious by problematic workloads (and already started a call for workload scenarios this year, and many thanks to all who answered) -- but now I'm also very interested by workload stats, specially if you're trying MySQL 5.6 and hitting some unexpected performance issues on your system ;-)
- provide a connect info for your MySQL instance (user/password/host:port)
- check some system libs are not missed on your system to run my binaries (and install few missed if any)
- collect stats with 10sec interval during your workload
- send me the result
- be sure your database is running ;-)
- be sure MySQL access via IP is not protected by your firewall
- be sure MySQL is listening on the IP port you've configured
- be sure user/password pair is correct..
- goto 1. and debug ;-)
- innodb_monitor_enable = '%'
- performance_schema=ON
-
performance_schema_instrument='%=on'
-
and once MySQL is started, execute the following SQL statements to
enable mutexes and I/O instrumentation only (if you don't need any
other):
- use performance_schema;
- update setup_consumers set enabled = 'no';
- update setup_consumers set enabled = 'yes' where name like '%instr%';
- update setup_instruments set enabled = 'no', timed = 'no';
- update setup_instruments set enabled = 'yes', timed = 'yes' where name like '%wait/synch%';
- update setup_instruments set enabled = 'yes', timed = 'yes' where name like '%wait/io/file%';
Sunday, 21 August, 2011
dim_STAT v.9.0 is here!
-
Create a new Database
-
Convert existing Database to another Storage Engine
-
Backup a whole Database
-
Export STAT Collect(s)
-
Import STAT Collect(s)
-
Recycle STAT Collect(s)
dim_STAT v.9.0 is shipped with a "remastered" MySQL v.5.5.15 Community Edition (GPL) - it's different from the "official" MySQL 5.5 by being more compacted (all debug and test stuff is removed) and compiled in way to have less dependencies to work just out-of-the-box if possible (for ex: on Linux you'll not need AIO library, etc.). The configuration parameters are mostly present within "my.conf" file, all settings are just minimal to not use too much RAM or disk space. On the firs start InnoDB data and log files will be created, but you may adjust the settings later.. Well, my goal was to ship a compact and just working MySQL with dim_STAT, but feel free to replace it by any other MySQL version! ;-)
Another new stuff coming with v.9.0 is an experimental dim_STAT for MacOSX ! :-)) I've preferred to share it rather just enjoy to use it alone on my Mac ;-)) However, I did not yet fully tested it as I don't have (yet) another Mac ;-)) and don't want to spend any time to install MacOSX in VM.. - if somebody will want to use it on Mac I'll have first news very quickly ;-)) if no - another reason to not spend too much time on MacOSX distro ;-))
Then there is a huge list of "internal" improvements which will say you nothing, but will greatly improve your usual work with dim_STAT ;-)
But main "visible" new features are:
-
simplified INSTALL process (and I hope you'll feel it since the
first installation ;-))
-
MySQL regular expressions can be used now within Multi-Line
stats to enforce name criteria..
-
name filter is added into all Multi-Line pages to be able to
reduce the list of names when it's too long and simplify selection on
ly of the names you need..
-
value distribution graph is now working not only with Java
Applet, but with PNG too..
-
for any stats while drawing some data you may also (or instead) draw a sum
of all selected values (ex: Usr% and Sys% CPU Usage as CPU Busy%)..
-
absolutely amazing Multi-Host Bookmarks ! - gives you a way to
analyze several hosts in parallel in more advanced way: you're
analyzing stats within a Single-Host mode first, applying all criteria
you need (ex. seeking only for "oracle" and "sqlplus" processes CPU
Usage, and then saving the obtained graph as Multi-Host Bookmark, and
after with a one click analyzing the same graph but with many hosts
within Multi-Host mode ;-)) (NOTE: don't forget that only one stat
value is allowed to be presented on the Multi-Host graphs, if you're
drawing more than one value on your graph - the Multi-Host Bookmark
option will not be presented..)
-
dim_STAT-CLI is now able also to draw Multi-Host graphs if
several Collect IDs are given in argument (-ID id1,id2,id3,..)
-
Export is now have a time interval option in case you need to
export a particular part of your Collect rather the whole collected
data..
-
STAT-service is now also reporting when the connection was lost
with a server or a stat command closed it's pipe (possible abnormal
finish), as well such messages are appearing in errors on the Web
interface..
-
by default any non-system stats are disabled (commented) now
within STAT-service - I was surprised how many users are mostly
clicking on all available stats and making troubles on their systems
(for ex. involving DTrace for non-existing stuff, etc.) - since v.9.0
you have to enable it manually by editing /etc/STATsrv/access file
(which is supposing that user is aware of the changes ;-))
-
HAR2 for Solaris 10 was updated to version 2.1 (thanks to ISV
team! ;-))
-
LioSTAT_v10 (iostat v.10) was introduced to Linux stats (seems
to work better with recent Linux distros)..
-
mysqlSTAT was updated/improved
-
innodbMETRICS was introduced (still experimental) - allows to
monitor InnoDB METRICS table within MySQL 5.6
-
oraASMIO was introduced to monitor I/O activity via ASM on
Oracle RDBMS (including Exadata ;-))
-
Add-On management was yet more simplified and improved, and
since now you're also able to re-edit any of your Add-On descriptions
directly via Web interface!! ;-))
- etc..
NOTE: the STAT-service packages are no more shipped within dim_STAT distribution to avoid file duplication within each tarball, however they are always freely available for download from the site (or directly from the STAT-service space). I've also removed .pkg files for Solaris as creating them all the time is quite painful process, while .tgz remains the same for all platforms and protect me from forgetting some of files within a .pkg list ;-))
Well, there are many other still visible, but minor features (some details I've also explained in the previous post about a Core Upgrade.), but I'll avoid to list them here and leave you to discover them yourself ;-)) There are also many other features I've planned to ship with v.9.0, but it was urgent for me to ship the new version as soon as possible, so my main priority was focuses on the most "critical" features related to MySQL 5.5 adoption and general usability (like Multi-Host Bookmarks and dim_STAT-Admin). My goal is matched now, event it took me a major time of my week-ends and vacations during last 6 months ;-)) but there was an urgency because since next week I'll become a "true" Oracle employee, and I prefer to suspend any new dim_STAT development since now to avoid any potential conflicts regarding software proprietary (or until any changes will come in situation).. - shipping v.9.0 today on the remaining conditions gives me a satisfaction point for over 14 years of development ;-)) and it was hard as well to suspend my developments without shipping v.9.0 before.. ;-))
So far, there is still missing Solaris 10 x64 version (did not have an access to a needed server on time, so sol10-x86 version will come later ;-)) and Solaris 8 /SPARC is missed too as I don't have an old enough server available around me, so cannot guarantee the dim_STAT v.9.0 will come later for it and don't know if there is any need.. - a simple PC is now faster than a very old SPARC, so using a simple Linux box makes more sense now days ;-))
However, I hope to still be able to continue support of dim_STAT (and fix bugs if any), just only new features will be suspended until a new order ;-))
Friday, 08 July, 2011
dim_STAT: Experimental Core Upgrade v9-dev1
As there were several users expressed to see dim_STAT v.9.0 improvements before than the "official" release will be available, I've decided to ship a "Core Upgrade" - a current scripts version corresponding to the "v9-dev1" level. This upgrade is experimental, and even if I'm applying all these changes on our LAB servers on regular basis it still doesn't mean it'll work as well for everybody :-))
So, before to involve any deployment of Core Upgrade, please do a backup of your currently installed scripts.
NOTE:
- the upgrade is only applicable if you're running the latest "official" dim_STAT version! (currently v.8.5)
- the upgrade is platform independent as it'll change scripts only, so doesn't matter if you're running dim_STAT on Linux or Solaris :-)
- as well I'm always taking care about a backward compatibility, so no one from new features requiring any new tables in database, etc. (and even when it's really required, all missed stuff will be created automatically on demand by the tool itself)..
So far, following are the instructions about upgrade installation (default directory names are used below):
-
First of all, stop your dim_STAT server:
# /apps/ADMIN/dim_STAT-Server stop
-
Backup your current core scripts:
# cd /opt/WebX
# tar czf /MyBackup/WebX_apps-backup.tgz apps
-
Deploy downloaded Core Upgrade v9-dev1:
# cd /opt/WebX
# tar xzf /PathTo/WebX_apps-v9-dev1.tgz
-
Start dim_STAT server:
# /apps/ADMIN/dim_STAT-Server start
- Enjoy! ;-))
Well, I very hope there will be no issues and you'll really enjoy new features rather restore old scripts from your backup :-)) but in case you have some problems - follow the same steps, but don't do the backup again and just restore your backup instead of Core Upgrade deployment..
However, let's hope it'll be OK and you're ready now to discover new features ;-))
Of course, there are many features that you'll be not able to see because they are related to the internals and general code improvements.. - probably you'll feel that the same tasks will run faster, don't know, as the true changes will come with a final v.9.0 running on MySQL 5.5 :-)
But here is the list of the new features or fixes that you'll see for sure:
-
fixed: Extended Multi-Host analyzing is now working to draw graphs
even if no Mutli-Host stats were selected!
-
fixed: Date tags on graphs are no more mixed if the time interval is
too wide (several weeks or more)!
-
Error messages are now logged in case when the communication was lost
with a STAT-service from an active collect!
-
Regular expressions are used now for name selection criteria in
multi-line stats!
-
List of names within multi-line stats have now a Filter option (to
reduce the list size and simplify per name selection)!
-
On Multi-Host Analyze is possible to show a SUM/AVG values for all
hosts together via Group by Name option and use 0 in the Name length!
-
Data Distribution graph is now working not only with Java Applet
option, but with PNG drawing too!
-
For any values you want to present on the graph you may now choose
also to present the SUM of all these values (or just the SUM instead)
- it helps in many cases when you need to analyze the totals! (for ex.
for CPU% usage to see the Sys%, Usr% and Sys% + Usr% on the same time;
or I/O Read/sec, Write/sec, and Read+Write/sec; etc.)
-
And then the most exciting feature - Multi-Host Bookmarks!! ;-)
Why Multi-Host Bookmarks? - it was quite painful to not have the same flexibility on the Multi-Host Analyzing as on the Single-Host. Specially when you're interesting, for example, not just on a global CPU usage on several hosts, but on CPU usage of some particular processes (ex. oracle). In this case you may make a specific Bookmark by selecting only Oracle processes names (as filter) and CPU% Usage within ProcLOAD (for ex.) and then apply it on the Multi-Host Analyze! :-)) Same if you're looking on particular list of storage devices (ex. only those on c0 and c4 controllers) and want to graph their activity from several hosts and on the same graph (rather the SUM of all devices) - now it'll be possible! :-)
How can you create a Multi-Host Bookmark? - just keep in mind that you can bring only one single value to show it on the Multi-Host activity graph! - in case of single-line stats (ex. vmstat) it may be any value (ex. free memory), in case of multi-line (ex. iostat) it can be only an aggregate (SUM/AVG/etc.) as it should result in a single value at the end. And then this value is presented on the same graph for every host name. So, just keep it in mind when you're doing a Single-Host Analyze, and once your graph is ready, as usual you'll see a field on the bottom of the page to Save Graph as Bookmark, except that now there will be an option to save it as Single-Host or Multi-Host Bookmark :-) The option for a Multi-Host Bookmark is appearing only if you're drawing only a single value on your Graph and not using Host-related criteria (top-10 disks, etc.), as only "generic" criteria will be allowed (name mask, value conditions, etc.).. Well, it's longer to tell rather to try :-))
Where Multi-Host Bookmarks can be used? - everywhere ;-)) Well, currently they are mixed with "classic" Multi-Host stats, but with a time I'm expecting to transform all Multi-Host stats into Multi-Host Bookmarks (and let me know what do you think about) - Bookmark naming is way more flexible comparing to auto-generated ones for SUM/AVG/etc :-) And since upgrade you'll be able to use Multi-Host Bookmarks in:
- Multi-Host Analyze (as expected ;-))
- Report Tool
- dim_STAT-CLI - yes!! ;-)) - you can now give a list of IDs like "-ID 2,3,4,5" and in this case Multi-Host Bookmarks will be used instead ;-) and as well you may use by Host Name Grouping via "-Group Aggr:Len" where Aggr is the Aggregation operation (SUM/AVG/MAX/MIN) and Len is the length of the first N characters in the Host name by which you have to group your data. For ex. "-Group SUM:4" will group data by the first 4 letters in the name of your Hosts and draw the SUM of them (very useful if you have so many hosts that a single host activity is not really important, and you have rather to analyze groups of hosts (and as you may rename hosts as you want via Preferences, it's easy to choose naming which will well match your future grouping ;-))
Well, enough said, it's time to try it now! :-))
The link is here: Core
Upgrade-v9-dev1 .
If this experiment will be successful, I'll continue to ship similar Core Upgrades in the future to avoid a long wait for the next final versions and have more reactive bug fixing (if any) and new feature availability as well ;-))
Any comments are welcome!
Rgds,
-Dimitri
Monday, 03 May, 2010
MySQL Performance: Improving Stability
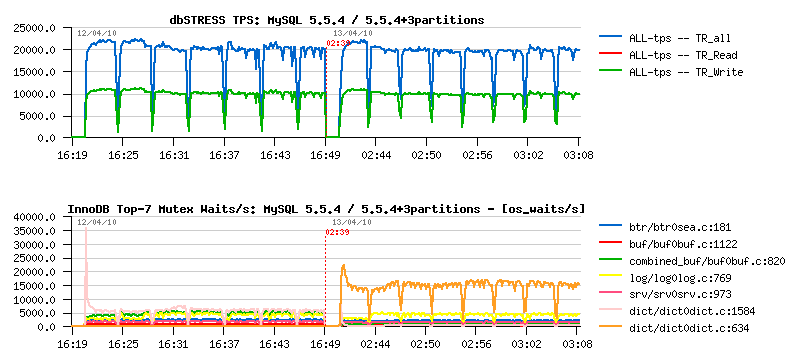
Huge performance improvement was came with MySQL 5.5.4, and looking on the following picture it's very easy to see why:
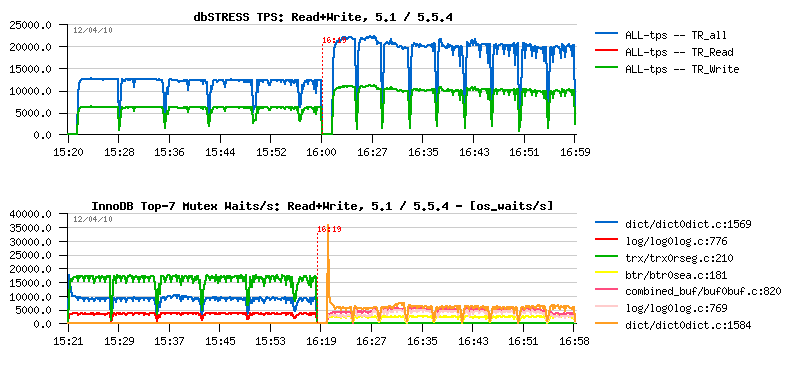
It's a one hour Read+Write dbSTRESS workload with 32 sessions running non-stop on 16 cores server. The left part of the picture corresponds to MySQL 5.1 activity, and the right one to MySQL 5.5.4. The first graph represents TPS levels, and the second one - the mutex waits observed during each test.
Even without going in details you may see how dramatically were reduced mutex waits! And I would say one of the greatest InnoDB features was a compact presentation of the "show innodb mutex" output which gave the way to monitor InnoDB more in depth and understand its contentions on each workload! - it's still not perfect, but anyway a big step ahead :-) and helped a lot to improve 5.5.4.
From the mutex waits graph you may see that the most hot "visible" contention now is on the index mutex (well, the output "file:line" is probably better for debugging rather a normal use - it's one of the things to improve here, just to be more human friendly and show a mutex name instead, as well the code is already there and require a small format changes)..
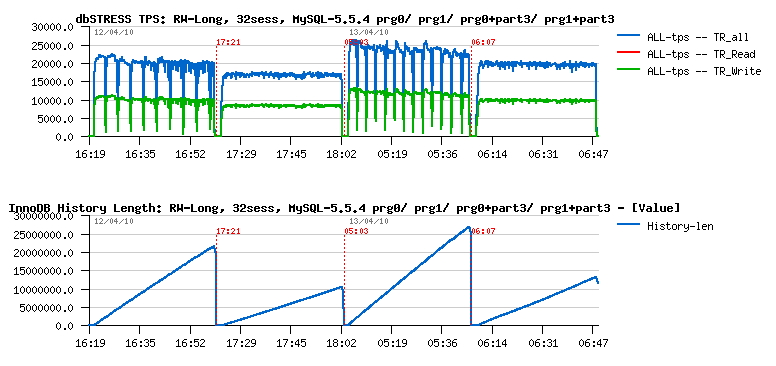
From the other side, purge lagging is another problem - you may see the same (apples to apples) workload on MySQL 5.1, MySQL 5.5.4 and XtraDB 9.1:
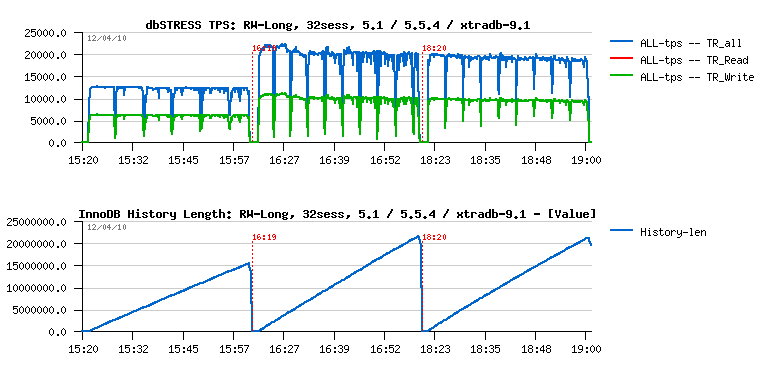
The first graph is still representing the TPS level, and it's interesting to see the potential performance gap between 5.5.4 and XtraDB during the first 10-15 min of test (and if we stop the test here we'll simply miss the next problem and will not see decreasing performance with a time on both engines due purge lagging..). The second graph represents the InnoDB history length, and as you may see it's growing now even faster than before! :-) And the problem is supposed to be fixed with a purge thread.. But let's get a look on one problem at a time :-)
Index Mutex Contention
It'll be great just to get it fixed ;-) But as you know, an simple way to reduce contention on a single mutex is to split this mutex into several ones (so you'll split your contention too, and instead of having say a one single session working at a time - you'll have several sessions working, etc.). And currently MySQL has a nice feature - PARTITIONS! :-) By using partitions on a table having index mutex contentions will simply split this contention by number of partitions! (for example using 3 partitions will physically split your table into 3 tables (even you'll still see it as a single one), and instead of one index mutex you'll have 3 mutexes as well dividing your contention by 3 probably too :-))
However on the next picture you may see the performance impact on 5.5.4 by using 3 partitions on the hottest table during the same Read+Write workload as before:
As you may see, curiously TPS level did not change... And we may suppose that partitions would not help here if we did not have improved mutex status within InnoDB and did not see there is another mutex waits jumped to the top and become more hot once we used 3 partitions! (while index mutex was really readuced! - that's why monitoring is so important :-))
What about this new mutex waits? - this is a dictionary lock on stats update. The fix was already proposed by Percona, and is not yet present in the current 5.5.4 tree - but as it's just a one line changes I've tried to see what if it'll be done on 5.5.4:
As you can see, the TPS level is improved! (over 20% gain!), and the main "visible" mutex waits are now on the redo logs - which may probably be considered as expected contention for a database in general :-)
But where we're with a history length now?..
Purge Lagging
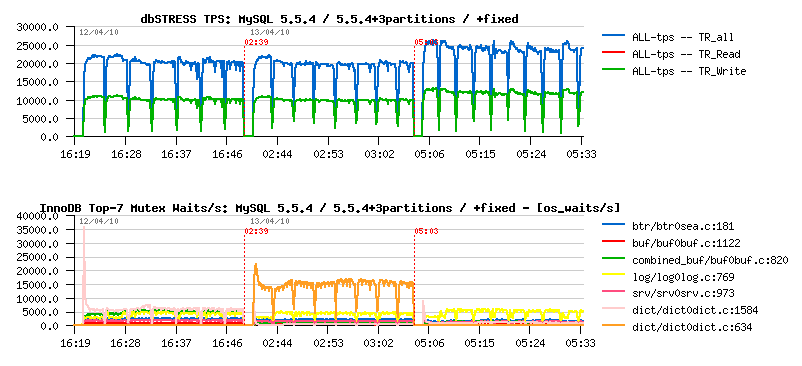
Now let's get a look on the same workload but from the stability perspective.. Having constantly growing history length is not normal and quite dangerous! As well having periodic performance drops is not better too :-) And the Purge Thread feature is the answer here. But let's look in details how it'll help - the following picture represents the same workload tested on:
- MySQL 5.5.4
- MySQL 5.5.4 +purge thread
- MySQL 5.5.4 +3 partitions
- MySQL 5.5.4 +3 partitions +purge thread
The first graph is TPS, the second one is History length:
As you may see, Purge Thread brings an important stability to the workload. However a single purge thread is no more enough to follow a purge demand here!..
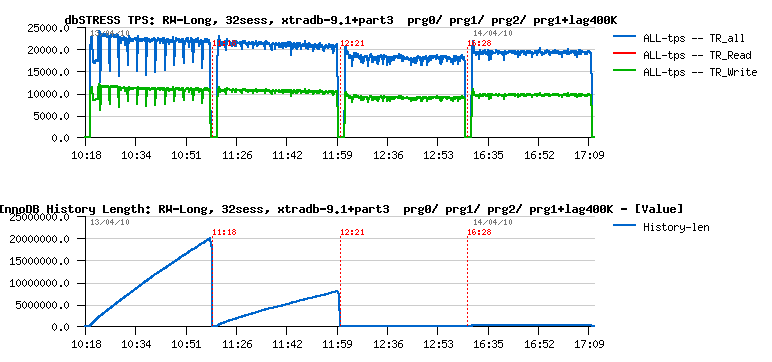
Currently 5.5.4 implementation allows only one purge thread for the moment. But to analyze a performance impact we may try XtraDB which already allows several purge threads. The following picture represents the same Read+Write workload running on XtraDB 9.1 using 3 partitions and tested:
- without purge thread
- with 1 purge thread
- with 2 purge threads
The first graph represents TPS level, and the second one History length:
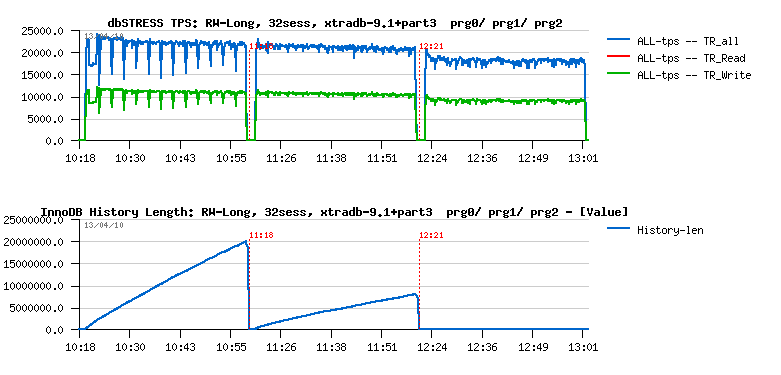
As you may see having 2 purge threads are completely removing purge lagging here! However it's also significantly reducing performance..
Can do we better here?.. - let's try ;-)
For a long time InnoDB has a purge lag configuration option - you can limit purge lagging with innodb_max_purge_lag by setting it to some acceptable level of History length, then once this limit will be reached InnoDB will slightly slow down all arriving DML queries by doing a short sleep (few ms) before processing a query statement. The feature itself is not bad, and many file systems are having a similar solution to throttle a high demand write requests. The only problem with InnoDB purge lag feature that it's broken seems to me, and I've explained why and how to fix it . Now if I apply the fix to XtraDB and see the result ;-)
What I'm interesting here is to compare:
- single purge thread + fixed purge lag
- two purge threads
Of course fixed purge lag without purge thread cannot give us a stable result due all missed maintenance work missed by Master thread (as explained in the previous post ). However, having one purge thread and throttling writes via max purge lag setting may still give a better result than having 2 purge threads..
On the following picture you may see the same Read+Write workload running on XtraDB 9.1 and now comparing:
- XtraDB without purge thread
- XtraDB with a single purge thread
- XtraDB with 2 purge threads
- XtraDB with a single purge thread + fixed max purge lag
The innodb_max_purge_lag was set to 400K here:
As you see, the tandem of single purge thread + fixed purge lag gives a better result here than 2 purge threads - TPS level is higher while History length is constantly kept under 400K! :-)
Why on my point of view such a solution will be more optimal?
- in many cases one purge thread will be probably just enough
- however when it'll be not enough - your server will still be protected by the max purge lag setting!
As always, many things depends on workload, and your experience may be different of mine.. - but tests and observations will be done, better MySQL performance will be with a time :-)
Any comments are welcome! ;-)