« My slides about MySQL Performance from Oracle OpenWorld Sep.2016 (#OOW2016) | Main | MySQL Performance: 8.0-dev Progress.. »
Tuesday, 17 January, 2017
dim_STAT v.9.0-u16-12 CoreUpdate is available !
I'm happy to announce the new CoreUpdate-16.12 for dim_STAT v9 is
available !! ;-))
in reality there were many small changes/fixes
made in the code over the past year, and I even started to include the
"month number" to numerate the update versions -- however, it was still
looking for me as "intermediate" steps, until reaching the "release"
level by the end of the year ;-)) However, the "releasing" itself of
this update took me much more time than expected, as I've started a
progressive move to deliver a fully 64bit stuff on all levels..
NOTE:
this is not about delivering a new dim_STAT version, but about a full
64bit re-packaging (with some binaries upgraded to a newer version,
while some are just recompiled in 64bit, etc.)) the first candidates are
Linux/x64 and MacOSX/x64 (or macOS) -- Solaris x64 and SPARC will come
later..
So far, what is new coming with this CoreUpdate ?..
While
there are many small changes (or code remastering), I'll like to bring
your attention to the following long awaited and key "visual" features: Graph
Bottom Label & Overlap Time Periods !.. ;-)
to
show both of them in action, let me do it by example :
so far, I
have a STATS collect in my dim_STAT instance, and I want to compare 2
test workloads together (in the current example OLTP_RW workload was
tested on MySQL 5.7, and in the first test InnoDB was configured with
trx_commit=1, and in the second trx_commit=2 (if you're not MySQL user,
no need to go to details, just keep in mind there were 2 tests executed
with different config parameters, and we're wanting to compare both of
them ;-))
for each executed test I have a logged detailed message
in dim_STAT, so it's easy to select the time period when each test was
started, so I'm just selecting corresponded LOG Messages for each test
and using "22min after the message" time interval, as you can see from
the following screenshot: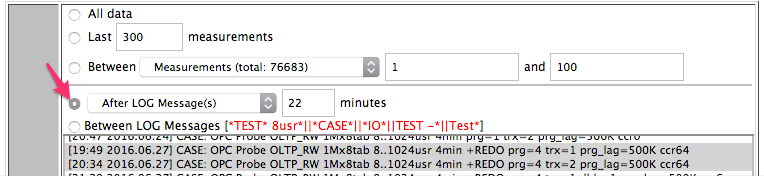
then,
as usually, I'm selecting corresponding Graph Style options and entering
the Title for generated graph(s):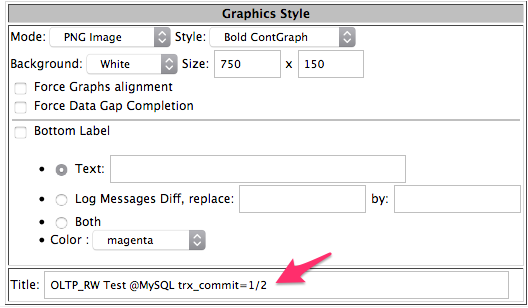
after
what I'm just selecting the STATs I want to see:
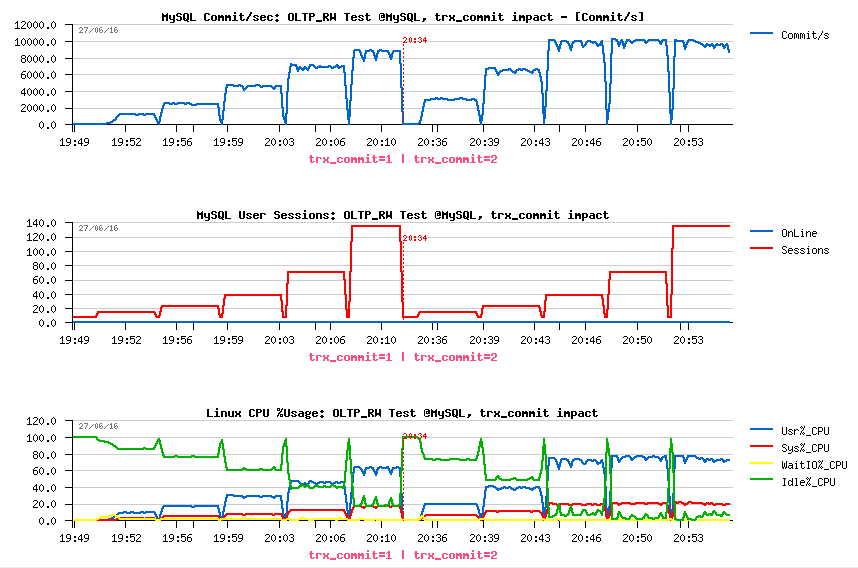
- MySQL Commit/sec
- MySQL Sessions
- CPU Usage%
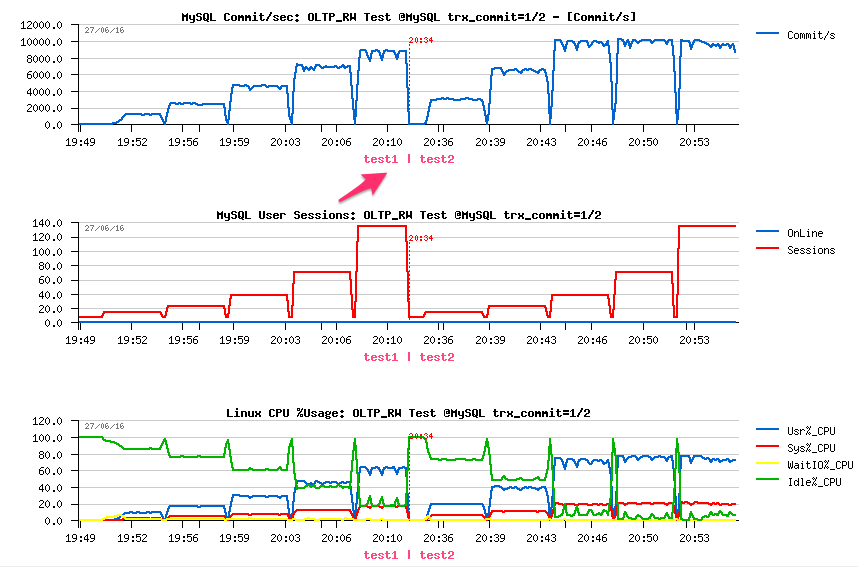
which is giving me the following graphs:
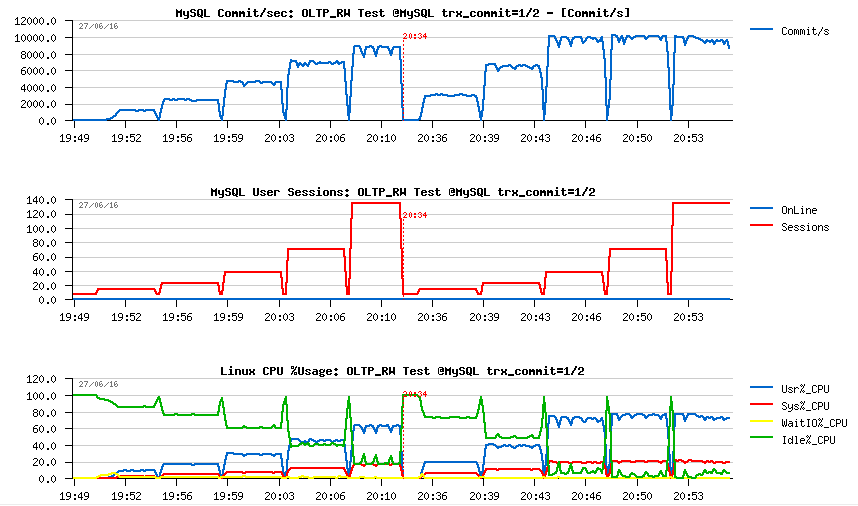
and as you can see, the only way until now to put any details about what I want to show on the graphs was to put all of them to the Title (or use some external image editing tools to annotate some parts of graphs, etc.)..
things are changing since the new CoreUpdate ;-))
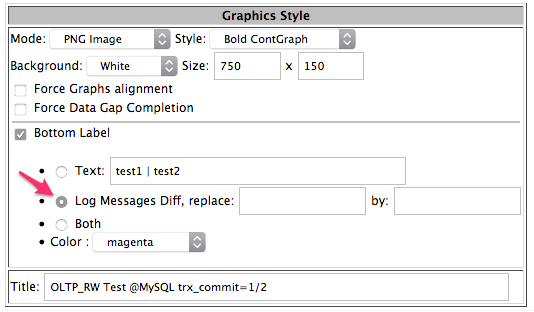
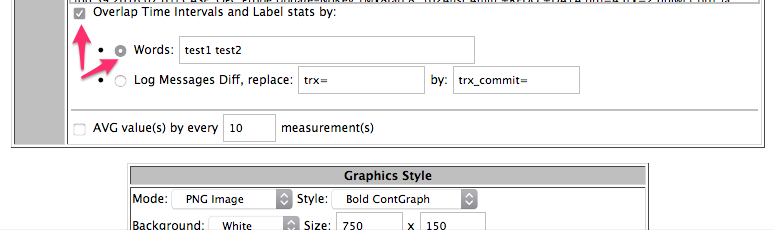
on the Graph Style form you can select now the "Bottom Label" to be placed on the graph, and enter explicit text to use or get the text "automagically" generated from the LOG Messages (in fact it'll be based on the difference present in the messages you're using, but lat's see it later)..
in the following example I'll just use a text "test1 | test2" :
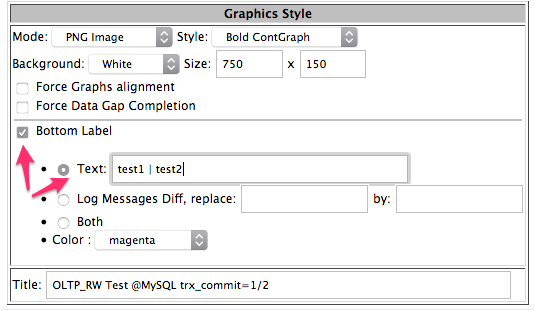
and you can see it immediately added to the bottom of all my graphs:
now, let's see what will be the result if I'll select the auto generated text from the LOG Messages difference :
all the graphs are now having the "trx=1 | trx=2" text on the bottom (and, indeed, the only difference between the messages I've selected from the beginning of this demo is "trx=1" vs "trx=2):
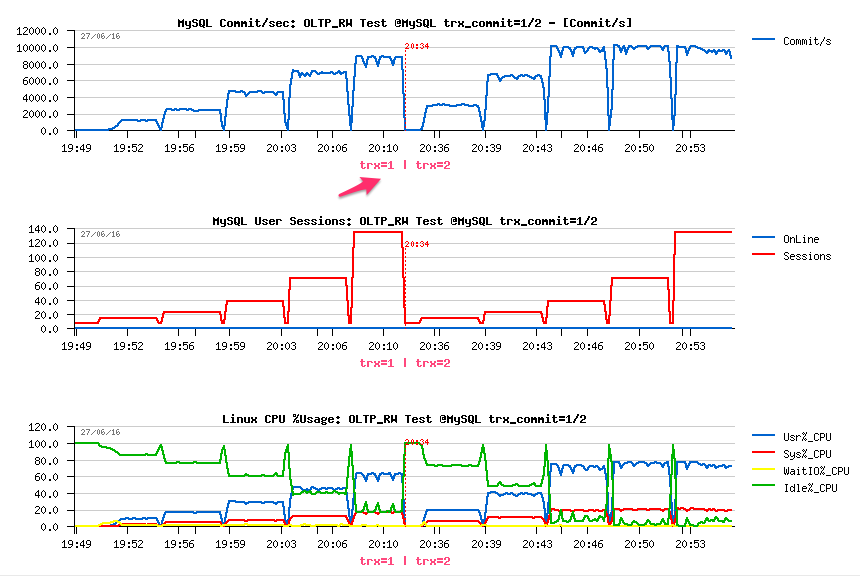
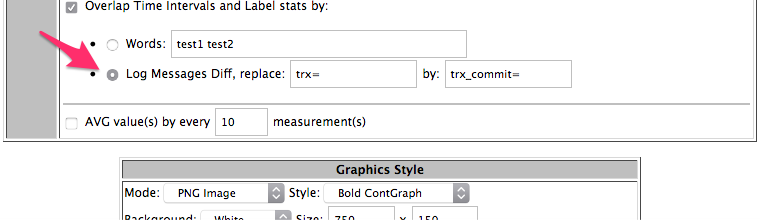
however, "trx" is just my own abbreviation to name "trx_commit" setting used in my test, so for a more "human friendly" graphs I'd rather prefer to show "trx_commit" instead ofr just "trx" ;-))
and this also can be automated via "replace" option:
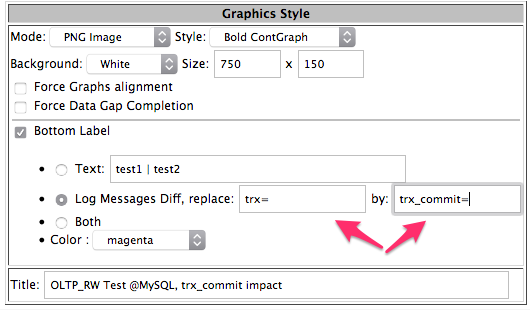
and we can see the expected result :
this was about the new "Bottom Label" feature! ;-))
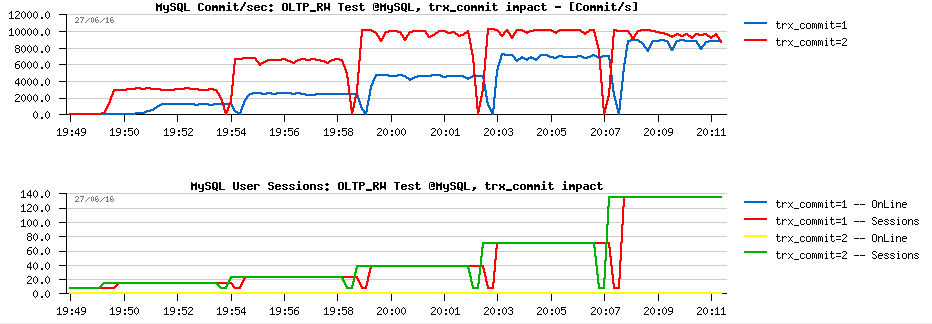
now, going more far, from a long time I wanted to be able to "combine" several workload stats from different time periods into a single graph, but not one-after-one (as you see it above), but rather one-on-another (e.g. to see the above MySQL Commit/sec graph on the same "scale", for a better "visibility").. -- and, indeed, this is also possible now sine the new CoreUpdate ! ;-))
you can select now the "Overlap Time" option and assign corresponding Labels to time periods - directly from the list of words, or again, "automagically" from the LOG Messages differences..
in the following example I'll assign "test1" to the first tested workload (trx_commit=1) and test2 to the second one (trx_commit=2):
as you can see from the following graphs, such a data representation can be much more "spelling" for result analyze (for ex. it clearly seen now how faster 10K TPS level is reached with trx_commit=2 settings (following the Sessions level )):
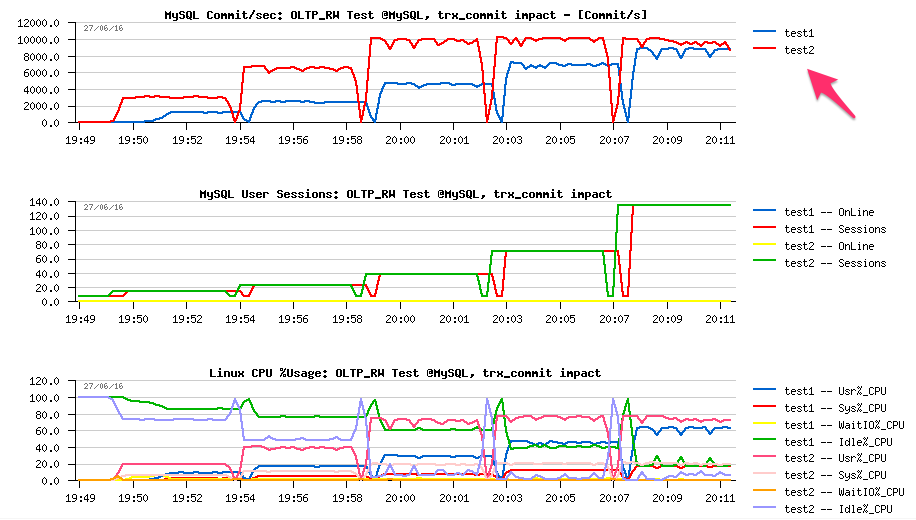
NOTE: however, you may see that the graph is more "readable" if only one single stats metric is used, and not many (e.g. Commit/sec graph is more readable than CPU Usage% :-)) -- so, it's always preferable to select only one stat when generating "overlapping" graphs..
and as in Bottom Label, an "automated" labeling can be obtained also from the LOG Messages as well :
and the result:
so, it was about "Bottom Label" and "Overlap Time Intervals" features.. -- let me know if it was clear enough, and don't hesitate to share your own experience ;-))
and there are few more thing in the new CoreUpdate as well related to Snapshots:
- you can now add new Snapshots to already "published" ones (e.g. keep all you need in a single document)
- you can re-edit a "published" document and now also re-order listed Snapshots in the document by holding your mouse ;-))
- any "published" document can be now also protected by password from accident editing by someone else ;-))
- once you're done with document editing, you can click on [Finish] button now and prohibit any further editing..
well, this is all about the new CoreUpdate where I wanted to bring your attention ;-))
you can download and install the latest CoreUpdate right now :
- dim_STAT v.9.0 CoreUpdate-16-12 .tgz
- yes, you can deploy it live, no need to stop anything on your dim_STAT host ;-)) => the instructions are the same as before.
the remastered 64bit versions for Linux and MacOSX can be found here:
- dim_STAT v.9.0 @Linux/x64 .tgz
- dim_STAT v.9.0 @MacOSX/x64 .tgz
NOTE: dim_STAT for Linux x64 now could be installed on most of latest Linux distros out-of-the-box (no any additional libs are required (well, crossing fingers ;-))
as well a short reminder about updated STAT-service tarballs for all the platforms:
New STAT-service rev.5.5 kit (Agent) Updated! (Dec.2016)
- Solaris10+/SPARC .tgz (Solaris 10+)
- Solaris10+/x86/x64 .tgz (Solaris 10+)
- Linux/x86/x64 .tgz (tested on: MEPIS, Debian, Ubuntu, openSUSE, Fedora, RHEL, OL, CentOS)
- Linux/x86/x64 + MySQL stats .tgz (same as above + MySQL stats already "pre-configured")
- Linux/x64 .tgz (full 64bit version, tested on: Ubuntu, RHEL, OL, CentOS - normally should "just work" on any recent Linux)
- Linux/x64 + MySQL stats .tgz (full 64bit version, same as above + MySQL stats already "pre-configured")
- MacOSX/x86 .tgz (tested on: MacOSX 10.6+)
- MacOSX/x64 .tgz (tested on: MacOSX 10.6+)
- NOTE : source code is included within each .tgz tarball
enjoy & have fun !..
and as usual, any feedback is welcome ! ;-))
Rgds,
-Dimitri
blog comments powered by DisqusNote: if you don't see any "comment" dialog above, try to access this page with another web browser, or google for known issues on your browser and DISQUS..