« secondary | Main | Tools/ dbSTRESS »
Friday, 01 April, 2011
MySQL Performance: Reaching 100M(!) Transactions/sec with MySQL 5.5 running on Exadata!

Cannot give you all details yet and it's too early to say what the max performance we'll finally obtain, but currently we out-passed 100.000.000 (!) Read+Write transactions/sec on the latest MySQL 5.5 simply integrated on the Exadata X2-8 (full rack) instead of Oracle database!!! :-))
The result is so incredible.. - but we spent several days now to validate that workload is perfectly matching customer's requirement and really reproducing their production environment. The problem came from the performance issue they observed month to month and came in our Benchmark Center to test a new HW platform (and we're in competition here with HP and IBM, but they have already finished their testing and without a positive result (no comments.. ;-))).. Finally, no one of any tested platforms was able to keep the load expected for the end of the year.. And of course we think about Exadata :-)) but the problem that the customer's application is fully dependent on MySQL and they never ever wanted to migrate (specially that they are running some hidden x64 functions which will not run on SPARC64 for ex.)..
So, looking on our Exadata, wa say "what if?".. ;-))
Then we used CELLs as MySQL shards and added some "back box magic" - the shard coordinator which is "natively" distributing data between Exadata CELL nodes and even give now a possibility to run parallel queries! - SELECT count(*) from Table of 500GB is giving an answer.. in 1.2sec!! (on InnoDB).. Then for OLTP (main customer's workload) we adopted the latest Solaris 11 features (mapping MySQL threads to kernel threads (LWP), using HW-atomic mutexes, super-parallel AIO lib and Zone binding) - all these factors gave an incredible boost, and 100M TPS was finally out-passed!! :-)) it's hard to believe if I did not see it myself :-))
Currently the max performance is limited by the network throughput.. - well x4 10Gbit network cards on each node! - who may believe we'll reach the limit on our 10Gbit switch?.. So, currently we're waiting for the new one which will be shipped next week, and then a new record will wait for us!..
Stay tuned!. ;-))
Thursday, 20 May, 2010
MySQL Performance: Using Performance Schema
Two weeks ago I was very lucky to meet in Paris Marc Allf (one of developers of MySQL Performance Schema) and get all details about Performance Schema directly from the source :-)
I would say I'm very excited about this feature giving so enormous potential to observe any activity inside of MySQL, as well by a great flexibility of the proposed solution! :-)
However, discussing with Marc and going over a day more and more in depth, I've got some remarks that I needed to group, summarize and then express (and vacation time helping here a lot ;-)) My points will not be about adding some new extensions, but rather fixing some core issues which I consider important (and, please, correct me if you're not agree, express your ideas, etc - it's one of the cases where a quantity of opinions will be easily transformed into the quality solution for sure :-))
The following stuff is not a HOWTO, rather just some ideas based on observations during a test workload. For more information about Performance Schema don't miss an excellent documentation published on MySQL site, as well a really nice example with InnoDB was posted by Jimmy Yang. So, sorry if I'll miss/skip some details - it's already hard to make it short :-)
Performance Impact
First of all I was curious to see the performance impact of using Performance Schema on a heavy database workload. So for my experiments I've used dbSTRESS scenarios with a constant Read-Only or Read+Write workload with 32 concurrent users on the server with 16 cores. InnoDB storage engine was used for all tables during the tests.
Following cases were tested as a start point:
- MySQL server was even not compiled with Performance Schema (None)
- Performance Schema was set OFF (performance_schema=0 (default))
- Performance Schema was set ON (performance_schema=1)
The following graphs are representing observed TPS levels on dbSTRESS corresponding to each case (tests were executed sequentially, one after other).
Read-Only:

As you can see:
- there is no impact on Read-Only until the performance_schema is not set to 1
- once activated, the impact on the Read-Only workload is still minimal - from 30.000 TPS we're going to 28.000 TPS, which is representing 7% (well, I'd prefer less, but 7% is still not too bad :-))
Read+Write:

Thing are changing on Read+Write:
- still no impact until Performance Schema is not enabled
- once activated, the impact here is more important - from 17.000 TPS we're going to 13.500-14.000 TPS, which is near 20% (!) degradation and not good at all..
- on the same time it's easy to understand - the internal MySQL/innoDB contention during Read+Write workload is already very high, so once you add an additional instructions within a critical parts of code it may only become more higher..
Let's see now if a such performance impact can be reduced..
Performance Schema has several "SETUP" tables giving an easy way to change default configuration and adapt accounting setup conditions/rules according your need. One of such tables is "SETUP_CONSUMERS". The default setting (contents) is:
mysql> select * from SETUP_CONSUMERS;
+----------------------------------------------+---------+
| NAME                                         | ENABLED |
+----------------------------------------------+---------+
| events_waits_current                         | YES     |
| events_waits_history                         | YES     |
| events_waits_history_long                    | YES     |
| events_waits_summary_by_thread_by_event_name | YES     |
| events_waits_summary_by_event_name           | YES     |
| events_waits_summary_by_instance             | YES     |
| file_summary_by_event_name                   | YES     |
| file_summary_by_instance                     | YES     |
+----------------------------------------------+---------+
8 rows in set (0.00 sec)
Currently there are 3 account categories:
- high level "summary" tables containing aggregated information by instance, event name, etc.
- middle level "history" tables keeping last series of wait events
- and the lowest level "current" table keeping wait events happening right now
By changing the value of "ENABLED" column to YES or NO you may enable or disable corresponding accounting within Performance Schema. By disabling "events_waits_current" you'll disable a whole accounting (equivalent to disabling Performance Schema). However having "history" accounting disabled makes still possible to account in "summary" aggregates. So the "events_waits_current" is the lowest possible level of accounting and playing the main role for all others.
Now, how the performance impact will be changed if I'll enable only the "events_waits_current" accounting?
mysql> update SETUP_CONSUMERS set ENABLED= 'NO' where NAME != 'events_waits_current';
Query OK, 7 rows affected (0.00 sec)
Rows matched: 7  Changed: 7  Warnings: 0

mysql> select * from SETUP_CONSUMERS;
+----------------------------------------------+---------+
| NAME                                         | ENABLED |
+----------------------------------------------+---------+
| events_waits_current                         | YES     |
| events_waits_history                         | NO      |
| events_waits_history_long                    | NO      |
| events_waits_summary_by_thread_by_event_name | NO      |
| events_waits_summary_by_event_name           | NO      |
| events_waits_summary_by_instance             | NO      |
| file_summary_by_event_name                   | NO      |
| file_summary_by_instance                     | NO      |
+----------------------------------------------+---------+
8 rows in set (0.00 sec)

mysql>
Read+Write (results including a "current-only" accounting):

Observations:
- TPS level is now around of 15.000(!) - it's better, but still 12% degradation comparing to 17.000 TPS
- I've added a mutex waits graph here based on information reported by InnoDB (show mutex)
- As you may see in all cases the workload is starting by jump of waits on index mutex, then drop down, then in few minutes waits become stable...
Let's get a more close look during a "stable" period:

Observations:
- Comparing to the "normal" state, we may see many mutex waits increased once Performance Schema is enabled
- kernel mutex waits are increased by x3 from ~1000 to ~3000 (srv/srv0srv.c)
- buffer mutexes waits are also increased, but the kernel mutex waits should be the main factor here (and seems the index mutex waits were decreased due contention moved to the kernel mutex)..
- using only "current" accounting reducing mutex waits, but still has %12 overhead..
- again - on the lowest possible instrumentation level there is already %12 performance degradation!
So, let's see more in details what's going here with those mutexes ;-)
Having only "current" accounting is probably useful for live debugging, but for a general observation I'll need to activate at least "events_waits_summary_by_event_name":
mysql> update SETUP_CONSUMERS set ENABLED= 'YES' where NAME = 'events_waits_summary_by_event_name';
Query OK, 1 row affected (0.00 sec)
Rows matched: 1  Changed: 1  Warnings: 0

mysql> select * from SETUP_CONSUMERS;
+----------------------------------------------+---------+
| NAME                                         | ENABLED |
+----------------------------------------------+---------+
| events_waits_current                         | YES     |
| events_waits_history                         | NO      |
| events_waits_history_long                    | NO      |
| events_waits_summary_by_thread_by_event_name | NO      |
| events_waits_summary_by_event_name           | YES     |
| events_waits_summary_by_instance             | NO      |
| file_summary_by_event_name                   | NO      |
| file_summary_by_instance                     | NO      |
+----------------------------------------------+---------+
8 rows in set (0.00 sec)

mysql>
Then reset the summary per name accounting (the table corresponding to this data is called "EVENTS_WAITS_SUMMARY_BY_EVENT_NAME", so to reset you just need to truncate this table):
mysql> truncate table EVENTS_WAITS_SUMMARY_BY_EVENT_NAME;
Query OK, 0 rows affected (0.00 sec)
Then restart my test again ;-)

Observations:
- Still 15.000 TPS!
- means by wait name aggregation is not decreasing performance!
But what can we discover now via Performance Schema?..
Let's see the top 7 wait events during Read+Write workload:
mysql> select EVENT_NAME, COUNT_STAR, SUM_TIMER_WAIT
from EVENTS_WAITS_SUMMARY_BY_EVENT_NAME
where count_star > 0
order by SUM_TIMER_WAIT desc limit 7;
+--------------------------------------------+------------+------------------+
| EVENT_NAME                                 | COUNT_STAR | SUM_TIMER_WAIT   |
+--------------------------------------------+------------+------------------+
| wait/synch/mutex/innodb/kernel_mutex       |  158217608 | 1232782089422208 |
| wait/io/file/innodb/innodb_log_file        |   18585756 |  321430981380938 |
| wait/synch/mutex/innodb/buf_pool_mutex     |   81590186 |  110569541099368 |
| wait/synch/mutex/sql/MDL_map::mutex        |   36280653 |  101617775779338 |
| wait/synch/mutex/sql/LOCK_open             |   71053737 |   39460113468230 |
| wait/synch/mutex/innodb/buffer_block_mutex |  149481944 |   21384268657882 |
| wait/synch/mutex/sql/LOCK_global_read_lock |   52214671 |   14988152509694 |
+--------------------------------------------+------------+------------------+
7 rows in set (0.00 sec)
That becomes very interesting:
- As I already supposed, having the highest number of waits doesn't yet mean the lock is having the hottest contention.. - but the waited time does! :-)
- "kernel_mutex" and "buffer_block_mutex" are having a similar number of waits, however a time spent on the "kernel_mutex" waits is over x100 times higher!
- BTW, we even don't see index mutex int the top 7 wait times ;-)
- So, the "kernel_mutex" is keeping here the first place
- While the second one is on the redo log file writes! - however still 10 times lower than kernel_mutex :-)
- Then buffer pool mutex is sharing the third place with MDL_map mutex waits..
- Whet is interesting here also: the contention on LOCK_open was resolved by introducing of MDL in 5.5.4, however according to what I can see here, the contention is moved now in MDL :-) means still need to be fixed..
Now, can I believe to what I see here?.. - the kernel mutex seems to be the hottest, but how can we be sure it's not due instrumentation code?..
Let's see what will be the result if we'll disable any mutex accounting. To do this we need to operate first with the SETUP_INSTRUMENTS table (for every NAME it keeps the setting state for ENABLED and TIMED):
mysql> update SETUP_INSTRUMENTS set ENABLED = 'NO', TIMED = 'NO' where NAME like '%mutex%';
Query OK, 121 rows affected (0.00 sec)
Rows matched: 121  Changed: 121  Warnings: 0
The new result is here:

Observations:
- We're now near 16.000 TPS! - means only 6% in performance degradation (which is way better, but we're missing all information about mutexes)..
- It also demonstrates the impact of mutex instrumentation within Performance Schema - there is something to optimize for sure..
Let's see what are the top 7 waits now:
mysql> select EVENT_NAME, COUNT_STAR, SUM_TIMER_WAIT
from EVENTS_WAITS_SUMMARY_BY_EVENT_NAME
where count_star > 0 order by SUM_TIMER_WAIT desc limit 7;
+------------------------------------------------------------+------------+-----------------+
| EVENT_NAME                                                 | COUNT_STAR | SUM_TIMER_WAIT  |
+------------------------------------------------------------+------------+-----------------+
| wait/io/file/innodb/innodb_log_file                        |   19467181 | 337391150792878 |
| wait/synch/rwlock/sql/LOCK_grant                           |   26426964 |   5980185397914 |
| wait/synch/cond/sql/Query_cache::COND_cache_status_changed |     182386 |   5504284262672 |
| wait/io/file/innodb/innodb_data_file                       |      24829 |   3915749095700 |
| wait/synch/rwlock/innodb/buf_block_lock                    |     286027 |     23545903550 |
| wait/synch/rwlock/sql/LOCK_system_variables_hash           |        128 |        23642138 |
| wait/synch/rwlock/sql/LOCK_dboptions                       |         32 |         8600878 |
+------------------------------------------------------------+------------+-----------------+
7 rows in set (0.00 sec)
Observations:
- Waits on redo log writes now on the first position
- LOCK_grant on the second (is it normal it's called so often?..)
- And I was really surprised to see waits related to query cache while it's disabled! - is it normal too?..
- And only then we're hitting waits on the data files writing... - hmm.. very interesting..
So, I was curious to see if TPS wil be better if I'll disable now the accounting on "rwlock" names too?..
mysql> update SETUP_INSTRUMENTS set ENABLED = 'NO', TIMED = 'NO' where NAME like '%rwlock%';
Query OK, 20 rows affected (0.00 sec)
Rows matched: 20 Changed: 20 Warnings: 0
The new result:

Still the same 16.000 TPS. And the top 7 waits are now:
mysql> select EVENT_NAME, COUNT_STAR, SUM_TIMER_WAIT
from EVENTS_WAITS_SUMMARY_BY_EVENT_NAME
where count_star > 0 order by SUM_TIMER_WAIT desc limit 7;
+------------------------------------------------------------+------------+-----------------+
| EVENT_NAME                                                 | COUNT_STAR | SUM_TIMER_WAIT  |
+------------------------------------------------------------+------------+-----------------+
| wait/io/file/innodb/innodb_log_file                        |   19324916 | 334853972005878 |
| wait/synch/cond/sql/Query_cache::COND_cache_status_changed |     181392 |   5652267868910 |
| wait/io/file/innodb/innodb_data_file                       |      24876 |   3727374241032 |
+------------------------------------------------------------+------------+-----------------+
3 rows in set (0.00 sec)
Observations:
- Waits on "rwlock" names are gone as expected
- It did not make any big changes on other waits, so we can be sure they were not provoked by "rwlock" instrumentation background effects :-)
- Once again, strange to see a query cache related waits.. :-)
To be sure now the problem is not coming from TIMED accounting, I'll try a test with all NAME accounting enabled but with disabled time accounting:
mysql> update SETUP_INSTRUMENTS set ENABLED = 'YES', TIMED = 'NO';
Query OK, 217 rows affected (0.00 sec)
Rows matched: 217 Changed: 217 Warnings: 0
The new result:

Hmm.. - We're back to 15.000 TPS again?...
And what about top 7 wait numbers now? -
mysql> select EVENT_NAME, COUNT_STAR, SUM_TIMER_WAIT
from EVENTS_WAITS_SUMMARY_BY_EVENT_NAME
where count_star > 0 order by 2 desc limit 7;
+---------------------------------------------------------+------------+------------------+
| EVENT_NAME                                              | COUNT_STAR | SUM_TIMER_WAIT   |
+---------------------------------------------------------+------------+------------------+
| wait/synch/mutex/innodb/kernel_mutex                    |  155087534 |  126763742418976 |
| wait/synch/mutex/innodb/buffer_block_mutex              |  146812631 |  165945812893432 |
| wait/synch/mutex/innodb/buf_pool_mutex                  |   85353157 | 2081293853476058 |
| wait/synch/mutex/sql/LOCK_open                          |   69641679 |   53903993714220 |
| wait/synch/mutex/sql/LOCK_global_read_lock              |   51163779 |   39601211521560 |
| wait/synch/mutex/sql/MDL_map::mutex                     |   35567564 |   27529970557804 |
| wait/synch/mutex/sql/Query_cache::structure_guard_mutex |   25581890 |   19800605760780 |
+---------------------------------------------------------+------------+------------------+
7 rows in set (0.00 sec)
Observations:
- First of all I'm surprised to not see a zero value in the SUM_TIMER_WAIT column! - is it a trash and should be ignored? or is it a bug and there is still some time accounting is happening even when it's disabled?..
- There is definitively something going not optimal - the accounting of number of waits should be the most light weight and should not bring a such important performance degradation!.. - it's seen with a similar "show mutex" within InnoDB and there is no reason why it cannot be done within Performance Schema too..
- However, if I can believe what I see - the wait numbers are very interesting here :-) Because LOCK_open & MDL are still here ;-) and curiously disabled query cache too ;-)
Now.. - What if the main problem is coming from the hottest "kernel mutex"?.. Let's disable accounting just on the "kernel mutex" and see how it'll change things:
mysql> update SETUP_INSTRUMENTS set ENABLED = 'YES', TIMED = 'YES';
Query OK, 217 rows affected (0.00 sec)
Rows matched: 217  Changed: 217  Warnings: 0

mysql> update SETUP_INSTRUMENTS set ENABLED = 'NO', TIMED = 'NO' where NAME like '%kernel_mutex%';
Query OK, 1 row affected (0.00 sec)
Rows matched: 1  Changed: 1  Warnings: 0
The new result is here:

Observations:
- The result is not really better (or just slightly better) - still around of 15.000 TPS
- That means the performance impact is somewhere inside of the mutex instrumentation globally within Performance Schema..
And what are the top 7 waits now?..
mysql> select EVENT_NAME, COUNT_STAR, SUM_TIMER_WAIT
from EVENTS_WAITS_SUMMARY_BY_EVENT_NAME
where count_star > 0 order by 3 desc limit 7;
+---------------------------------------------------------+------------+-----------------+
| EVENT_NAME                                              | COUNT_STAR | SUM_TIMER_WAIT  |
+---------------------------------------------------------+------------+-----------------+
| wait/io/file/innodb/innodb_log_file                     |   18687653 | 328447818062000 |
| wait/synch/mutex/innodb/buf_pool_mutex                  |   82809405 | 122379714665884 |
| wait/synch/mutex/sql/MDL_map::mutex                     |   35427655 | 100051628180218 |
| wait/synch/mutex/sql/LOCK_open                          |   69335282 |  38925098359264 |
| wait/synch/mutex/innodb/buffer_block_mutex              |  148084516 |  21364777588960 |
| wait/synch/mutex/sql/LOCK_global_read_lock              |   50918129 |  14015063815792 |
| wait/synch/mutex/sql/Query_cache::structure_guard_mutex |   25459066 |  10364875712542 |
+---------------------------------------------------------+------------+-----------------+
7 rows in set (0.00 sec)
Observations:
- The top wait time now is on redo log writes (and I'm curious to understand if it's really true.. - because I've used innodb_flush_log_at_trx_commit=2 setting and my redo log files are placed on SSD volume.. - will be interesting to observe if it'll be still similar if I'll use a RAM disk instead ;-))
- Curiously MDL+LOCK_open wait time is not far from buffer pool mutexes - probably it's still need to be improved..
- Anyway, it's quite positive to bring to the light other waits than InnoDB mutexes - it's the part of puzzle which was always missed before, and now we may compare servers as apples to apples without platform dependency! ;-)
So far, what can be improved here?..
Performance and Instrumentation
Usually performance analyzing and application tracing/instrumentation are very often going together. Because if you really need to understand what's going wrong inside of your application you need to trace it. From the other hand, if your tracing solution has an important impact on performance - very quickly you'll no more able to confirm you're tracing a real problem, or a problem may just may be gone due tracing as some critical parts will run slower and not making contention anymore, etc...
Let's start with a dumb example :-)
Here is a dumb C code I'm using usually to explain a potential impact of DTrace while tracing an unknown binary:
#include <stdio.h>

#define MAX  20000
#define LOOP 100000

main( int argc, char *argv[])
{
 int i;
 long t1, t2;

 printf( "My PID: %d\n", getpid() );
 sleep( 15 );
 puts( "Start.." );

 time( &t1 );
 for( i= 0; i < MAX; i++ )  fun();
 time( &t2 );

 printf( "Time: %d sec.\n", t2 - t1 );
}

fun()
{
 f1(); f2(); f3(); f4(); f5();
}

f1() { int i,n; for( n= 0; n < LOOP; n++ ) i*= n; }
f2() { int i,n; for( n= 0; n < LOOP; n++ ) i*= n; }
f3() { int i,n; for( n= 0; n < LOOP; n++ ) i*= n; }
f4() { int i,n; for( n= 0; n < LOOP; n++ ) i*= n; }
f5() { int i,n; for( n= 0; n < LOOP; n++ ) i*= n; }
This program has no real goal :-) It just execute function "fun()" MAX times. Then function "fun()" executes functions f1,f2..f5 - each of them is just doing LOOP times a loop on multiplication. So int total there will be executed a number of loops equal to: MAX * 5 * LOOP. And from the application point of view nothing will be changed if I'll increase the MAX by 10 and decrease the LOOP value by 10 too - there will be still the same number of loops executed, and the execution time will not vary to much due such changes..
Now let's see what will happens if I'll trace this program with DTrace supposing I have no idea what this program binary is doing and just want to discover what kind of functions are executed inside, how often, and how much time we spent inside..
I'll use the following (classic) DTrace script here:
#!/usr/sbin/dtrace -s

pid$1:a.out::entry
{
 self->t[probefunc]= timestamp;
}

pid$1:a.out::return
/self->t[probefunc]/
{
 elapsed= timestamp - self->t[probefunc];
 @s[probefunc]= sum(elapsed);
 @c[probefunc]= count();
 self->t[probefunc]= 0;
}
Script is just taking a PID as argument, and then by Control-C is printing the list of functions called (how many times, and a time spent within each function). The program is printing its PID on the start and waits 15 sec to leave me a time to start DTrace script before it will start looping :-)
So far, without tracing, the program is taking 31 sec to execute on my old AMD box. And 32 sec under DTrace script tracing. Well, 32 vs 31 sec is not too much, right? Let's see now how the time will be changed if I'll change MAX and LOOP values:
| MAX | LOOP | Normal Time | Under tracing |
| 20000 | 100000 | 31 sec | 32 sec |
| 200000 | 10000 | 31 sec | 37 sec |
| 2000000 | 1000 | 32 sec | 73 sec |
| 20000000 | 100 | 32 sec | 372 (!) sec |
As you cant see, in worse cases the binary took over x2 times, then over x10 (!) times more to do the same work!... - Why?.. - just because the code added on the fly by DTrace instrumentation has a cost! - and by reducing the time we stay inside of the each function we amplified it by so much!..
Of course, we may also simplify the trace script and trace only call numbers:
#!/usr/sbin/dtrace -s

pid$1:a.out::entry
{
 @c[probefunc]= count();
}
But the thing will still not be too much better - in the worst case instead of 372 sec we'll get 122 sec, so still near x4 times slower than a normal execution time of the same program!
While DTrace is an absolutely great tool, in the current case you have to understand what you're doing - you're introducing additional instructions into your code, and more short the portion of your code will be - more important performance impact you'll see! Dtrace has no idea about your binary. But if you have - you may do it in right way :-)
For example here a simple adding of counter++ inside of each function should not bring any important slow down on execution :-))
Now what about MySQL and Performance Schema?..
MySQL is not an unknown binary for Performance Schema instrumentation :-) so it can be done in much more lightweight way comparing to the previously presented observations!
For example if we take "kernel_mutex" - in many places it's called just to protect one or few instructions! (well, probably the usage of this mutex should be also optimized :-)) but we're speaking about tracing and instrumentation for the moment :-))
So, how the things may be changed?..
Counters - The first step should be done on accounting of the number of events - there is nothing more lightweight than a simple "count++" :-)) and there are many currently already introduced here and there inside of the MySQL code as well every storage engine. These all counters should be remapped to the same place to avoid to count the same information twice and should be always accounted, without regarding if Performance Schema is enabled or not! Keep in mind that operation:
if( tracing ) count++;
is more costly rather simple:
count++;
That's why counters should be always available without any check condition - it gives a lower performance impact :-))
Another point - it'll be also fine to have not only a number of waits, but also a number of access/calls (it'll be probably just another count++ in another place, but will give a great overview of many other issues: which file/table is accessed more than others, which mutexes are the most involved, etc.)...
Time accounting - as you saw previously, having a high number of some wait events is not yet meaning we found the source of performance problem.. - some other events may have lower wait numbers, but way more high summary wait time! - and in many cases timing is the only way to find the real source of the problem. From the other hand, time measurement is much more costly than a simple counter. So this operation should be checked first by the "IF" condition (as it's done currently) and executed on demand for each event if its TIMED setting is set to YES (as it's done currently)..
Aggregation - is very useful, but may be very costly as well :-) so should be re-viewed and re-optimized again.. - in many cases aggregation may be done on demand and during the query execution (for ex. for permanently presented objects like mutexes/ files/ etc)..
Performance Schema access - currently we may access performance
data and execute an SQL query only via a normal MySQL session.. - means
we're in the same wait queue with other sessions to execute our query.
I'll be much better to have say a dedicated port for Perf queries to
access data in priority, or via SHM (as it made in Oracle for ex.) and
access perf data live without introducing any activity into MySQL server
processing (it'll be the most clean solution).
Call to action :-)
I think currently we're missing feedbacks from real tests / workloads whenever it's possible:
- What kind of performance impact do you observe on your workload when Performance Schema is enabled?..
- Are the numbers you're observing via Performance Schema reflecting your activity right?..
- What kind of information you're missing?..
- Etc. etc. etc. :-)
Any comments are welcome! :-)
Thursday, 08 April, 2010
dim_STAT v.8.5 is here! :-)
Hope it's the last 8.x version release and the next one will be really the v.9.0 :-)
Curiously there were still many things to finish before to say yes, we
may start a new version tree :-))
First of all I was surprised to
discover some minor bugs and prefer to fix them still within v8 rather
to bring them to the v9 again :-)) Then there are some new and very
powerful improvements which cannot wait so long :-)) And finally I've
also wanted to bring some order into distribution/packages version-ing
and resolve historical ambiguity of names :-)
So far, this release is jumped to the v.8.5 not because you're missed v.8.4, but just because within a STAT-service packages I've started to tag new updates with "ready for 8.4+" which bring ambiguity when you're still using the v.8.3 :-)) So, since this release you may find a VERSION file included withing every STAT-service package, dim_STAT distribution, or already installed dim_STAT server. This file contains the version number of dim_STAT as well the OS/platform information. Hope it'll simplify many things from now :-))
As well, the list of all main changes coming with release:
Fixes :
- Database Password fixed (curiously nobody reported it until now - it's fine to know that most of users are not paranoid :-))
- CPU Count was not exact in some conditions within Multi-Host graphs
- Empty graphs are skipped within Report generations
- Updated documentation :-)
Improvements :
-
New Analyze option: Extended Multi-Host Analyze - it combines now the
classic multi-host interface + all single-host bookmarks! - you're
able now to mix on a single page your multi-host graphs and per host
graphs coming from bookmarks! :-)
-
Bookmarks links now also available for the Multi-Host too - at any
time get a more detailed view per each host available via Bookmark
graphs! :-)
-
Surprisingly there was still a room for performance improvement on
WebX - new code is running even faster than before and particularly
when generating a long list of graphs! (which is also dramatically
reducing a generation time of Reports :-))
-
STAT-service is now accepting the syntax with command_name[:port] - it
gives a possibility to run several STAT-service daemons in parallel on
different ports, and according the port number assign a different
final command for the same "stat name" (for ex. see how to collect
data in parallel from 3 different Oracle instances running on the same
server: name[:port]
feature )
-
Graphs accidentally involved with a too large list of items now will
be auto-reduced to the lower number of items and include a short error
label within a legend
EasySTAT additional options :
- Additional LOG option may be used in cases the EasySTAT output should be redirected to a file rather to be printed to the standard output (when it should to be not mixed with output from other programs/daemons running in parallel)
New Add-Ons :
- UDPstat (Solaris: UDP traffic stats)
- innodbMUTEX (MySQL: detailed InnoDB MUTEX monitoring (available since InnoDB plugin 1.0.4))
As usually, you may download all distributions from the main site: http://dimitrik.free.fr as well I'm looking for solutions to mirror at least distribution packages as the download is not always as fast as expected from "free.fr"...
Any comments are welcome! :-)
Wednesday, 16 December, 2009
MySQL Performance: Breaking limits with XtraDB !
I've just finished my benchmark report about InnoDB current hottest internal contentions on the dbSTRESS workload. Since InnoDB-plugin-1.0.4 there is an excellent feature was added by Innobase team to monitor internal mutex lock waits: a compact output of "SHOW MUTEX STATUS" become much more useful then before! and helps greatly to understand InnoDB limits!
I've integrated innodbMUTEX stats within dim_STAT monitoring and was able to see performance limits from completely different axes!
Initial results
Initially I've retested again:
- MySQL Perf-build5
- MySQL 5.4
- InnoDB-plugin-1.0.4
- XtraDB-8
on the same workload and using X4450 server (Intel CPU, 16cores, 16GB RAM (unfortunately all more powerful servers were busy :-)) as well it was sad for me that I've not used the updated XtraDB-8 code during my latest tests (there was something wrong with uploaded sources during announces, and I've discovered it only after discussion with Yasufumi)..
And obtained results are looking like this now:
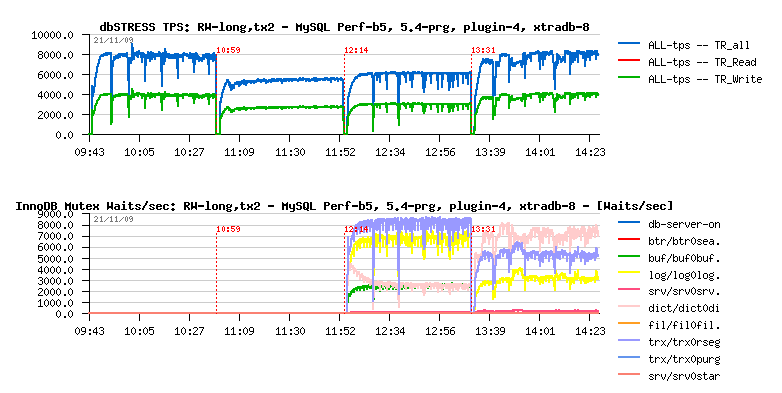
placing XtraDB-8 in the #1 position!
NOTE: lock waits stats are not available for MySQL 5.4 and build5, but
you may compare plugin-1.0.4 and XtraDB-8 profilings - they are very
different the one from other! And observing their lock waits levels you
may easily understand why XtraDB today out-performs all others!..
Going further with XtraDB
And then I continued my investigations mainly with XtraDB, because:
- Because it has already combined together all most important improvements from MySQL 5.4 and InnoDB-plugin!
- And it has already several "ongoing" improvements integrated! :-)
- And it has its own valuable ideas! :-)
- It even has now a separated purge thread feature implemented! (it was not announced in the list of features for XtraDB-8, but you may find a new configuration parameter innodb_use_purge_thread (=0/1))
- It already implements buffer mutex split (and that's why we did not observe buffer lock waits!)
- It already implements extended rollback segments!
- And it already implements some fixes for dictionary locks!
So, until all these features are not shipped "officially" - it's very easy to validate their impact on your workload with XtraDB, and I'm pretty sure - more cases will be tested, better MySQL/InnoDB will be in the future! Don't wait! :-)
I'll avoid to copy & paste my report to the blog post, and will just say you that I was able to improve performance by 37% (!) again by using available in XtraDB features!
All details you may find within my benchmark report: http://dimitrik.free.fr/db_STRESS_XtraDB-8_Performance_Dec2009.html
Any comments ate welcome! And I'll be happy if you may share any lock waits observations regarding your own workloads (production or testing - doesn't matter)!
As the last word I want just to say: kudos Percona! :-) XtraDB once again become the performance #1 and going ahead of the all today's available InnoDB engine implementations, and it's great to see such a kind of positioning few days before of incoming XtraDB anniversary! :-)
Friday, 16 October, 2009
MySQL Performance: Current performance levels of 5.4, XtraDB-8 and Innodb-1.0.4 @dbSTRESS
This is a short post just to make a point on the current performance level of available InnoDB engine implementations. I've made the current testing not in the goal to isolate performance issues, but to see how well the code works now when it meets the business constrain to flush on every transaction!..
The problem is that I've tested recently Oracle 10g with dbSTRESS during several customer's demands and was curious how well MySQL competes now with Oracle :-)) Due Oracle license restrictions I cannot present any Oracle results here (sorry folks, I still need my job :-)) But I've put MySQL into the similar conditions and was curious to see what is the current performance level we may expect on the same platform..
Until now I've always used "innodb_flush_log_at_trx_commit = 2" setting as I expected to isolate internal bottlenecks rather my storage array - but now it'll be "innodb_flush_log_at_trx_commit = 1". Bin log is not used (let's suppose we have a very secure storage array :-))
Setting innodb_flush_log_at_trx_commit = 1 changing a lot of thing - the workload become fully I/O-bound! - all will depends now how fast redo log is able to flush to disk!
dbSTRESS Scenario :
- 32 user sessions
- Read+Write workload (RW=1), no think time
- Read transaction contains 2 selects
- Write transaction contains 3 independent auto-commint orders: DELETE, INSERT, UPDATE
- Database contains 10M objects, 200M history records
- Test duration: 1 hour
H/W configuration :
- M5000 splitted in 2 zones: each zone attached to 16 own CPU cores, one zone runs MySQL, another dbSTRESS
- Storage array: ST6140 - splitted into 2 RAID1 LUNs, one keeps /DATA, another /LOG, cache on controller helps a lot!
MySQL configuration :
[mysqld]
 table_open_cache = 8000

# files
 innodb_file_per_table
 innodb_log_group_home_dir=/LOG
 innodb_log_file_size=1024M
 innodb_log_files_in_group = 3

# buffers
 innodb_buffer_pool_size=12000M
 innodb_additional_mem_pool_size=20M
 innodb_log_buffer_size=8M

# tune
 innodb_checksums=0
 innodb_doublewrite=0
 innodb_support_xa=0
 innodb_thread_concurrency = 0
 innodb_flush_log_at_trx_commit=1
 innodb_flush_method= O_DIRECT
 innodb_max_dirty_pages_pct=40

# perf special
 innodb_adaptive_checkpoint / innodb_adaptive_flushing = 1
 innodb_read_io_threads = 16
 innodb_write_io_threads = 16
 innodb_io_capacity = 2000
Notes:
- On XtraDB you have to disable innodb_adaptive_flushing to be able to use innodb_adaptive_checkpoint
- The innodb_thread_concurrency is set to zero as the current thread concurrency model is not taking care if thread is doing an I/O operation or not (see InnoDB concurrency models for more details)..
Results
the same test was executed for:
- InnoDB-plugin-1.0.4 (Innodb-4 on the graph
- XtraDB-8
- MySQL 5.4 default (5.4-def)
- MySQL 5.4 patched (5.4-patched)
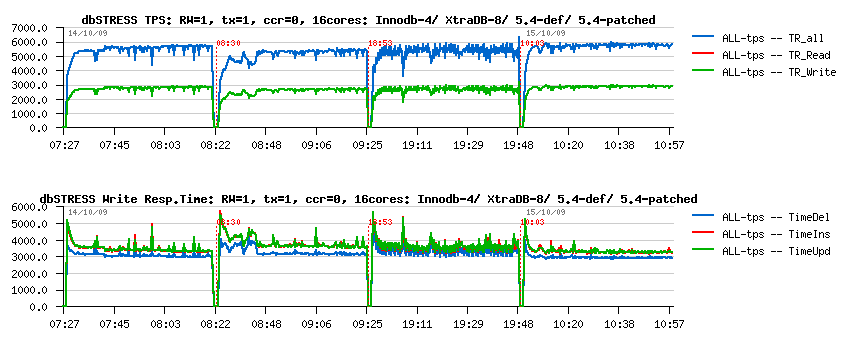
Observations:
- Of course we are far here from previously observed 12.000 TPS :-) now we're flushing on each commit!
- INSERT and UPDATE response times are making the difference
- Surprisingly recently announced XtraDB-8 was performed slower rather InnoDB-plugin-1.0.4 - I think there should be something probably missed within the current code (specially when you discovering all new features prepared by Percona! :-)), but well, the gap is small, but present..
- MySQL 5.4 default version performs slower too, and even if it jumps to the higher TPS number it's lacking of stability..
- MySQL 5.4-patched - is the default version with separated purge thread patch applied (see the full report for more details) - it performs better than InnoDB-plugin-1.0.4 as well demonstrating a very stable performance due separated and non-blocking purge activity.
I think there are the last results with these versions, but I'll keep them as the reference for next new coming changes :-)
Any comments are welcome! :-)
(but, please, don't ask me about Oracle
results :-))
UPDATE: due several code revisions and tarball uploads of XtraDB sources on the Percona site, it seems I did not test the latest XtraDB-8 code and this explains observed performance difference (see my comments below in discussion with Yasufumi).. More results to come.
Friday, 02 October, 2009
Performance Trainings & Conferences in Kiev
Last week I've participated in several Performance Conferences and Trainings in Kiev. Events mainly were dedicated to the latest improvements within MySQL performance, as well Solaris and Oracle tuning / performance analyzing and best practices. The week was very hot :-) but I've enjoyed every day discussing with creative and smart people! People hungry on knowledge and ready to stay 2 hours more overnight outpassing all allowed timing - it was a real pleasure to share all I know! :-))
So, I'd like to thank all participants! As well Sun@Kiev and i-Klass teams who organized and prepared all these events! I may only wish to see such events more and more often, and don't forget to invite me again! :-))
NOTE : similar conference about MySQL performance improvement will be organized soon in Paris - so if you're interesting in (and speaking French :-)) - please, contact me ahead, we'll need to know the size of the auditorium to be able to have seats for everybody :-))
After all that said, here are few images from the "road notes" and my slides or other materials used by me during presentations (as promised)...
Kiev Polytechnic Institute
25 years ago I came here expecting to be accepted as a new student.. And
spent 6 years of my life to study maths, computers, programming, as well
many other topics (even if some of them were here only to develop your
brain and did not have any real usage :-)) I was invited to discuss
about of databases scalability and the latest improvement made in MySQL
performance. The conference was prepared to celebrate the Software
Freedom Day in KPI ...

|

|

|

|
After so many years, entering the Main campus building was so impressive.. The Main Auditorium in this building should still remember so many famous names ... Did I expect one day to find myself on the podium and presenting my work to others?.. :-)) Initial stress was very high.. but discussing and presenting to students was so fun - that in few minutes I've got a feeling I'm speaking with old friends, and everything goes just fine :-))
Presentations :
- Databases & Scalability slides
-
MySQL
Performance slides
MySQL Performance conference @i-Klass
i-Klass is very well placed in Kiev near and face to the one of the most famous and beautiful Church in Kiev - Kiev Pechersk Lavra - simply must to visit if you're traveling in Kiev :-)) BTW, there is also a famous museum of micro miniatures (the world's smallest chess board you may see on following photo). Also, did I say you the food is absolutely excellent in Kiev?.. ;-)

|

|

|

|
i-Klass is a very good partner of Sun, and for such event they prepared their bigger conference hall accepting near 350 persons. The event itself was very successful as nobody left till the end :-)) as well a big part of participants preferred to stay one or two hours more again but do not miss the last uncovered topics :-) As well I was surprised to discover Percona presence even in Kiev! :-)) And I'm still waiting for photos from this event :-))
Presentations :
- MySQL Performance slides
- DTrace & MySQL slides from Joyent
Solaris Performance Monitoring & Analyze @i-Klass
Two next days covered Solaris performance and Oracle-oriented system tuning. We expected 20 persons for each event as practice lab supposed to have a Solaris desktop on the desk and there was not too much place in the room. But finally we got 45 persons every day and most of people came with their own laptop running Solaris! :-))

|

|

|

|
I've enjoyed all the time during these trainings and was happy to see so many strong engineers loving Sun technology and proud of their choices! :-) Some partners and customers I've already met during their benchmarks in Paris :-) All other are always welcome to test and improve performance of their applications in our Sun Solution Centers !!!
Also, one of the fun events was a direct connection with our Paris office and presenting live (with my colleague Matthieu) the demo of Automated Dynamic Reconfiguration with LDOMs! It was absolutely fantastic seating in two different locations and work all together as a one single team! Seems we made a new step in our activity :-))
Note : Last day due Internet connection problems we did not finish our stress testing with Oracle in Solaris zones - all who still want to participate in the remote testing please contact me before next Tuesday, because on Tuesday we'll replay live all programmed tests! :-))
Presentations :
- Solaris Performance slides
- Pools & Zones Overview slides
- LDOMs Training slides by Maria AVILA (Sun Solution Center)
-
Automated
Dynamic Reconfiguration (ADR) via dim_STAT slides
Bye, bye...
Thanks again to all participants and see you next time! :-))

|

|
Categories: dim_STAT, Linux, MySQL, Oracle, PostgreSQL, Solaris, Tools/ dbSTRESS
Wednesday, 09 September, 2009
MySQL Performance: I/O Optimization & InnoDB
After my previous post about InnoDB Doublewrite Buffer impact I've received several feedbacks where people are claiming to see an important performance degradation when they enabling doublewrite... Discussing with them about their wokloads I've tried to reproduce a similar activity with dbSTRESS tool. And finally I was happy (or unhappy - all depends on the side :-))
- Happy because I was able to reproduce the problem :-)
- And unhappy because I've got 30% performance degradation by activating doublewrite buffer!
And now I'll tell you a story how to fix it :-))
Sorry, it'll be little bit long (but it was hard to make it shorter :-))
First
of all let's get a look on the I/O activity and possible solutions to
make it running more optimally...
I/O Requests
Generally we may classify I/O requests by:
- I/O operation: Read or Write
- I/O nature: Sequential or Random
- I/O mode: Buffered or Synced (opened with O_SYNC / D_SYNC or followed by fsync()/fdatasync())
- etc..
And each case has its own solution:
Sequential Write (SW) :
- if your goal is throughput - main rule is to use big I/O blocks (or group several small writes into a big one - may be done by application /filesystem /storage) - latency will be less important here, so even with a simple disk array you still may obtain a very decent performance
- if your goal is operations/sec - use the smallest possible I/O blocks and having a write cache on your storage will help even more (latency will have a big role here and usually it's the only way to have a write response time less than 0.1ms)
-
in any cases having write cache on your storage box will help a lot
(specially if you also have a smart controller chip which may group
and execute several writes in parallel, etc.)
Sequential Read (SR) :
- if your goal is throughput - use bigger I/O blocks
-
in any case to speed-up your SR activity you'll need a kind of
"prefetch" available on your I/O subsystem - it means that next blocks
will be read ahead and placed in buffer even before application
requests them (it may be done by application itself, by filesystem, as
well by storage box)
Random Write (RW) :
- if your goal is throughput - something wrong with your application design :-))
- using smaller I/O blocks giving better performance
- grouping when it possible several writes into a single one helps too
-
having write cache on the storage box helps a lot - it may delay a
real write to disk operation, group and transform several incoming I/O
requests into fewer operations, as well process several writes in
parallel (depending to controller), etc.
Random Read (RR) :
- this is the worse case because in most of cases you really need to read a data block , means 5ms penalty!
- prefetch is not possible here due a random nature of I/O operations..
- so the only way you have to speed-up RR requests is to keep them caches as much as possible !
- in many cases there is no way to cache all needed data, so 5ms penalty in this case is inevitable...
- RR latency may be greatly reducing by using SSD arrays, but it's still remain very costly (but cheaper then RAM :-))
As you may see, the Random Read case is the most problematic and should be avoided whenever possible.
Time to time I'm giving Performance Trainings to Sun engineers as well to Sun customers and partners, and I give them an example of RR impact observed during one of customers benchmarks:
- imagine you have an I/O subsystem giving you 30.000 random writes/sec
- how much you may estimate a performance drop on I/O operations/sec if %5 of your writes will now become random reads?...
What do you think?..
When I'm saying what I've observed was x3 times (!) worse (only 10.000 I/O op/sec) - it's hard to believe.. However it's easy to count:
- due excellent work of controller + write cache pair a random write operation was executed within 0.1ms
- so 100 I/O operations (writes) were executed within 100 x 0.1 = 10ms
- now 5 of them become random reads, and each RR costing ~5ms...
-
100 I/O operations will take now: 5 x 5 + 95 x 0.1 = 34.5ms
Now, let's come back to the issue with doublewrite buffer...
Doublewrite Buffer
So, what may go wrong when doublewrite buffer was activated?..
Workload described in my previous post was prepared mainly to test MySQL code scalability - it avoiding to be much depending on I/O slowness and sized enough to keep a whole data workset cached (and again there are some other issues, but I'll investigate them another day). What's important here - after some time (once data are well sitting in cache) there is no more I/O read requests involved by database!
So what's the I/O activity during this workload:
- there are redo log writes - SW nature, which are very well cached by my storage box which give me 0.1ms service time per write operation
- there are buffer flush list writes - RW nature, but even having configured 16 write threads for InnoDB I never getting more than 2 write operations on the same time (seems to me lock contentions are still quite hot inside of InnoDB) - so my storage box performs pretty well here keepping reasonable service time and writes/sec level
- database performance keeps stable ~11.000 TPS
What's changing once I've enabled a doublewrite?
- same amount of pages flushing from the buffer pool will be also written in parallel into doublewrite buffer
- doublewrite buffer is written to disk sequentially(!) - which means near 0.1ms in my case and should go much more faster comparing to buffer flush writes which are random
- so fast sequential writes going in background of random writes should not decrease performance too much
-
and it's exactly what I've observed! :-))
Testing more aggressive workload
And now - I'm changing the workload conditions. I'm increasing the working set limits in way that clients accessing more wide object references and finally only 10% of data (in better case) may be kept in the buffer pool (even it's quite big). The workload become more close to realistic and more I/O-bound - it's probably more common case for production environment :-) It'll not help to understand scalability issues anymore, but will help to understand InnoDB I/O activity! :-))
So well, what is changed?..
- Database is starting with an empty buffer pool and should really read hard to get some data cached
- The starting performance level is ~1500 TPS now, but it's growing with time as anyway the probability to find data in cache is growing from 0% to 10% anyway :-))
- Random Read remain the main I/O activity during whole test (and the main bottleneck as well)
- Once there is no more free pages in the buffer pool performance is not increasing anymore, but keeping stable...
- Final performance level is around of 3500 TPS (whole test duration is one hour)
- So due RR impact workload is running x3 times slower - which is not surprising...
And if we replay the same test with doublewrite enabled?..
- Due doublewrite I/O activity is more high in volume - but that is as expected :-)
- But performance level reaching only 2500 TPS - this was not expected.. At least I did not expect :-)) I expected to see the same TPS numbers! :-))
So, what's going wrong?..
Looking more in details..
- We may see that workload is already I/O-bound on random reads
- There are random reads! - means you may estimate 5ms cost per I/O operation
- And now between these 5ms reads we're trying to insert our double writes... ;-)
- And even writes are fast, but they are entering in concurrency with RR on storage box controller
- And as I said before - RR data should be really read from disk which is increasing overall latency, and our double writes become not as fast as expected which is creating additional penalty on performance
Any way to fix it?..
My workaround to fix it:
- Initially during all my tests I've always separated InnoDB datafiles (/DATA) from redo logs (/LOG) to the different storage volumes (if not different controllers, but at least different disks) - I've made it for all reasons I've explained before (to avoid RR/RW of data pages add any latency to redo log sequential writes)
- As well I'm using a file per table for InnoDB to split file access (POSIX standard imposing for filesystems to accept only one write operation at any given time for any given file - so it's not really a good idea to keep all InnoDB tables within a single datafile ;-))
- Now - when we activated a doublewrite: where are double writes are going?.. - they are all going into the system datafile!!
- And when is system datafile is placed?.. - right, it's created within the same /DATA filesystem ;-)
-
So, what if we move it now to the /LOG filesystem and instead to mix
it with RR pages will just add its sequential write activity to the
redo log writes? - as storage write cache performed really well for SR
operations until now, it should not be a problem ;-)
$ mv /DATA/ibdata1 /LOG
$ ln -s /LOG/ibdata1 /DATA
Observations :
- I/O write volume is really doubled now
- But double writes are not mixed anymore to page I/O activity and not lowered redo log writes either!
-
And you know what? - I've got back my 3500 TPS ! :-))
Going more far..
- The same workaround may help to improve other SW activity involved within InnoDB
- Datafiles are almost accessed in Read and/or Write, random or sequential - we may help here only by using a powerful enough storage
- However doublewrite and binlog are very good candidates for improvement! (and probably some other?)
- Why I call it workaround for the moment? - I prefer to be able to do all this stuff directly from InnoDB - and after that I'll call it solution ;-)
Binlog
And what about binlog?..
- Binlog is using sequential writes
- Each write operation is synced to disk (or not - depends if you're expecting to recover all your data or not :-))
- Binlog files are created and growing dynamically until they reach max_binlog_size
Potential problems:
- By default binlog files will be created within the same directory where your datafiles are ;-)
- Why it's bad?.. - first of all it's bad because if your /DATA storage is crashed you'll be unable to replay your binlogs on your latest backup :-) - and the second reason is the same I/O impact as we saw previously with doublewrite :-)
- Then binlog file is never created ahead...
- And the problem here is that on many filesystems each single write() increasing file size will be transformed to 2(!) physical writes! (one for data and one for ~infrastructure~) - so very easily you may do 2 times more writes on your storage than you should! (unless your filesystem is managing blocks by extents like ZFS, VxFS, QFS, etc..)
- But in any case - why not to create binlogs ahead??? - space may be allocated in background by sequential writing of big blocks - it should be very fast! - then binlog writes will run faster for sure whatever filesystem you're using!
Suggestions
To summarize, here is the current list of my suggestions:
- Have a separated file for doublewrite! - and then place it according a user setting (for ex. use some kind of innodb_doublewrite_file option) - and it'll be a real solution! :-)
- Create binlog files ahead! - and probably add an option how many files should be created ahead (it's much more easier to create a 1GB binlog before it'll be used as there will be no any kind of sync impact!)
- Probably there are also other InnoDB sequential write activities which are also meriting to be placed into the separated file(s) - what do you think?..
Any comments are welcome! :-)
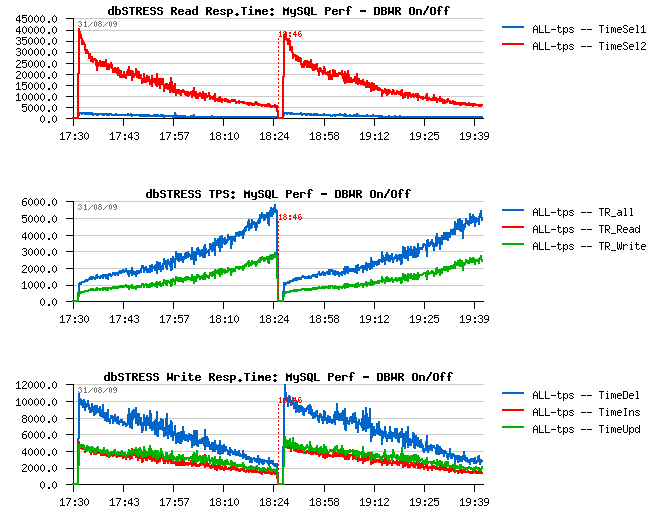
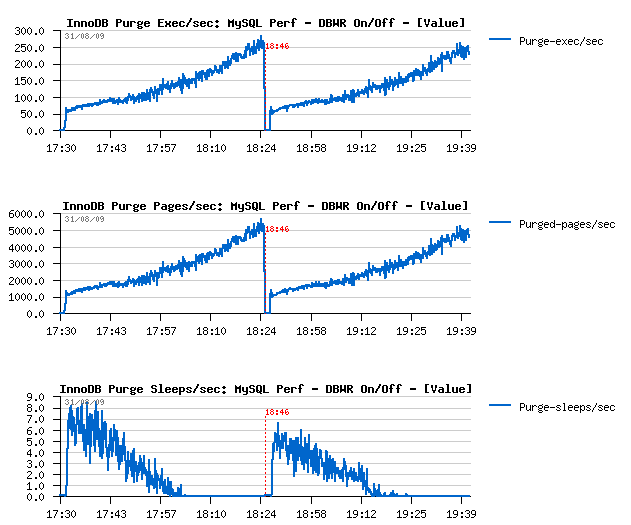
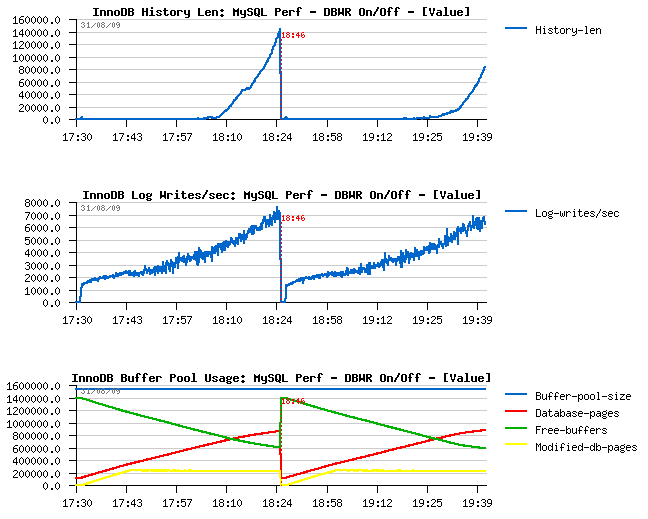
Few Graphs...
Just few graphs at the end comparing InnoDB activity when Doublewrite Buffer is set OFF and then ON.
Few comments :
-
I've increased a buffer pool that time to be not out of free pages
within one hour :-)
-
After one hour of activity performance level reached ~5000 TPS
-
Similar performance level is also observed when doublewrite buffer is
ON
-
I/O write amount is 2 times higher when doublewrite buffer is
ON, however the I/O write operations are remaining the same!
(so Sarah was right :-))
-
With a growing performance level, purge activity become more and more
important, and finally there is no more sleeps within a purge loop -
so having a separated purge thread is THE MUST! :-) (see here
for more details why)
- Current I/O-bound workload performing better if dirty pages are flushed when reaching a dirty pages percentage limit and NOT by adaptive/ahead flushing/checkpoint - Why? - because in this case it involves a single flush batch with a full I/O capacity - and as I/O subsystem is already very hot this batch will be unable to create a burst activity - it'll slowly write pages in background, then max dirty percentage will be reached again and so on.. - what's important it'll call flush batch much more less times then any other of available (ahead) methods - but again, it's only possible if your purge processing is splitted into another thread! :-))
TPS level and Response times
Dirty pages flushing
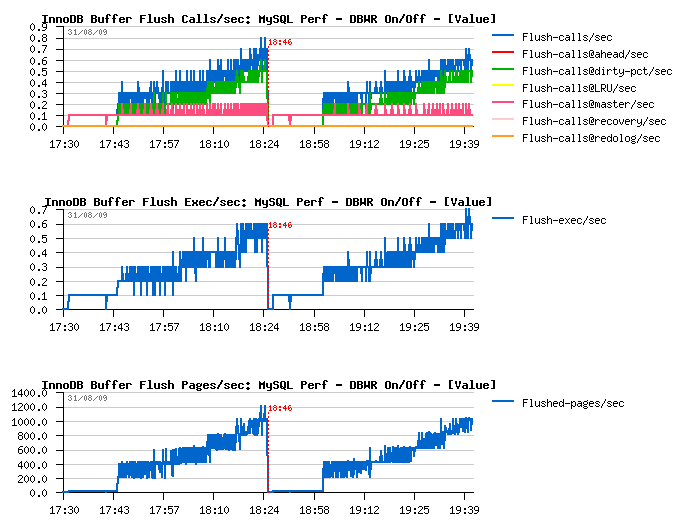
Purge activity
I/O Activity and Checkpoint Age
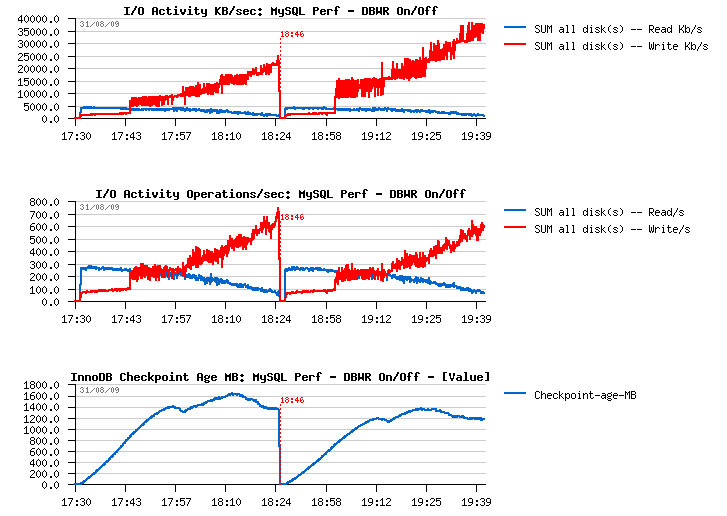
InnoDB Buffer Pool, History list length and Log writes/sec
Monday, 07 September, 2009
dim_STAT: version 8.3 was updated!
Dear friends/users!
I've just published an updated 8.3 version. This is a minor update, just to fix some abnormal issues and add few more features...
Here is a list of changes coming with update:
Fixes :
- dim_STAT-Server script on start did not restat active collects (special thanks to Didier DAHIER to find it!
- dim_STAT-Server script is now killing all clients too when involved with "stop" action
- Standard Bookmark kit was not installed by default within a template database (special thanks to Peter Hausdorf to find it!)
- Linux iostat binaries updated for STAT-service to fix broken output in some cases (special thanks to Melanie Ashworth-March to find it!
Improvements :
- Added UNIX signal traps to WebX
- Replaced crypt() function to reduce WebX binary dependencies (now again compatible back to Solaris 2.6)
- Added active collect(s) information (extending active connections)
- etc..
Database schema :
- Bookmark name size was increased to 32 characters now!
EasySTAT additional options :
- COMPRESS and TIMER options are now integrated within EasySTAT.sh and enabled by defaul
- Run forever if Hours == 0
- Supporting integration within /etc/inittab for automated stats collectin
- Special actions are involved on signal trap (see doc
- pid file is created within a working directory to simplify EasySTAT process identification
New Add-Ons :
- mysqlLOAD (compact MySQL stats oriented multi-host monitoring
- pgsqlLOAD (compact PostgreSQL stats oriented multi-host monitoring)
Wednesday, 26 August, 2009
MySQL Performance: InnoDB Doublewrite Buffer Impact
Recently Mark Callaghan(who I trust a lot) published on his facebook blog a post about a Doublewrite Buffer impact . And Sarah Sproehnle (who I trust a lot too :-)) commented it by saying:
..the doublewrite buffer is actually a benefit. Beyond guaranteeing that pages are recoverable, it also reduces the required fsyncs. Without it, each page that is written to the tablespace would need to be fsync'ed. With doublewrite enabled, a chunk of pages is written to the doublewrite buffer then 1 fsync is called, then pages are written to the tablespace and then 1 fsync...
While I'm completely agree with Mark that we absolutely need a recovery tool to be able at least to repair what is "repairable" (nobody protected from an accident :-)). But on the same time I was curious to measure the doublewrite buffer impact under a heavy read+write workload. I've noted it in my TODO list, but only recently was able to test XtraDB, MySQL 5.4, InnoDB plugin-1.0.4 and MySQL 5.Perf with doublewrite enabled (before I run all my tests with innodb_doublewrite=0 only).
For my big surprise with innodb_doublewrite=1 setting I observed no performance degradation (or near) on all engines! Even the higher rated 5.Perf was still able to keep its TPS level. From the I/O level a flushed volume become slightly higher, but nothing important as you may see from the following graph (the first part of the graph is representing the workload with a doublewrite off, and the second one with a doublewrite on) :
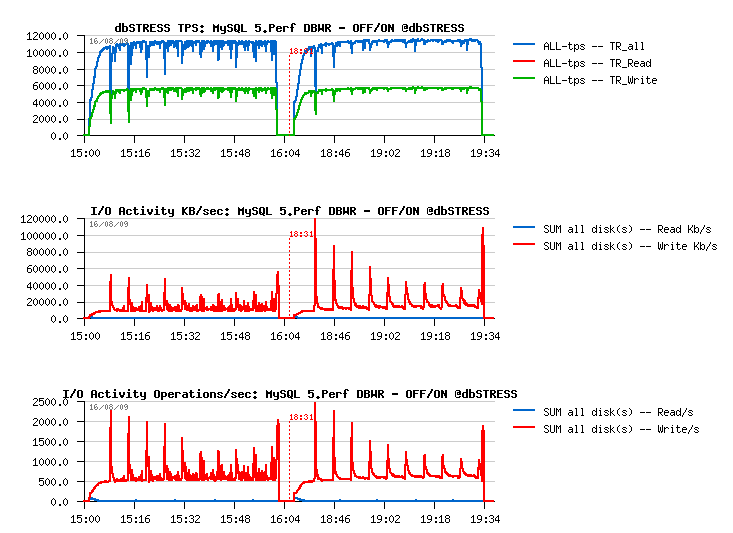
I would even say it brings more stability to the workload! And knowing it also brings more data security - it should be considered as a must option :-)
But now I'm curious : what kind of impact in any other cases was observed by you?...
Thank you for your feedback! :-)
Monday, 17 August, 2009
MySQL Performance: Final fix for Ahead Flushing & Purge Lag
The goal of this post is to tell you a final story about performance study looking to fix the Ahead FLushing and Purge Lag issues.. (I've tried to make it short, but if you feel you'll need more details or just have some more time for reading - go directly to the full report: http://dimitrik.free.fr/db_STRESS_MySQL_540_Purge_Lag_and_Ahead_Flushing_Fixed_Aug2009.html :-))
Before to tell you the story about the final solution, let me show you again the TPS level graph obtained during my last tests:

The read+write workload is executed during one hour non-stop on 4 engines (one by one):
- MySQL 5.4
- InnoDB plugin-1.0.4
- MySQL 5.Perf build #45
- XtraDB-6
As you may see from graph, all engines are getting a periodic performance drops!!
NOTE :
- InnoDB plugin-1.0.4 is using a recently added "Adaptive Flushing" feature !
- XtraDB-6 is using the famous Percona's "Adaptive Checkpoint" !
So, WHY do they also getting performance drops???...
And let me repeat again - just because during a heavy read+write workload and under the current InnoDB design the Master thread is never leaving the purge loop! and whatever "Adaptive" flushing or checkpoint code, as well dirty page limit check is never reached within a Master thread! - (for more details see my initial report and next story )..
(To understand better all these critical points I've instrumented InnoDB with light counters and was able to monitor it live during workload activity (see Extention of InnoDB Status command for more details...))
Initially I've tried to extend a purge loop with ahead flushing to avoid a "furious flushing". Modification is light, but cannot be a true fix because all other Master code should be still executed too...
And then an absolute radical idea changed everything ! :-)
- Tim Cook came with idea: if it's so, WHY NOT isolate a purge processing withing a separated thread ?..
- and Vince Carbone made an initial code split with separated Master and Purge threads!!!
Why having separated purge thread is absolutely great ?! ;-)
- because after that at least all Master thread code will work as expected in any situation!! :-))
- we may leave purging alone looping forever and not take care anymore! :-))
- Master thread activity become way simpler! :-))
It's for what I always loved Sun - it's a place of innovation !! :-))
This idea inspired me to adapt all my changes to the splitted threads and its current logic is working as the following:
Purge :
- it's a separated thread now, just looping alone on trx_purge() call and doing nothing else ! :-)
- initially by design purge should be involved once per 10 sec, but I've made this interval auto-adaptive: if no work was done during the last loop the sleep timeout is increasing (still respecting max 10sec), and if there was some purge work done - sleep timeout is decreasing (still respecting min 10ms) - works just well and adapt itself to the active workload :-)
Master :
- no more purge! :-)
- no more checks for redo log flush! :-)
- flushing redo log within a 1sec loop (as designed)
- do all other stuff within a 1sec or 10sec loop (as designed)
- for the first time on my workload I saw Master thread checking dirty page percentage limit!!! :-)))
Wow! that's is really great!!! :-))
Ahead Flushing
Now, when a dirty percentage limit is really checked, do we still need Ahead Flushing? ;-))
And I will say you YES! :-)
Why?..
-
currently when a dirty page limit is reached there will be a burst
buffer flush with 100% of I/O capacity setting, which may be very
heavy; and setting lower I/O capacity than real will be not good as it
may be too low to flush fast enough (because the goal is to avoid a
critical checkpoint age level)
-
it's quite painful to calculate everytime if dirty page limit is set
correctly according redolog and buffer pool sizes - it'll be much more
better to leave a database engine to take care about, no? ;-)
- there is no a half-force solution: it does not flushing at all, or it's flushing on 100% I/O capacity :-)
So, yes, we need it!
And with a current model with separated threads both Percona's Adaptive Checkpoint and InnoDB's freshly available Adaptive Flushing are entering perfectly in the game now! :-)) However I wanted absolutely to test a final solution but both "Adaptive" codes were not directly adaptable for MySQL 5.4... So I've made mine :-) with a small personal touch :-))
You may find all details about within a final report , but I'll just show here that from the previous situation:

we moved to the following one:

Few comments:
- no more periodic performance drops!
- checkpoint age is staying under 1.2 GB - probably a shorter time in case of recovery? ;-)
- critical checkpoint age is never reached! :-)
- mainly the buffer flushing is involved from Ahead Flushing code
- and still no more than one flush per second is really executed..
Everything goes pretty well now.. except a constantly growing "History len" value...
Purge Lag
Observing my workload graphs I was surprised by seeing a constantly growing "History len" value - this number is represiting the current number of un-purged pages..
Why it happens and where is a danger you may find from MySQL manual:
In the InnoDB multi-versioning scheme, a row is not physically removed from the database immediately when you delete it with an SQL statement. Only when InnoDB can discard the update undo log record written for the deletion can it also physically remove the corresponding row and its index records from the database. This removal operation is called a purge, and it is quite fast, usually taking the same order of time as the SQL statement that did the deletion.In a scenario where the user inserts and deletes rows in smallish batches at about the same rate in the table, it is possible that the purge thread starts to lag behind, and the table grows bigger and bigger, making everything disk-bound and very slow. Even if the table carries just 10MB of useful data, it may grow to occupy 10GB with all the "dead" rows . In such a case, it would be good to throttle new row operations and allocate more resources to the purge thread. The innodb_max_purge_lag system variable exists for exactly this purpose.
(see http://dev.mysql.com/doc/refman/5.0/en/innodb-multi-versioning.htmlfor more details)
In my case every time when the test is finished it still took 15-20 minutes for InnoDB to flush all dirty pages!
Observations:
- History len is outpassing 6 millions
- once the workload is finished, InnoDB is starting to decrease a purge gap
- dirty pages level cannot reach zero value until history len is not become zero too
- it took 17 minutes to free all dirty pages!
This workload was kept during one hour. But what will be after a whole day activity?..
The problem seems to come due the fact that purge thread cannot follow the workload activity - there are too much pages to purge...
What kind of solution may be used here?
-
speed-up the purge processing (even it may be quite costly - there are
many user threads modifying data, and only one purge thread cleaning
removed rows - so there will be need to have several purge threads,
and it leave less CPU power for a useful work (and finally you'll
probably not win anything for your workload throughput) - however even
single thread currently is not going on its full speed as it's
crossing some common locks with other threads during its work..) - but
with time I think this direction will get the main priority!..
- add a kind of throttling for writing operations to keep their activity on the same level as your maximum possible purge throughput - it'll slow down little bit your transactions, but avoid a big potential disaster!..
The second solution is already implemented within InnoDB - you may set an innodb_max_purge_lag parameter to say InnoDB to keep purge gap under this limit. But! The only problem - it doesn't work here..
WHY?..
As I explained in my previous report , the innodb_max_purge_lag condition is ignored until InnoDB considering there is a consistent read view which may need see rows to be purged. The problem is I don't have a feeling it works properly, because until I have any SELECT within my workload InnoDB considering them as consistent reads, even they are started way after when the last DML statement was committed. Probably keeping a track of an oldest LSN for SELECT may help?.. But well, let's back to the innodb_max_purge_lag setting:
This variable controls how to delay INSERT, UPDATE, and DELETE operations when purge operations are lagging (see Section 13.2.9, ?InnoDB Multi-Versioning?). The default value 0 (no delays). The InnoDB transaction system maintains a list of transactions that have delete-marked index records by UPDATE or DELETE operations. Let the length of this list be purge_lag. When purge_lag exceeds innodb_max_purge_lag, each INSERT, UPDATE, and DELETE operation is delayed by ((purge_lag/innodb_max_purge_lag)×10)?5 milliseconds. The delay is computed in the beginning of a purge batch, every ten seconds. The operations are not delayed if purge cannot run because of an old consistent read view that could see the rows to be purged.
(see http://dev.mysql.com/doc/refman/5.0/en/innodb-parameters.html#sysvar_innodb_max_purge_lag)
But honestly - what is the problem with DML query delay and consistent view?.. If the innodb_max_purge_lag is set it means we want to avoid any purge lag higher than this value! And if it become higher and there are new insert/delete/updates arriving - what else can we do here if we will not delay them just little bit? The same thing may be made within a customer application (if things going slowly - add few ms sleep between transaction orders) - will it be broken after that? ;-)) The same logic is implemented within many file systems (and recently in ZFS too)..
So, my fix is simple here - by removing of consistency read check within trx_purge function! :-)
In short the:
 if (srv_max_purge_lag > 0
  && !UT_LIST_GET_LAST(trx_sys->view_list)) {
become:
if (srv_max_purge_lag > 0 )
                            {
As well I limit the max potential delay value to 50ms.
The result
And now let me present you the result - following test was executed with Purge lag fix applied and innodb_max_purge_lag = 200000 limit:

Observations :
- TPS level is slightly lower - from 8,200 TPS it moved to 7,800 (400TPS less, 5% performance loss)
- however, everything else looks just fine! :-)
- history len is stable on 200000
- max DML delay did not outpass 5ms during all test duration
- checkpoint age and dirty pages level are rock stable
- and the most fun: once the test is finished, instead of 17 minutes all dirty pages were freed within 30 seconds ! :-)
More details you may find from the full report: http://dimitrik.free.fr/db_STRESS_MySQL_540_Purge_Lag_and_Ahead_Flushing_Fixed_Aug2009.html
Any comments are welcome! :-)