« April 2011 | Main | December 2010 »
Wednesday, 12 January, 2011
MySQL Performance: InnoDB double write buffer & redo log size impacts @MySQL 5.5
As promised, here are the results on testing MySQL 5.5.8 on Percona's TPCC-like workload but with enabled double write buffer on InnoDB (following my previous post http://dimitrik.free.fr/blog/archives/2010/12/mysql-performance-analyzing-perconas-tpcclike-workload-on-mysql-55.html)..
InnoDB Double Write Buffer feature
First of all, few words about a double write buffer feature within
InnoDB:
-
Why?.. - even having transactional logging and strict flushing
activated your database is still not protected from half-written
pages.. - this may still happen during a server crash (for ex. power
outage) when the page write operation was interrupted in the middle..
So, you'll get a corrupted data, and it will be impossible to repair
it from the redo log as there are only changes saved within redo and
not a whole page..
-
Solutions?.. - double write buffer was designed to protect your data
from a such disaster, and as its name is saying, once activated, your
data will be written twice - first to the double write buffer space,
and then to the data files.. If one of the operations was interrupted,
you'll be still able to repair your data as you'll still have a safe
copy of a given page within a data file (old image) or double write
buffer (new image).
-
Background effects?.. - security is never free ;-)) as you'll write
your data twice, you'll get a double throughput on your write I/O
operations.. - however if it's true for a "volume" of written data,
it's not really true for a number of I/O operations: the double write
buffer is written sequentially, so it may be done with few but large
I/O operations; then pages will be written in a normal way to the data
files, however needed to be flushed to the storage only at the end,
once all pages were written to the filesystem cache.. - but in reality
it's not always as nice as should be :-)) and the problem here with a
mixed I/O pattern - random operations are always more costly than
sequential ones, and mix of them may create some additional troubles
(a possible workaround I've proposed in the past - http://dimitrik.free.fr/blog/archives/2009/09/mysql-performance-io-optimization-innodb.html),
but we may expect that on SSD it should not be an issue? - not really
(according Vadim's tests: http://www.mysqlperformanceblog.com/2011/01/03/mysql-5-5-8-in-search-of-stability/)
and Mark reported 10-20% performance degradation while enabling double
write buffer on his tests (
The first part on the graphs is corresponding to the test running with
dirty pages percentage set to 15%. The second one - with 50%. As you can
see my SSD is still able to keep 600MB/s (2x times higher vs 300MB/s),
and 20,000 writes/sec (4x times higher vs 5,000)..
Let's see now what will be the performance impact now once the double
write buffer will be enabled ;-))
Test #1
Scenario:
- workload: same TPCC-like test with 16 users
- same server, same initial my.conf, plus following:
- innodb_io_capacity= 20000
-
innodb_max_dirty_pages_pct= 50
-
innodb_doublewrite= 1
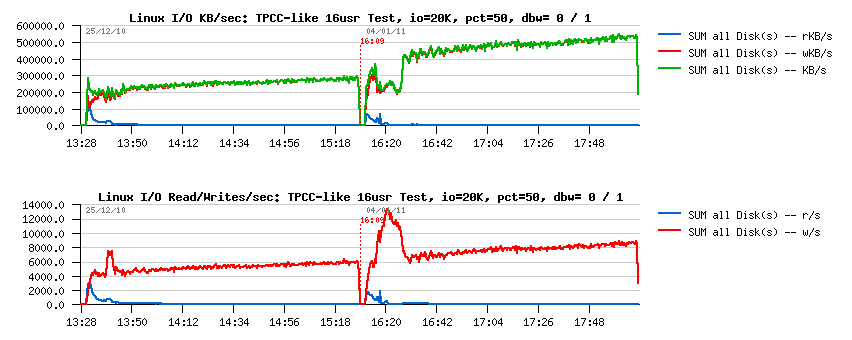
Then the test is starting, and the first 15 minutes of activity are
looking like that:
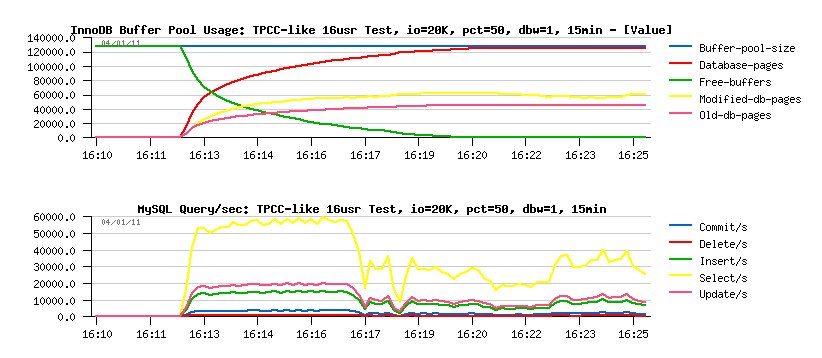
Observations:
- initial performance is not far from what I saw before without double write buffer activated: ~60,000 SELECT/sec (let's keep the level of SELECTs as a mark)..
- however, once the dirty pages level reaching my 50% setting a real page flushing is starting, and performance become at least 2 times worse!..
Does it mean that my storage has a trouble to keep my workload now?..
Let's check the I/O activity:
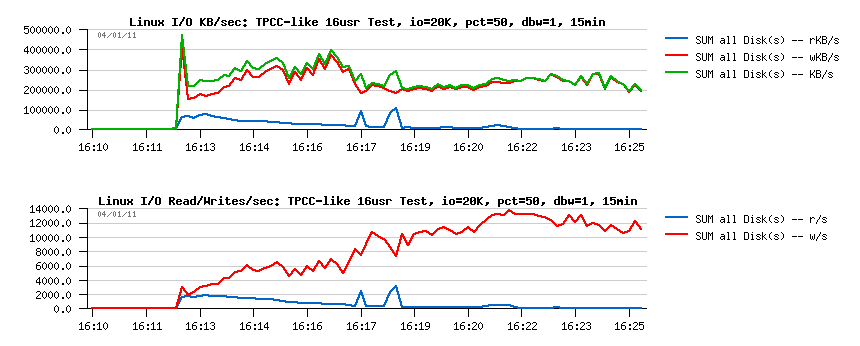
Observations:
- I'm yet far from reaching 600M/s on writes..
- and yet far from 20,000 writes/sec either..
- So, where is a problem?..
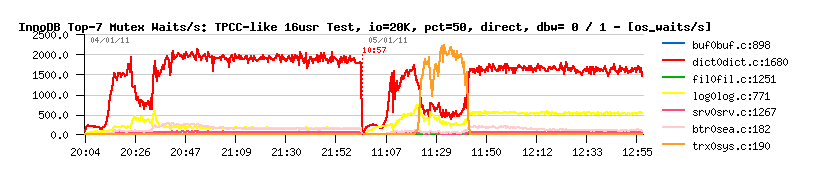
And the answer is on the mutex waits:
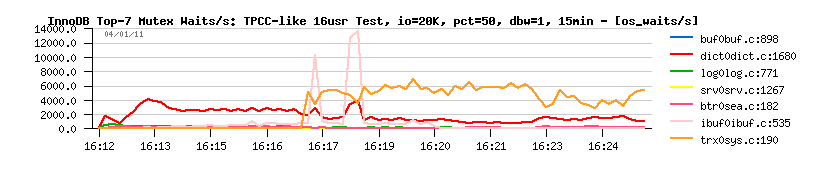
once the page flushing was started, the contention is moving within
InnoDB from the "index mutex" to the "double write buffer mutex"!
(interesting, never seen it before and cannot explain why it's appearing
here..) - and it explains the performance drop..
However, within next 5min the contention is gone, and performance
started to grow:
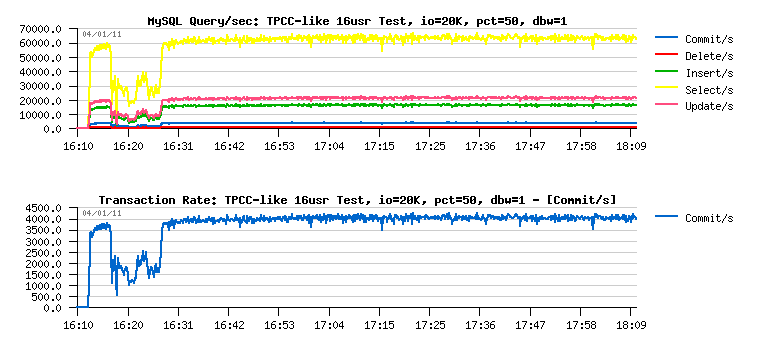
and finally reached near the same level as before when the double write
buffer was disabled..
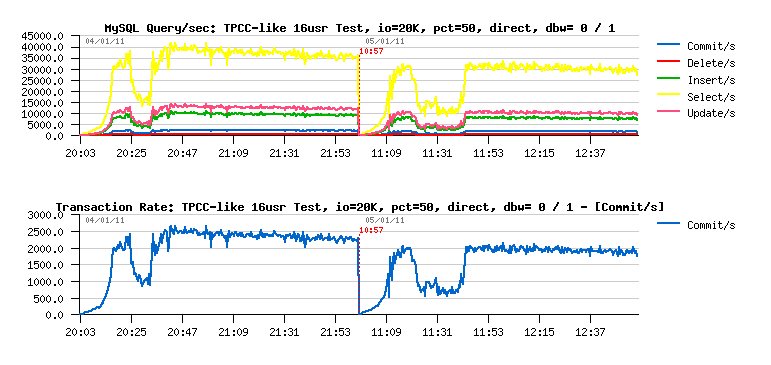
Let's compare now "apples to apples" - just place both tests on the same
graphs..
So far, the left part is representing the test without double write
buffer, while the right one - with it:
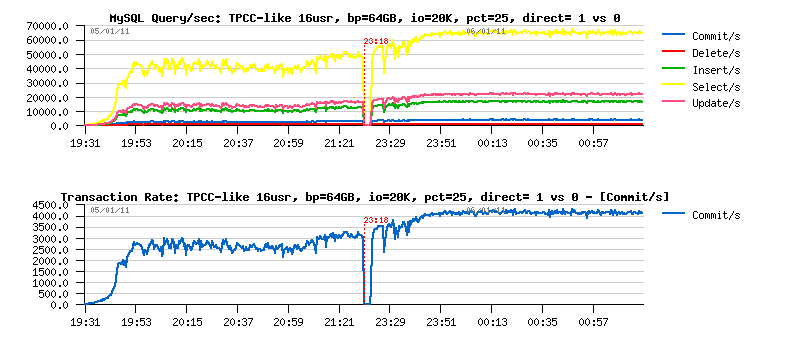
> Query/sec:

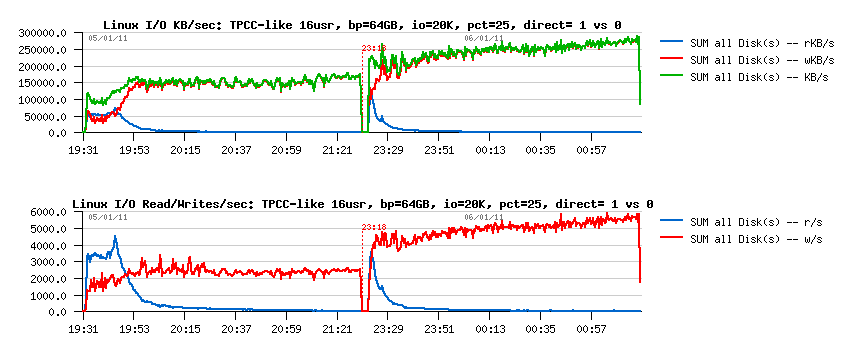
> I/O Activity:
> Checkpoint Age:

Observations:
- performance level is near the same in both cases!
- I/O activity in writes/sec is 50% higher..
- I/O activity in MB/sec is near as twice higher (as expected)..
And the final TpmC results are:
-
with innodb_doublewrite=0 : 74013.625 TpmC
-
with innodb_doublewrite=1 : 72122.852 TpmC
near the same (less than 3% degradation)..
What else?.. ;-))
And it was possible to stop here.. - but there were still many other
questions without answers in my mind, and one of them was about impact
on performance when O_DIRECT is used.. And from my part it would not be
honest to present my results without even trying O_DIRECT..
Using O_DIRECT
While I always used O_DIRECT on Solaris when it helps (for ex. on UFS it
removes a POSIX limitation of simultaneous writes to the same file), but
I did not used O_DIRECT on Linux for a long time now not really for
performance reasons, but just that I did not have a time to spend to
understand all the problems of the storage level on Linux:
- O_DIRECT implementation may have different features from one kernel to another..
- different filesystems are implementing it differently too..
- then there are several different I/O schedulers..
- and then it depends on the storage driver too..
- and if you're using a software RAID or LVM you have yet other issues..
But well, I've tried O_DIRECT option anyway, and would say performance
become way worse..
Reasons?..
- probably my disk is not fast enough when mixing random reads and random writes..
- seems EXT4 is using barriers when O_DIRECT is used (and probably writes are more safe, but performance is suffering)..
- then seems on the I/O level no parallel writes were involved, just no more than one pending write at time..
So, it looks for me likely the I/O subsystem problem rather the MySQL..
But few graphs will say you more than many words:
so:
- just by using O_DIRECT performance was decreased by 30%..
- then yet more 20% degradation once the double write buffer is used..
And on the I/O activity I'm yet far from the peak levels I've observed
before:
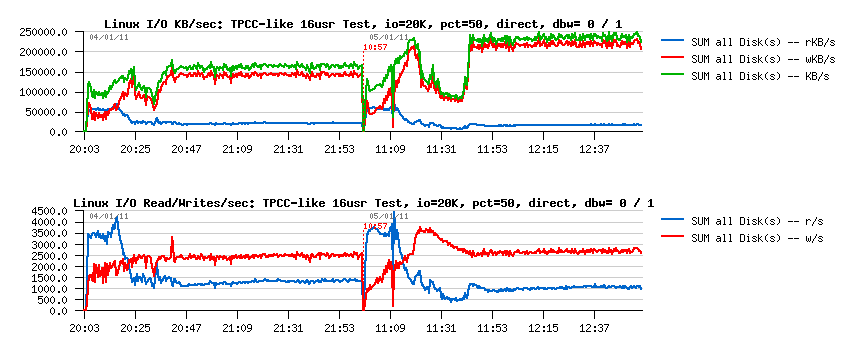
as you see:
- I'm yet far from 600MB/sec writes..
- and from 20,000 writes/sec too..
- the MB/sec writes are 60% higher now once the double write buffer is enabled
- but the level of write operations/sec remaining near the same..
- NOTE: I have also a constant presence of reads now.. - is it possible that reads are impacting performance so hard?.. (well, even it's SSD, reads will be still slower than writes on it (everything is relative ;-)))
- then I still don't have an explanation why there is a performance regression with double write buffer here.. - the I/O load not looks way harder with it; however the system is reporting SSD is near 100% busy most of the time (which did not happen without O_DIRECT).. - well, there is really something to investigate..
Another possible explanation of performance degradation may come from
the contention on the log mutex:
this contention was never presented before on all previous tests.. - but
to be sure about its impact all tests should be replayed with
performance schema enabled and monitored for TIMED values (well, again,
it's only a question of time.. :-))
Well, seems there are again more an more questions :-)) and to get the
right answers I have to dig the I/O subsystem first, and only after back
to dig MySQL.. - seems it'll be another story.. :-))
But before to finish with this article, let's see at least what is the
impact of the read I/O operations here..
Testing with 64GB Buffer Pool
Just few tests now with 64GB buffer pool - we may expect that such a big
pool should greatly reduce any reading from the storage..
Well, here are the results obtained during 2 following tests: with
O_DIRECT on vs off.
Let's get a look on the Query/sec graphs first:
Observations:
- performance is not too much better even with a 64GB buffer pool while the O_DIRECT flushing is used..
- however, performance is increasing once no more reads involved by from the database to the storage..
- performance within a buffered more (no DIRECT) and 64GB buffer pool is the same when the 32GB pool was used..
- so still 30% performance degradation when the O_DIRECT is used..
> I/O activity:
interesting that:
- there are less write both operations and throughput per second done when O_DIRECT is used
- probably in the buffered mode more I/O operations are grouped together, etc.. - need to be analyzed
> Checkpoint Age & Buffer Pool:
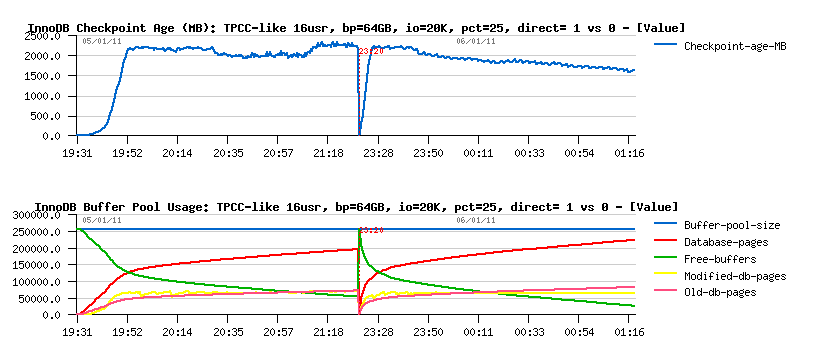
Observations:
- page flushing within DIRECT mode is not fast enough to follow checkpoint age..
- both tests were finished with yet not empty list of free pages, so no additional page management involved, etc..
> Mutex contentions:
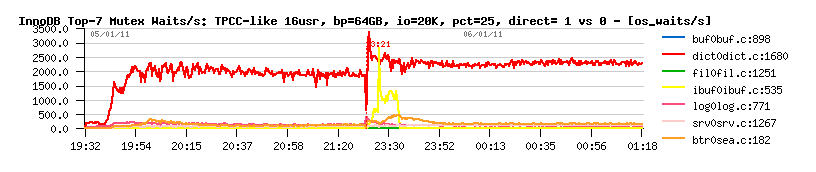
interesting:
- with O_DIRECT having a bigger buffer pool did not bring any new mutex contentions..
- however, within a buffered mode we were not out of free pages now and did not meet the "btr_search_latch" contention.. - but we still got a performance drop due a higher contention on the "insert buffer mutex" (absence of the btr_search_latch contention made the contention on the insert buffer mutex more hot)..
- NOTE: with 64GB buffer pool the size of the insert buffer reached exactly the same level as with 32GB before..
- NOTE: disabling insert buffer under this test gave a worse performance..
Having REDO log space bigger than 4GB..
The question is not really new, and if I remember well, was already open
since MySQL joined Sun.. Seems to me there were simply no strong
arguments yet presented to change things here.. - I don't think there is
anything serious limiting an overall size of redo logs to 4GB (and if
it's so, please correct me), so far it can be easily changed (I think)..
Then regarding the arguments.. - I was not convinced by the Vadim's
results (sorry :-)).. - well, things are not as simply as they are
looking sometimes, and to prove that performance of a given workload is
really limited by the redo log size will involve a detailed tracing,
etc. and again, may still look like a specific case and not as a generic
feature.. However, seems to me it's quite easy to explain with a simple
logic.. - paradox :-))
So, let me present few arguments (well, it's more likely my steps on
arriving to the over 4GB redo logs conclusion :-))
- so far, we have Buffer Pool (BP) and REDO log within InnoDB
-
Buffer Pool is working as a cache and keeping dirty (modified) pages
as well..
- as cache, Buffer Pool is trying to keep the most accessed pages as long as possible, but when user session is involving a read of new pages BP have to decide which pages should be removed, and if "normal" pages may be discarded immediately, "dirty" pages should be yet written to the storage.. - so, configuring the dirty page percentage limit to 90% is not really safe for me, and that's why within InnoDB there is a pre-check to involve a hard coded light pre-flush since 70% dirty pages level.. (but well, everything is relative)..
- each changes applied to "dirty" pages are kept within REDO log as long as corresponding dirty pages are not flushed..
-
but once there is no more free place within a REDO log you simply must
to flush the most oldest pages from the tail to make a room within
REDO log space (otherwise you cannot accept any new transactions
anymore) - and such a flushing may be very furious and freeze your
transactional activity for a while..
-
So there are mainly 2 dangers:
#1) no free space within REDO logs
#2) too much high level of dirty pages
- with a danger #2 the solution is quite simple - just set a dirty pages percentage to the limit you're considering safe for your workload (in most cases and specially when most of the data are entering into the Buffer Pool there is probably will be not a significant danger at all)..
- with a danger #1 things are more complicated: there is no direct dependency between a number of REDO log records and a number of dirty pages within a Buffer Pool.. - the same page may be changes hundred times in place and it'll be still the same dirty page, while there will be hundreds corresponding transaction records within a REDO log, and REDO may become out of free space even before the 10% level of dirty pages was even yet reached!.. As well, a completely random and wide page access will bring a lot of page moving (read & write), so the dirty pages will be simply forced to be flushed, which will "automatically" keep an amount of dirty pages quite low even without any tuning setting, which will lower checkpoint age and keep enough of free space within REDO logs most of the time..
- then from the database performance perspective: less I/O operations you're doing - better performance you have! (so simple :-))
- writing to the REDO log is the must (as far as you want to keep your transactions recovery safe)..
- while the writes of the dirty pages may still be reduced if some of pages were modified more than once for a given time period! - means if there are any chances that some pages are modified more than once (and it may happen quite often!) we have all the interest to delay their flushing because with a one single write we'll valid many changes at once instead of involving a write per change! (BTW, it's one of the problems for PostgreSQL and PBXT engine as they are writing per every change their writes sometime become too aggressive)..
- and to delay the dirty page writes there is no other way than: increase Buffer Pool size + increase the whole REDO log space! :-)
- bigger Buffer Pool you have - less dirty pages percentage you may permit for the same workload (the amount of dirty pages may still remain the same, and will not be able to increase due the same available space for changes within REDO log)..
-
for example to keep the same TPCC-like workload stable with a Buffer
Pool of 64GB I have to reduce the dirty pages percentage from 50% to 25%,
which is ridiculous on my opinion.. - I think having 70% of dirty
pages may still be very acceptable..
- but the main question now is: which size of the REDO Log will be really the most optimal for my workload?.. - as you may imagine, if your active data set is fitting into your Buffer Pool and most of the time you're modifying the same set of pages - the bigger REDO you'll have the better performance you'll obtain! :-)) And by monitoring your Checkpoint Age you may understand how big the REDO should be.. - and as it may vary and you cannot add yet REDO logs dynamically within InnoDB, you have to choose the max REDO size for your database.. And the only one serious issue with a big REDO log I see is recovery..- so the REDO size should not out-pass the size of your Buffer Pool (that recovery is able to load changes within a single REDO log scan), then recovery itself still may be improved - currently it's not yet implemented to do more things in parallel, so there is still an important room for improvement (even that it's already x10-100 times faster within MySQL 5.5 than before)..
- and of course having a dynamic add/remove of REDO log files within InnoDB should be a great feature too!!..
End of the current story :-))
Don't know if I'll see the same things on dbSTRESS workload too..
To be continued...