« July 2009 | Main | May 2009 »
Tuesday, 30 June, 2009
MySQL Performance: InnoDB Purge Lag and Ahead Flushing
After publishing in May a benchmark report about InnoDB Dirty pages & Log size impact I received several very interesting comments, and one of them pointed to the purge lag problem and InnoDB innodb_max_purge_lag parameter created specially for such purpose! So, I was very curious to know how it may help me in my workload...
The following study is about how innodb_max_purge_lag is working now and what may be done to make things better :-))
I'm not pretending here on any absolute truth :-) My goal is to understand what's going on with purge on my workload and see if there is something else possible to improve..
Benchmark scenario
My benchmark scenario will be exactly the same as in my previous test - and by chance I'm still having exactly the same server :-))
To reproduce the same workload I've prepared a follow dbSTRESS scenario:
Test Scenario :
- during 5 minutes a Read-Only warm-up
- then during 1 hour a Read+Write workload
- each sessions is operating a fixed list of objects (choice is random, but the list is fixed and InnoDB buffer pool is sized big enough to keep all necessary pages cached!)
From my previous tests I observed that the max throughput on 16cores is generally reached with 32 sessions (both with innodb thread concurrency equal to 0 or 16). So, other settings for this scenario:
Config :
- CPU cores: 16
- concurrent sessions: 32
- think time: 0
Each test is executed :
- with 1024MB redo log size
- or 128MB redo to compare
For every test to check :
- dirty pages percentage
- total time of dirty page flushing at the end of the test
- reached performance level
- History length
- DML delays (if any)
However, I'm concentrating only on MySQL 5.4 testing now.
InnoDB Purge Lag
According the InnoDB documentation (and as well InnoDB code :-)) innodb_max_purge_lag variable controls how to delay INSERT, UPDATE, and DELETE operations when purge operations are lagging. The default value 0 (no delays).
The InnoDB transaction system maintains a list of transactions that have delete-marked index records by UPDATE or DELETE operations. Let the length of this list be purge_lag. When purge_lag exceeds innodb_max_purge_lag, each INSERT, UPDATE, and DELETE operation is delayed by ((purge_lag/innodb_max_purge_lag)×10)–5 milliseconds. The delay is computed in the beginning of a purge batch, every ten seconds. The operations are not delayed if purge cannot run because of an old consistent read view that could see the rows to be purged.
However, as I explained before , purge routine is not called as expected, Main Thread is looping all the time on trx_purge() - but let's see more in depth how it works.
Purge lag is also called as a Rollback segment History length within InnoDB code, and it's the name I prefere :-))
InnoDB Code Instrumentation
To be able to monitor InnoDB internals, I've added following stats:
- FLush calls (DTrace script tracing who is calling buf_flush_batch() function and how often)
- innodbSTAT (based on "show innodb status" - to check a buffer pool state)
- added "History len" value into "show innodb status"
- added DML delay values into "show innodb status"
the added code is looks like:
 fputs("--------------\n"
         "PURGE STATUS\n"
         "--------------\n", file);
 fprintf( file, "History len: %d\nDML Delay: %d max: %d\n",
   trx_sys->rseg_history_len, srv_dml_needed_delay, srv_dml_needed_delay_max );

 srv_dml_needed_delay_max= 0;
As DML-delay (srv_dml_needed_delay) may vary a lot at any time, I've added a DML-delay-max value (srv_dml_needed_delay_max) - it's keeping the max delay value reached until current "show innodb status" call (and set to zero after).
First Observations
As you may see from my previous tests , a smaller redo log size gives a better TPS stability on InnoDB. While a bigger redo log gives a higher performance level, but - generates a periodical burst data flushing which may have a partial freeze of throughput as a side effect...
And even I don't like too much any kind of artificial limit (storage box is even not fully used here), but probably an innodb_max_purge_lag option may bring little bit more stability?..
Let's see..
First test :
- innodb_max_purge_lag=0
- innodb_max_purge_lag=1000000
- innodb_max_purge_lag=100000
- innodb_max_purge_lag=10000
For my big surprise, History length outpassed 8.000.000 within all cases and there was NO DIFFERENCE between these tests..
Why?..
Click here to continue reading...
Full report: http://dimitrik.free.fr/db_STRESS_MySQL_540_Purge_Lag_and_Ahead_Flushing_Jun2009.html
Any comments are welcome! :-)
Wednesday, 24 June, 2009
dim_STAT: Release Candidate 8.3 version
I'm very happy to present the last 8.3 release candidate version of dim_STAT!
This preview version was announced last week during my Master Class sessions I gave directly in Kiev (UKRAINE) for Sun partners, customers and employees. The Master Class session covered Performance Analyzing on Solaris and as well dim_STAT presentation and hands-on. It was a big pleasure for me and seems for users too because all sessions were very well received, and all attendees sent us very positive feedbacks! I expected to blog about while I was there, but was too tired after each class :-))

|

|

|

|
So, as the story was successful, probably new sessions will take place again in Kiev this year, and if you're interested in - just drop me an email.
But for the moment you may try a 8.3 preview version from here:
- http://dimitrik.free.fr/dim_STAT-v83.tar (Solaris/SPARC)
- http://dimitrik.free.fr/dim_STAT-v83-sol86.tar (Solaris10/x86)
- http://dimitrik.free.fr/dim_STAT-v83-lux86.tar (Linux/x86)
If you'll find any problem (even very minor) - don't hesitate to send me an email - I'll be happy to fix it before the official 8.3 will come!
Monday, 08 June, 2009
MySQL Performance: MySQL 5.4 and other InnoDB engines on 32cores AMD server & dbSTRESS
Currently several probe InnoDB code improvements were done by our MySQL Team. I was happy to test them with db_STRESS workloads but on Solaris/SPARC server (M5000). Then discussing with Mikael I was surprised he saw much less improvement from the latest probe builds on his Linux/AMD64 box... And it was unclear why the performance improvement gap is more important on SPARC: due SPARC itself? due Solaris? due a test case?.. To bring more lights and understand better what's going differently on an AMD box I've preferred to avoid to change too many things on the same time :-) So, once one of the latest 32cores AMD server (X4600-M2) was available, I was curious to test it under Solaris10 and connected to the same storage box as M5000 before. And here are my results...
My intention is to replay exactly the same tests as previously on M5000 but on the newest X4600 (8CPU AMD quad core) server. All MySQL configuration files are exactly the same as before too. Few comments anyway:
Redo log size: I keep the same redo log size = 128MB and the same dirty page percentage = 15% as before even if performance is better with a bigger log size and dirty page percentage will be never considered as I showed before on a such stressful workload. I'll privilege a performance stability during current testing rather seeking for the higher possible numbers..
MySQL versions:
- MySQL 5.4 (public beta)
- MySQL 5.Perf builds 4, 5 and 11 (details about these builds you may find on Mikael's blog or ask Mikael directly :-)
- XtraDB 5.
- MySQL 5.1 compiled with InnoDB plugin-1.0.3
All MySQL versions are :
- compiled with GCC 4.3.
- compiled with flags: -O
- linked with: -lmtmalloc
Benchmark summary:
-
I was really impressed by performance level of a single MySQL session
on the AMD box - it's near twice faster comparing to M5000! However
once wokload is growing, this potential performance gap is decreasing
and throughput become less or more comparable to the SPARC server.
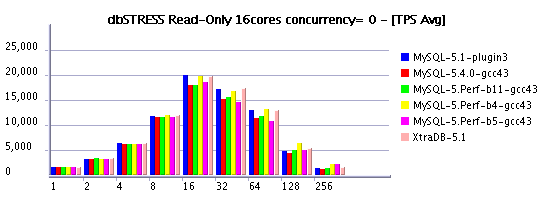
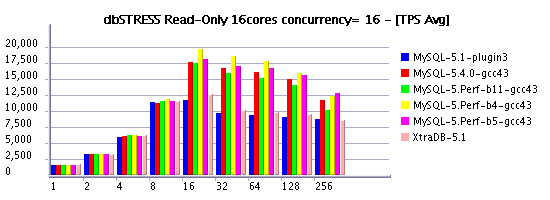
- Negative performance gap between setting innodb thread concurrency = 0 and 16 is even more important for InnoDB plugin and XtraDB on AMD 16cores: from 20,000 Read-Only TPS they are dropping to 12,500(!) - loosing 37% in performance! - Seems to me time based concurrency introduced with MySQL 5.4 should be absolutely integrated into InnoDB plugin
-
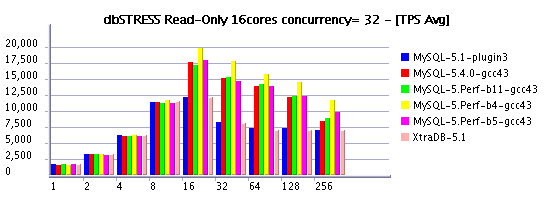
Surprisingly results on 32 cores are slightly better on AMD comparing
to the old SPARC (I did not run 32cores test on M5000 due limited
server availability time) As well performance obtained with InnoDB
thread concurrency = 32 seems to be much more close to the concurrency
= 16 on the new perf builds - good sign for scalability improvement!
:-)
-
On the same time perf builds 4 and 5 are outpassing 5.4 as it was
observed on SPARC: ~15% on Read-Only and more than 20% on Read+Write
workload!
-
And I was pleasantly surprised by Read-Only performance of XtraDB and
InnoDB plugin tested with zero InnoDB concurrency - on AMD server they
outpassed MySQL 5.4 version! - and only perf build4 was able to
compete with them on this box!
-
Another surprise was to see a higher Read+Write TPS throughput on
XtraDB-5 comparing to MySQL 5.4 - quite interesting what is making a
difference here comparing to SPARC :-)
- Finally buil4 and build5 are the most performant on my tests - probably it's a time to merge them into 5.4? ;-)
As usually all details and full results are presented in the final report, but some of them I'd like to present individually.
Read-Only Workload @16cores AMD
Read+Write Workload @16cores AMD
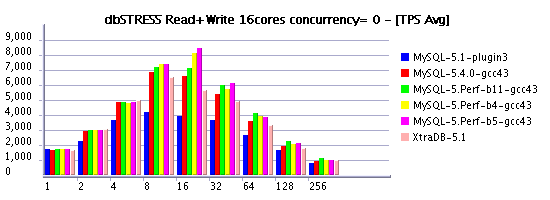
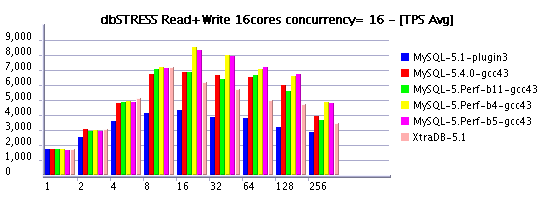
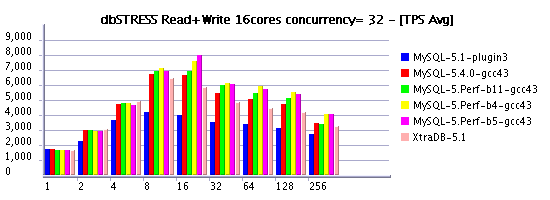
Full benchmark report is here: http://dimitrik.free.fr/db_STRESS_MySQL_540_and_others_at_AMD_32cores_Jun2009.html
Any comments are welcome! :-)
Thursday, 04 June, 2009
PostgreSQL Performance: VARCHAR and FX Class scheduler impact @dbSTRESS benchmark
Since my last post about PostgreSQL performance on dbSTRESS benchmark I've received several interesting comments about what may be improved with PostgreSQL. Currently I was interested on the following two:
- use VARCHAR instead of CHAR -- within a tested database schema I've used CHAR columns intentionally to simplify space management as all manipulated data during the test have a fixed length. But seems in PostgreSQL management of CHAR values have an additional overhead comparing to VARCHAR as it'll always try to add trailing spaces at the end of the value...
- Jignesh published some interesting observations by using FX class scheduler on Solaris
So, I was curious to try both of them :-) with 8.4 beta1
Using VARCHAR
Main surprise for me here was that once all data were loaded as VARCHAR, then all PREPARED statement started to work more than 100x times slower... - PREPARE itself is worked as usual, but EXECUTE took too much time - I'm supposing there is a bug and not presenting here any results with prepared statements. However, all tests with not-prepared statements worked well.
Solaris Scheduler: FX Class
Finishing previous tests I've got a feeling there are some scheduler issues may enter in game when injector and database are running on the same server - in my case I've always separated them by running within an isolated processors sets. But there was no way to create 2 proper processor sets on 32cores server to test 32cores configuration :-) so at the end I've tested 24 cores, and planned to continue investigation on a bigger server once I'll have it. However my mind continued to turn a question: What if it's just because I did not use FX class scheduler?.. How to miss an occasion to try when it's coming? ;-)
Results
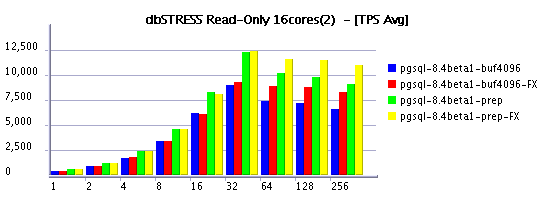
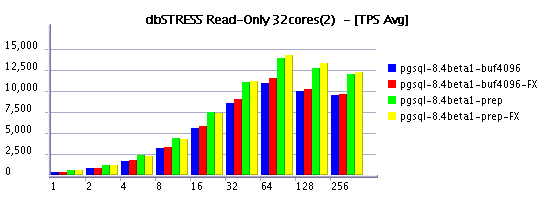
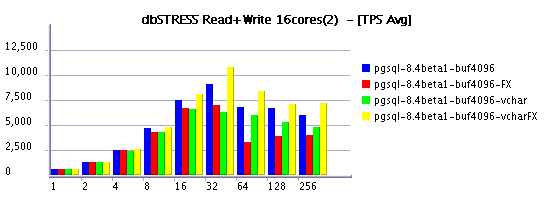
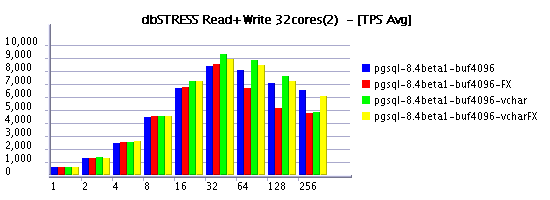
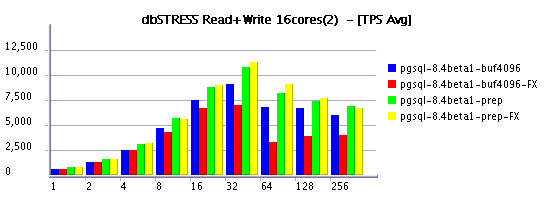
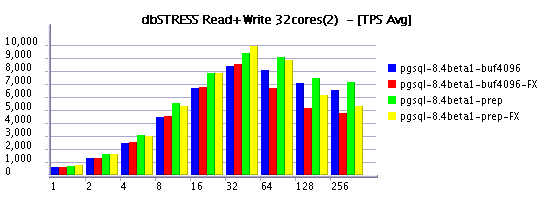
Initial graph labeling was explained here .
Some comments on additional labeling currently used:
- all tests are having the same base configuration (4096M buffer pool, etc. etc. as before)
- prep --> prepared statements were used
- buf4096 --> statements were not prepared
- FX --> PG was switched to FX Class during execution
- vchar --> VARCHAR datatype was used instead of CHAR
Read-Only Workload
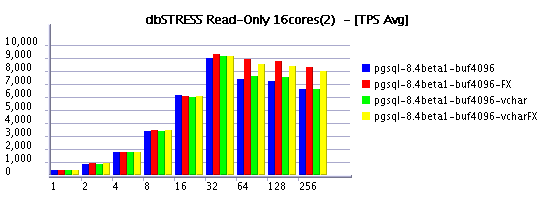
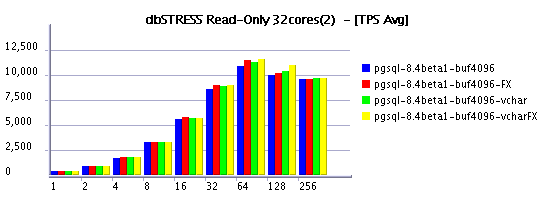
Read-Write Workload
Summary
-
it's quite curious to see in some cases a negative impact on
Read+Write workload by switching to FX Class scheduling - it make me
think there are probably some of postgres processes should have a
higher priority then others to keep things working well.
-
on the same time Read+Only workload feels better under FX scheduling
:-)
-
And it's true, when it worked VARCHAR performs better than CHAR even
if only fixed length values are used! Will keep in mind for the next
time :-)
Any comments are welcome! :-)
Tuesday, 02 June, 2009
MySQL Performance: Some results comparing InnoDB log size impact @dbSTRESS benchmark
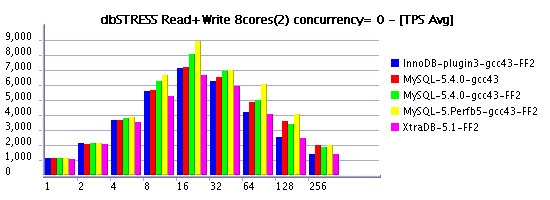
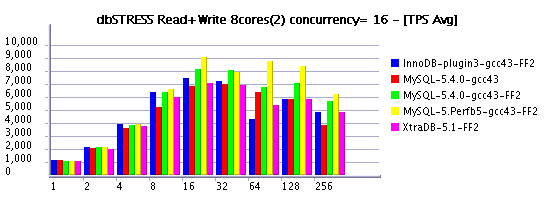
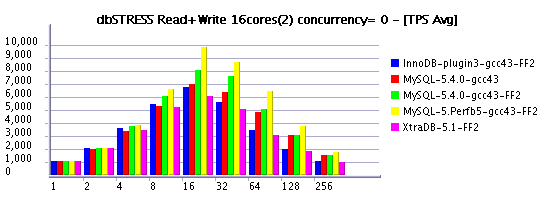
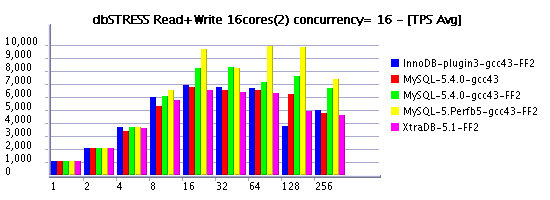
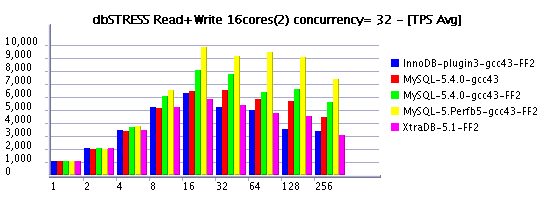
Following my previous post (where I've also told about a significant performance gain by using a bigger InnoDB log size ), I'd like to present you some results obtained on the Read+Write workload and log size equal to 1024MB. I've labeled it on graphs as "FF" (Fast & Furious :-)) as within a such configuration MySQL server may go very fast until it'll meet a "furious flushing" to free some space within a log file... :-)
However, the speed-up is quite important, so if you don't worry too much if time to time your production activity may have a short drop on performance - you have to consider this option as one of the first to test to improve your throughput! :-)
As you may see from the following graphs, most of engines performing with 1024M redo log even better than previously tested MySQL 5.4 with 128M log. But with a bigger redo log MySQL 5.4 is also going more far. And perf version build5 performs even better.
On the same time the test is not long enough to present a real avg TPS when each engine is running on its full power (all results should be better). But you still may recognize the moment when each engine met its "furious flushing" - throughput is shortly dropped on one moment or another...
As usually, X-axis represents the number of concurrent clients (sessions), and Y-axis the obtained TPS level.
Read+Write @8cores
Read+Write @16cores
Any comments are welcome! :-)