« July 2010 | Main | April 2010 »
Thursday, 20 May, 2010
MySQL Performance: Using Performance Schema
Two weeks ago I was very lucky to meet in Paris Marc Allf (one of developers of MySQL Performance Schema) and get all details about Performance Schema directly from the source :-)
I would say I'm very excited about this feature giving so enormous potential to observe any activity inside of MySQL, as well by a great flexibility of the proposed solution! :-)
However, discussing with Marc and going over a day more and more in depth, I've got some remarks that I needed to group, summarize and then express (and vacation time helping here a lot ;-)) My points will not be about adding some new extensions, but rather fixing some core issues which I consider important (and, please, correct me if you're not agree, express your ideas, etc - it's one of the cases where a quantity of opinions will be easily transformed into the quality solution for sure :-))
The following stuff is not a HOWTO, rather just some ideas based on observations during a test workload. For more information about Performance Schema don't miss an excellent documentation published on MySQL site, as well a really nice example with InnoDB was posted by Jimmy Yang. So, sorry if I'll miss/skip some details - it's already hard to make it short :-)
Performance Impact
First of all I was curious to see the performance impact of using Performance Schema on a heavy database workload. So for my experiments I've used dbSTRESS scenarios with a constant Read-Only or Read+Write workload with 32 concurrent users on the server with 16 cores. InnoDB storage engine was used for all tables during the tests.
Following cases were tested as a start point:
- MySQL server was even not compiled with Performance Schema (None)
- Performance Schema was set OFF (performance_schema=0 (default))
- Performance Schema was set ON (performance_schema=1)
The following graphs are representing observed TPS levels on dbSTRESS corresponding to each case (tests were executed sequentially, one after other).
Read-Only:

As you can see:
- there is no impact on Read-Only until the performance_schema is not set to 1
- once activated, the impact on the Read-Only workload is still minimal - from 30.000 TPS we're going to 28.000 TPS, which is representing 7% (well, I'd prefer less, but 7% is still not too bad :-))
Read+Write:

Thing are changing on Read+Write:
- still no impact until Performance Schema is not enabled
- once activated, the impact here is more important - from 17.000 TPS we're going to 13.500-14.000 TPS, which is near 20% (!) degradation and not good at all..
- on the same time it's easy to understand - the internal MySQL/innoDB contention during Read+Write workload is already very high, so once you add an additional instructions within a critical parts of code it may only become more higher..
Let's see now if a such performance impact can be reduced..
Performance Schema has several "SETUP" tables giving an easy way to change default configuration and adapt accounting setup conditions/rules according your need. One of such tables is "SETUP_CONSUMERS". The default setting (contents) is:
mysql> select * from SETUP_CONSUMERS;
+----------------------------------------------+---------+
| NAME                                         | ENABLED |
+----------------------------------------------+---------+
| events_waits_current                         | YES     |
| events_waits_history                         | YES     |
| events_waits_history_long                    | YES     |
| events_waits_summary_by_thread_by_event_name | YES     |
| events_waits_summary_by_event_name           | YES     |
| events_waits_summary_by_instance             | YES     |
| file_summary_by_event_name                   | YES     |
| file_summary_by_instance                     | YES     |
+----------------------------------------------+---------+
8 rows in set (0.00 sec)
Currently there are 3 account categories:
- high level "summary" tables containing aggregated information by instance, event name, etc.
- middle level "history" tables keeping last series of wait events
- and the lowest level "current" table keeping wait events happening right now
By changing the value of "ENABLED" column to YES or NO you may enable or disable corresponding accounting within Performance Schema. By disabling "events_waits_current" you'll disable a whole accounting (equivalent to disabling Performance Schema). However having "history" accounting disabled makes still possible to account in "summary" aggregates. So the "events_waits_current" is the lowest possible level of accounting and playing the main role for all others.
Now, how the performance impact will be changed if I'll enable only the "events_waits_current" accounting?
mysql> update SETUP_CONSUMERS set ENABLED= 'NO' where NAME != 'events_waits_current';
Query OK, 7 rows affected (0.00 sec)
Rows matched: 7  Changed: 7  Warnings: 0

mysql> select * from SETUP_CONSUMERS;
+----------------------------------------------+---------+
| NAME                                         | ENABLED |
+----------------------------------------------+---------+
| events_waits_current                         | YES     |
| events_waits_history                         | NO      |
| events_waits_history_long                    | NO      |
| events_waits_summary_by_thread_by_event_name | NO      |
| events_waits_summary_by_event_name           | NO      |
| events_waits_summary_by_instance             | NO      |
| file_summary_by_event_name                   | NO      |
| file_summary_by_instance                     | NO      |
+----------------------------------------------+---------+
8 rows in set (0.00 sec)

mysql>
Read+Write (results including a "current-only" accounting):

Observations:
- TPS level is now around of 15.000(!) - it's better, but still 12% degradation comparing to 17.000 TPS
- I've added a mutex waits graph here based on information reported by InnoDB (show mutex)
- As you may see in all cases the workload is starting by jump of waits on index mutex, then drop down, then in few minutes waits become stable...
Let's get a more close look during a "stable" period:

Observations:
- Comparing to the "normal" state, we may see many mutex waits increased once Performance Schema is enabled
- kernel mutex waits are increased by x3 from ~1000 to ~3000 (srv/srv0srv.c)
- buffer mutexes waits are also increased, but the kernel mutex waits should be the main factor here (and seems the index mutex waits were decreased due contention moved to the kernel mutex)..
- using only "current" accounting reducing mutex waits, but still has %12 overhead..
- again - on the lowest possible instrumentation level there is already %12 performance degradation!
So, let's see more in details what's going here with those mutexes ;-)
Having only "current" accounting is probably useful for live debugging, but for a general observation I'll need to activate at least "events_waits_summary_by_event_name":
mysql> update SETUP_CONSUMERS set ENABLED= 'YES' where NAME = 'events_waits_summary_by_event_name';
Query OK, 1 row affected (0.00 sec)
Rows matched: 1  Changed: 1  Warnings: 0

mysql> select * from SETUP_CONSUMERS;
+----------------------------------------------+---------+
| NAME                                         | ENABLED |
+----------------------------------------------+---------+
| events_waits_current                         | YES     |
| events_waits_history                         | NO      |
| events_waits_history_long                    | NO      |
| events_waits_summary_by_thread_by_event_name | NO      |
| events_waits_summary_by_event_name           | YES     |
| events_waits_summary_by_instance             | NO      |
| file_summary_by_event_name                   | NO      |
| file_summary_by_instance                     | NO      |
+----------------------------------------------+---------+
8 rows in set (0.00 sec)

mysql>
Then reset the summary per name accounting (the table corresponding to this data is called "EVENTS_WAITS_SUMMARY_BY_EVENT_NAME", so to reset you just need to truncate this table):
mysql> truncate table EVENTS_WAITS_SUMMARY_BY_EVENT_NAME;
Query OK, 0 rows affected (0.00 sec)
Then restart my test again ;-)

Observations:
- Still 15.000 TPS!
- means by wait name aggregation is not decreasing performance!
But what can we discover now via Performance Schema?..
Let's see the top 7 wait events during Read+Write workload:
mysql> select EVENT_NAME, COUNT_STAR, SUM_TIMER_WAIT
from EVENTS_WAITS_SUMMARY_BY_EVENT_NAME
where count_star > 0
order by SUM_TIMER_WAIT desc limit 7;
+--------------------------------------------+------------+------------------+
| EVENT_NAME                                 | COUNT_STAR | SUM_TIMER_WAIT   |
+--------------------------------------------+------------+------------------+
| wait/synch/mutex/innodb/kernel_mutex       |  158217608 | 1232782089422208 |
| wait/io/file/innodb/innodb_log_file        |   18585756 |  321430981380938 |
| wait/synch/mutex/innodb/buf_pool_mutex     |   81590186 |  110569541099368 |
| wait/synch/mutex/sql/MDL_map::mutex        |   36280653 |  101617775779338 |
| wait/synch/mutex/sql/LOCK_open             |   71053737 |   39460113468230 |
| wait/synch/mutex/innodb/buffer_block_mutex |  149481944 |   21384268657882 |
| wait/synch/mutex/sql/LOCK_global_read_lock |   52214671 |   14988152509694 |
+--------------------------------------------+------------+------------------+
7 rows in set (0.00 sec)
That becomes very interesting:
- As I already supposed, having the highest number of waits doesn't yet mean the lock is having the hottest contention.. - but the waited time does! :-)
- "kernel_mutex" and "buffer_block_mutex" are having a similar number of waits, however a time spent on the "kernel_mutex" waits is over x100 times higher!
- BTW, we even don't see index mutex int the top 7 wait times ;-)
- So, the "kernel_mutex" is keeping here the first place
- While the second one is on the redo log file writes! - however still 10 times lower than kernel_mutex :-)
- Then buffer pool mutex is sharing the third place with MDL_map mutex waits..
- Whet is interesting here also: the contention on LOCK_open was resolved by introducing of MDL in 5.5.4, however according to what I can see here, the contention is moved now in MDL :-) means still need to be fixed..
Now, can I believe to what I see here?.. - the kernel mutex seems to be the hottest, but how can we be sure it's not due instrumentation code?..
Let's see what will be the result if we'll disable any mutex accounting. To do this we need to operate first with the SETUP_INSTRUMENTS table (for every NAME it keeps the setting state for ENABLED and TIMED):
mysql> update SETUP_INSTRUMENTS set ENABLED = 'NO', TIMED = 'NO' where NAME like '%mutex%';
Query OK, 121 rows affected (0.00 sec)
Rows matched: 121  Changed: 121  Warnings: 0
The new result is here:

Observations:
- We're now near 16.000 TPS! - means only 6% in performance degradation (which is way better, but we're missing all information about mutexes)..
- It also demonstrates the impact of mutex instrumentation within Performance Schema - there is something to optimize for sure..
Let's see what are the top 7 waits now:
mysql> select EVENT_NAME, COUNT_STAR, SUM_TIMER_WAIT
from EVENTS_WAITS_SUMMARY_BY_EVENT_NAME
where count_star > 0 order by SUM_TIMER_WAIT desc limit 7;
+------------------------------------------------------------+------------+-----------------+
| EVENT_NAME                                                 | COUNT_STAR | SUM_TIMER_WAIT  |
+------------------------------------------------------------+------------+-----------------+
| wait/io/file/innodb/innodb_log_file                        |   19467181 | 337391150792878 |
| wait/synch/rwlock/sql/LOCK_grant                           |   26426964 |   5980185397914 |
| wait/synch/cond/sql/Query_cache::COND_cache_status_changed |     182386 |   5504284262672 |
| wait/io/file/innodb/innodb_data_file                       |      24829 |   3915749095700 |
| wait/synch/rwlock/innodb/buf_block_lock                    |     286027 |     23545903550 |
| wait/synch/rwlock/sql/LOCK_system_variables_hash           |        128 |        23642138 |
| wait/synch/rwlock/sql/LOCK_dboptions                       |         32 |         8600878 |
+------------------------------------------------------------+------------+-----------------+
7 rows in set (0.00 sec)
Observations:
- Waits on redo log writes now on the first position
- LOCK_grant on the second (is it normal it's called so often?..)
- And I was really surprised to see waits related to query cache while it's disabled! - is it normal too?..
- And only then we're hitting waits on the data files writing... - hmm.. very interesting..
So, I was curious to see if TPS wil be better if I'll disable now the accounting on "rwlock" names too?..
mysql> update SETUP_INSTRUMENTS set ENABLED = 'NO', TIMED = 'NO' where NAME like '%rwlock%';
Query OK, 20 rows affected (0.00 sec)
Rows matched: 20 Changed: 20 Warnings: 0
The new result:

Still the same 16.000 TPS. And the top 7 waits are now:
mysql> select EVENT_NAME, COUNT_STAR, SUM_TIMER_WAIT
from EVENTS_WAITS_SUMMARY_BY_EVENT_NAME
where count_star > 0 order by SUM_TIMER_WAIT desc limit 7;
+------------------------------------------------------------+------------+-----------------+
| EVENT_NAME                                                 | COUNT_STAR | SUM_TIMER_WAIT  |
+------------------------------------------------------------+------------+-----------------+
| wait/io/file/innodb/innodb_log_file                        |   19324916 | 334853972005878 |
| wait/synch/cond/sql/Query_cache::COND_cache_status_changed |     181392 |   5652267868910 |
| wait/io/file/innodb/innodb_data_file                       |      24876 |   3727374241032 |
+------------------------------------------------------------+------------+-----------------+
3 rows in set (0.00 sec)
Observations:
- Waits on "rwlock" names are gone as expected
- It did not make any big changes on other waits, so we can be sure they were not provoked by "rwlock" instrumentation background effects :-)
- Once again, strange to see a query cache related waits.. :-)
To be sure now the problem is not coming from TIMED accounting, I'll try a test with all NAME accounting enabled but with disabled time accounting:
mysql> update SETUP_INSTRUMENTS set ENABLED = 'YES', TIMED = 'NO';
Query OK, 217 rows affected (0.00 sec)
Rows matched: 217 Changed: 217 Warnings: 0
The new result:

Hmm.. - We're back to 15.000 TPS again?...
And what about top 7 wait numbers now? -
mysql> select EVENT_NAME, COUNT_STAR, SUM_TIMER_WAIT
from EVENTS_WAITS_SUMMARY_BY_EVENT_NAME
where count_star > 0 order by 2 desc limit 7;
+---------------------------------------------------------+------------+------------------+
| EVENT_NAME                                              | COUNT_STAR | SUM_TIMER_WAIT   |
+---------------------------------------------------------+------------+------------------+
| wait/synch/mutex/innodb/kernel_mutex                    |  155087534 |  126763742418976 |
| wait/synch/mutex/innodb/buffer_block_mutex              |  146812631 |  165945812893432 |
| wait/synch/mutex/innodb/buf_pool_mutex                  |   85353157 | 2081293853476058 |
| wait/synch/mutex/sql/LOCK_open                          |   69641679 |   53903993714220 |
| wait/synch/mutex/sql/LOCK_global_read_lock              |   51163779 |   39601211521560 |
| wait/synch/mutex/sql/MDL_map::mutex                     |   35567564 |   27529970557804 |
| wait/synch/mutex/sql/Query_cache::structure_guard_mutex |   25581890 |   19800605760780 |
+---------------------------------------------------------+------------+------------------+
7 rows in set (0.00 sec)
Observations:
- First of all I'm surprised to not see a zero value in the SUM_TIMER_WAIT column! - is it a trash and should be ignored? or is it a bug and there is still some time accounting is happening even when it's disabled?..
- There is definitively something going not optimal - the accounting of number of waits should be the most light weight and should not bring a such important performance degradation!.. - it's seen with a similar "show mutex" within InnoDB and there is no reason why it cannot be done within Performance Schema too..
- However, if I can believe what I see - the wait numbers are very interesting here :-) Because LOCK_open & MDL are still here ;-) and curiously disabled query cache too ;-)
Now.. - What if the main problem is coming from the hottest "kernel mutex"?.. Let's disable accounting just on the "kernel mutex" and see how it'll change things:
mysql> update SETUP_INSTRUMENTS set ENABLED = 'YES', TIMED = 'YES';
Query OK, 217 rows affected (0.00 sec)
Rows matched: 217  Changed: 217  Warnings: 0

mysql> update SETUP_INSTRUMENTS set ENABLED = 'NO', TIMED = 'NO' where NAME like '%kernel_mutex%';
Query OK, 1 row affected (0.00 sec)
Rows matched: 1  Changed: 1  Warnings: 0
The new result is here:

Observations:
- The result is not really better (or just slightly better) - still around of 15.000 TPS
- That means the performance impact is somewhere inside of the mutex instrumentation globally within Performance Schema..
And what are the top 7 waits now?..
mysql> select EVENT_NAME, COUNT_STAR, SUM_TIMER_WAIT
from EVENTS_WAITS_SUMMARY_BY_EVENT_NAME
where count_star > 0 order by 3 desc limit 7;
+---------------------------------------------------------+------------+-----------------+
| EVENT_NAME                                              | COUNT_STAR | SUM_TIMER_WAIT  |
+---------------------------------------------------------+------------+-----------------+
| wait/io/file/innodb/innodb_log_file                     |   18687653 | 328447818062000 |
| wait/synch/mutex/innodb/buf_pool_mutex                  |   82809405 | 122379714665884 |
| wait/synch/mutex/sql/MDL_map::mutex                     |   35427655 | 100051628180218 |
| wait/synch/mutex/sql/LOCK_open                          |   69335282 |  38925098359264 |
| wait/synch/mutex/innodb/buffer_block_mutex              |  148084516 |  21364777588960 |
| wait/synch/mutex/sql/LOCK_global_read_lock              |   50918129 |  14015063815792 |
| wait/synch/mutex/sql/Query_cache::structure_guard_mutex |   25459066 |  10364875712542 |
+---------------------------------------------------------+------------+-----------------+
7 rows in set (0.00 sec)
Observations:
- The top wait time now is on redo log writes (and I'm curious to understand if it's really true.. - because I've used innodb_flush_log_at_trx_commit=2 setting and my redo log files are placed on SSD volume.. - will be interesting to observe if it'll be still similar if I'll use a RAM disk instead ;-))
- Curiously MDL+LOCK_open wait time is not far from buffer pool mutexes - probably it's still need to be improved..
- Anyway, it's quite positive to bring to the light other waits than InnoDB mutexes - it's the part of puzzle which was always missed before, and now we may compare servers as apples to apples without platform dependency! ;-)
So far, what can be improved here?..
Performance and Instrumentation
Usually performance analyzing and application tracing/instrumentation are very often going together. Because if you really need to understand what's going wrong inside of your application you need to trace it. From the other hand, if your tracing solution has an important impact on performance - very quickly you'll no more able to confirm you're tracing a real problem, or a problem may just may be gone due tracing as some critical parts will run slower and not making contention anymore, etc...
Let's start with a dumb example :-)
Here is a dumb C code I'm using usually to explain a potential impact of DTrace while tracing an unknown binary:
#include <stdio.h>

#define MAX  20000
#define LOOP 100000

main( int argc, char *argv[])
{
 int i;
 long t1, t2;

 printf( "My PID: %d\n", getpid() );
 sleep( 15 );
 puts( "Start.." );

 time( &t1 );
 for( i= 0; i < MAX; i++ )  fun();
 time( &t2 );

 printf( "Time: %d sec.\n", t2 - t1 );
}

fun()
{
 f1(); f2(); f3(); f4(); f5();
}

f1() { int i,n; for( n= 0; n < LOOP; n++ ) i*= n; }
f2() { int i,n; for( n= 0; n < LOOP; n++ ) i*= n; }
f3() { int i,n; for( n= 0; n < LOOP; n++ ) i*= n; }
f4() { int i,n; for( n= 0; n < LOOP; n++ ) i*= n; }
f5() { int i,n; for( n= 0; n < LOOP; n++ ) i*= n; }
This program has no real goal :-) It just execute function "fun()" MAX times. Then function "fun()" executes functions f1,f2..f5 - each of them is just doing LOOP times a loop on multiplication. So int total there will be executed a number of loops equal to: MAX * 5 * LOOP. And from the application point of view nothing will be changed if I'll increase the MAX by 10 and decrease the LOOP value by 10 too - there will be still the same number of loops executed, and the execution time will not vary to much due such changes..
Now let's see what will happens if I'll trace this program with DTrace supposing I have no idea what this program binary is doing and just want to discover what kind of functions are executed inside, how often, and how much time we spent inside..
I'll use the following (classic) DTrace script here:
#!/usr/sbin/dtrace -s

pid$1:a.out::entry
{
 self->t[probefunc]= timestamp;
}

pid$1:a.out::return
/self->t[probefunc]/
{
 elapsed= timestamp - self->t[probefunc];
 @s[probefunc]= sum(elapsed);
 @c[probefunc]= count();
 self->t[probefunc]= 0;
}
Script is just taking a PID as argument, and then by Control-C is printing the list of functions called (how many times, and a time spent within each function). The program is printing its PID on the start and waits 15 sec to leave me a time to start DTrace script before it will start looping :-)
So far, without tracing, the program is taking 31 sec to execute on my old AMD box. And 32 sec under DTrace script tracing. Well, 32 vs 31 sec is not too much, right? Let's see now how the time will be changed if I'll change MAX and LOOP values:
| MAX | LOOP | Normal Time | Under tracing |
| 20000 | 100000 | 31 sec | 32 sec |
| 200000 | 10000 | 31 sec | 37 sec |
| 2000000 | 1000 | 32 sec | 73 sec |
| 20000000 | 100 | 32 sec | 372 (!) sec |
As you cant see, in worse cases the binary took over x2 times, then over x10 (!) times more to do the same work!... - Why?.. - just because the code added on the fly by DTrace instrumentation has a cost! - and by reducing the time we stay inside of the each function we amplified it by so much!..
Of course, we may also simplify the trace script and trace only call numbers:
#!/usr/sbin/dtrace -s

pid$1:a.out::entry
{
 @c[probefunc]= count();
}
But the thing will still not be too much better - in the worst case instead of 372 sec we'll get 122 sec, so still near x4 times slower than a normal execution time of the same program!
While DTrace is an absolutely great tool, in the current case you have to understand what you're doing - you're introducing additional instructions into your code, and more short the portion of your code will be - more important performance impact you'll see! Dtrace has no idea about your binary. But if you have - you may do it in right way :-)
For example here a simple adding of counter++ inside of each function should not bring any important slow down on execution :-))
Now what about MySQL and Performance Schema?..
MySQL is not an unknown binary for Performance Schema instrumentation :-) so it can be done in much more lightweight way comparing to the previously presented observations!
For example if we take "kernel_mutex" - in many places it's called just to protect one or few instructions! (well, probably the usage of this mutex should be also optimized :-)) but we're speaking about tracing and instrumentation for the moment :-))
So, how the things may be changed?..
Counters - The first step should be done on accounting of the number of events - there is nothing more lightweight than a simple "count++" :-)) and there are many currently already introduced here and there inside of the MySQL code as well every storage engine. These all counters should be remapped to the same place to avoid to count the same information twice and should be always accounted, without regarding if Performance Schema is enabled or not! Keep in mind that operation:
if( tracing ) count++;
is more costly rather simple:
count++;
That's why counters should be always available without any check condition - it gives a lower performance impact :-))
Another point - it'll be also fine to have not only a number of waits, but also a number of access/calls (it'll be probably just another count++ in another place, but will give a great overview of many other issues: which file/table is accessed more than others, which mutexes are the most involved, etc.)...
Time accounting - as you saw previously, having a high number of some wait events is not yet meaning we found the source of performance problem.. - some other events may have lower wait numbers, but way more high summary wait time! - and in many cases timing is the only way to find the real source of the problem. From the other hand, time measurement is much more costly than a simple counter. So this operation should be checked first by the "IF" condition (as it's done currently) and executed on demand for each event if its TIMED setting is set to YES (as it's done currently)..
Aggregation - is very useful, but may be very costly as well :-) so should be re-viewed and re-optimized again.. - in many cases aggregation may be done on demand and during the query execution (for ex. for permanently presented objects like mutexes/ files/ etc)..
Performance Schema access - currently we may access performance
data and execute an SQL query only via a normal MySQL session.. - means
we're in the same wait queue with other sessions to execute our query.
I'll be much better to have say a dedicated port for Perf queries to
access data in priority, or via SHM (as it made in Oracle for ex.) and
access perf data live without introducing any activity into MySQL server
processing (it'll be the most clean solution).
Call to action :-)
I think currently we're missing feedbacks from real tests / workloads whenever it's possible:
- What kind of performance impact do you observe on your workload when Performance Schema is enabled?..
- Are the numbers you're observing via Performance Schema reflecting your activity right?..
- What kind of information you're missing?..
- Etc. etc. etc. :-)
Any comments are welcome! :-)
Monday, 03 May, 2010
MySQL Performance: Improving Stability
Huge performance improvement was came with MySQL 5.5.4, and looking on the following picture it's very easy to see why:
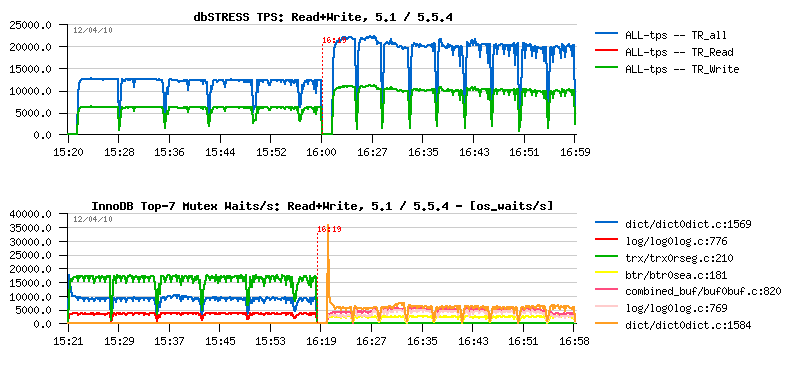
It's a one hour Read+Write dbSTRESS workload with 32 sessions running non-stop on 16 cores server. The left part of the picture corresponds to MySQL 5.1 activity, and the right one to MySQL 5.5.4. The first graph represents TPS levels, and the second one - the mutex waits observed during each test.
Even without going in details you may see how dramatically were reduced mutex waits! And I would say one of the greatest InnoDB features was a compact presentation of the "show innodb mutex" output which gave the way to monitor InnoDB more in depth and understand its contentions on each workload! - it's still not perfect, but anyway a big step ahead :-) and helped a lot to improve 5.5.4.
From the mutex waits graph you may see that the most hot "visible" contention now is on the index mutex (well, the output "file:line" is probably better for debugging rather a normal use - it's one of the things to improve here, just to be more human friendly and show a mutex name instead, as well the code is already there and require a small format changes)..
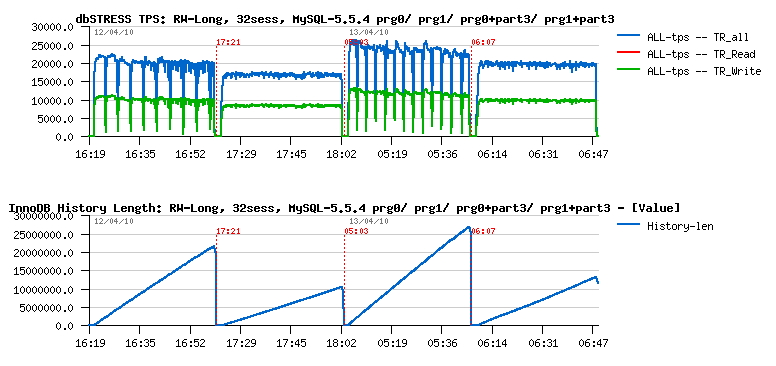
From the other side, purge lagging is another problem - you may see the same (apples to apples) workload on MySQL 5.1, MySQL 5.5.4 and XtraDB 9.1:
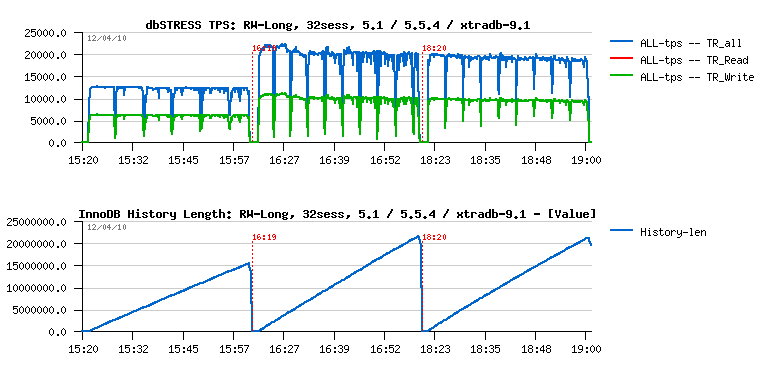
The first graph is still representing the TPS level, and it's interesting to see the potential performance gap between 5.5.4 and XtraDB during the first 10-15 min of test (and if we stop the test here we'll simply miss the next problem and will not see decreasing performance with a time on both engines due purge lagging..). The second graph represents the InnoDB history length, and as you may see it's growing now even faster than before! :-) And the problem is supposed to be fixed with a purge thread.. But let's get a look on one problem at a time :-)
Index Mutex Contention
It'll be great just to get it fixed ;-) But as you know, an simple way to reduce contention on a single mutex is to split this mutex into several ones (so you'll split your contention too, and instead of having say a one single session working at a time - you'll have several sessions working, etc.). And currently MySQL has a nice feature - PARTITIONS! :-) By using partitions on a table having index mutex contentions will simply split this contention by number of partitions! (for example using 3 partitions will physically split your table into 3 tables (even you'll still see it as a single one), and instead of one index mutex you'll have 3 mutexes as well dividing your contention by 3 probably too :-))
However on the next picture you may see the performance impact on 5.5.4 by using 3 partitions on the hottest table during the same Read+Write workload as before:
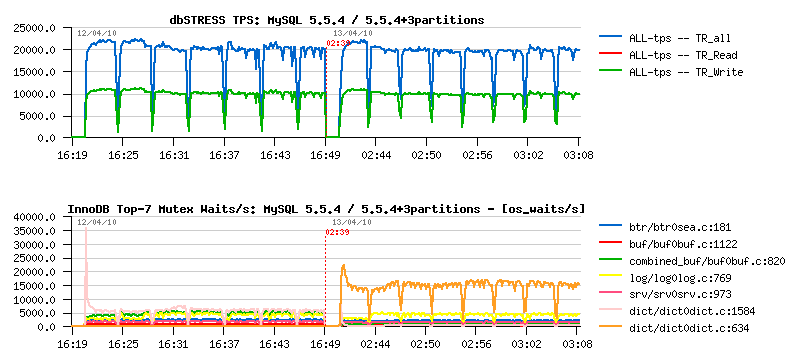
As you may see, curiously TPS level did not change... And we may suppose that partitions would not help here if we did not have improved mutex status within InnoDB and did not see there is another mutex waits jumped to the top and become more hot once we used 3 partitions! (while index mutex was really readuced! - that's why monitoring is so important :-))
What about this new mutex waits? - this is a dictionary lock on stats update. The fix was already proposed by Percona, and is not yet present in the current 5.5.4 tree - but as it's just a one line changes I've tried to see what if it'll be done on 5.5.4:
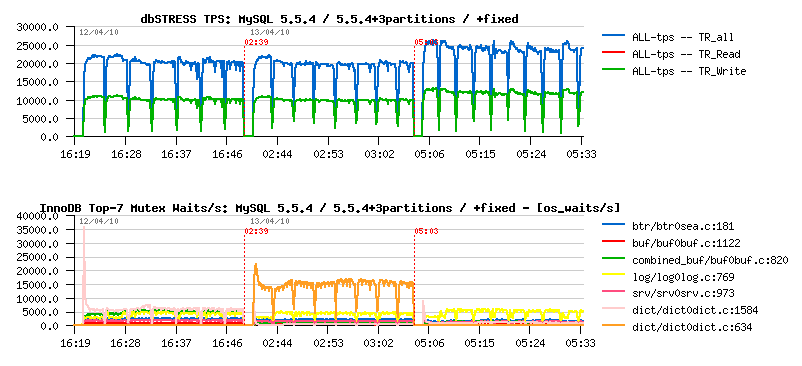
As you can see, the TPS level is improved! (over 20% gain!), and the main "visible" mutex waits are now on the redo logs - which may probably be considered as expected contention for a database in general :-)
But where we're with a history length now?..
Purge Lagging
Now let's get a look on the same workload but from the stability perspective.. Having constantly growing history length is not normal and quite dangerous! As well having periodic performance drops is not better too :-) And the Purge Thread feature is the answer here. But let's look in details how it'll help - the following picture represents the same workload tested on:
- MySQL 5.5.4
- MySQL 5.5.4 +purge thread
- MySQL 5.5.4 +3 partitions
- MySQL 5.5.4 +3 partitions +purge thread
The first graph is TPS, the second one is History length:
As you may see, Purge Thread brings an important stability to the workload. However a single purge thread is no more enough to follow a purge demand here!..
Currently 5.5.4 implementation allows only one purge thread for the moment. But to analyze a performance impact we may try XtraDB which already allows several purge threads. The following picture represents the same Read+Write workload running on XtraDB 9.1 using 3 partitions and tested:
- without purge thread
- with 1 purge thread
- with 2 purge threads
The first graph represents TPS level, and the second one History length:
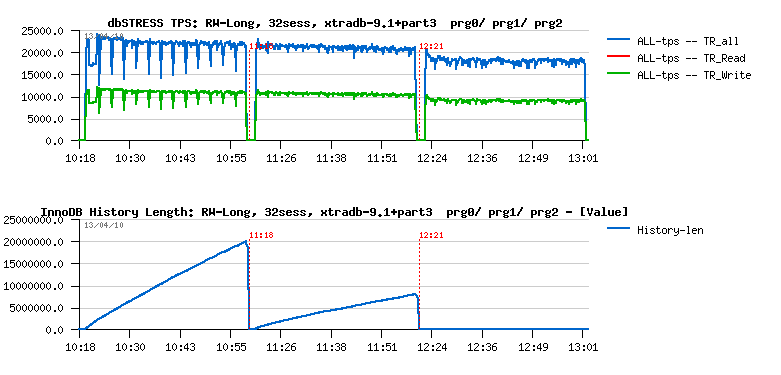
As you may see having 2 purge threads are completely removing purge lagging here! However it's also significantly reducing performance..
Can do we better here?.. - let's try ;-)
For a long time InnoDB has a purge lag configuration option - you can limit purge lagging with innodb_max_purge_lag by setting it to some acceptable level of History length, then once this limit will be reached InnoDB will slightly slow down all arriving DML queries by doing a short sleep (few ms) before processing a query statement. The feature itself is not bad, and many file systems are having a similar solution to throttle a high demand write requests. The only problem with InnoDB purge lag feature that it's broken seems to me, and I've explained why and how to fix it . Now if I apply the fix to XtraDB and see the result ;-)
What I'm interesting here is to compare:
- single purge thread + fixed purge lag
- two purge threads
Of course fixed purge lag without purge thread cannot give us a stable result due all missed maintenance work missed by Master thread (as explained in the previous post ). However, having one purge thread and throttling writes via max purge lag setting may still give a better result than having 2 purge threads..
On the following picture you may see the same Read+Write workload running on XtraDB 9.1 and now comparing:
- XtraDB without purge thread
- XtraDB with a single purge thread
- XtraDB with 2 purge threads
- XtraDB with a single purge thread + fixed max purge lag
The innodb_max_purge_lag was set to 400K here:
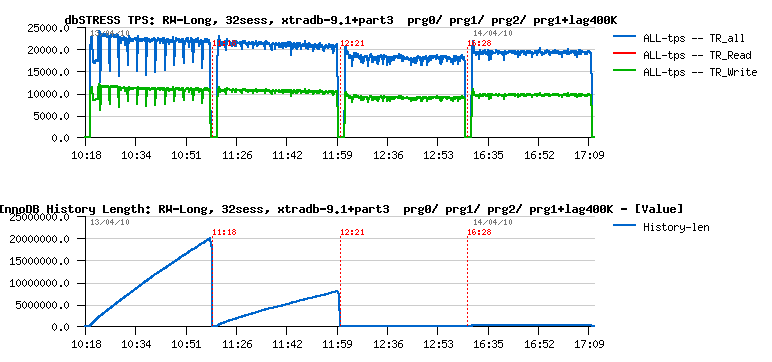
As you see, the tandem of single purge thread + fixed purge lag gives a better result here than 2 purge threads - TPS level is higher while History length is constantly kept under 400K! :-)
Why on my point of view such a solution will be more optimal?
- in many cases one purge thread will be probably just enough
- however when it'll be not enough - your server will still be protected by the max purge lag setting!
As always, many things depends on workload, and your experience may be different of mine.. - but tests and observations will be done, better MySQL performance will be with a time :-)
Any comments are welcome! ;-)