« November 2012 | Main | September 2012 »
Tuesday, 23 October, 2012
MySQL Performance: Linux I/O and Fusion-io
This article is following the previously
published investigation about I/O limitations on Linux and also
sharing my data from the steps in investigation of MySQL/InnoDB I/O
limitations within RW workloads..
So far, I've got in my hands a
server with a Fusion-io card and I'm expecting now to analyze more in
details the limits we're hitting within MySQL and InnoDB on heavy
Read+Write workloads. As the I/O limit from the HW level should be way
far due outstanding Fusion-io card performance, contentions within
MySQL/InnoDB code should be much more better visible now (at least I'm
expecting ;-))
But before to deploy on it any of MySQL test
workloads, I want to understand the I/O limits I'm hitting on the lower
levels (if any) - first on the card itself, and then on the filesystem
levels..
NOTE : in fact I'm not interested here in the
best possible "tuning" or "configuring" of the Fusion-io card itself --
I'm mainly interested in the any possible regression on the I/O
performance due adding other operational levels, and in the current
article my main concern is about a filesystem. The only thing I'm sure
in the current step is to not use CFQ I/O scheduler (see previous
results), but rather NOOP or DEADLINE instead ("deadline" was used
within all the following tests).
As in the previous I/O testing,
all the following test were made with IObench_v5 tool. The server I'm
using has 24cores (Intel Xeon E7530 @1.87GHz), 64GB RAM, running Oracle
Linux 6.2. From the filesystems In the current testing I'll compare only
two: EXT4 and XFS. EXT4 is claiming to have a lot of performance
improvements made over the past time, while XFS was the most popular
until now in the MySQL world (while in the recent tests made by Percona
I was surprised to see EXT4 too, and some other users are claiming to
observe a better performance with other FS too.. - the problem is that I
also have a limited time to satisfy my curiosity, that's why there are
only two filesystems tested for the moment, but you'll see it was
already enough ;-))
Then, regarding my I/O tests:
- I'm testing here probably the most worse case ;-)
- the worst case is when you have just one big data file within your RDBMS which become very hot in access..
- so for a "raw device" it'll be a 128GB raw segment
- while for a filesystem I'll use a single 128GB file (twice bigger than the available RAM)
- and of course all the I/O requests are completely random.. - yes, the worse scenario ;-)
- so I'm using the following workload scenarios: Random-Read (Rrnd), Random-Writes (Wrnd), Random-Read+Write (RWrnd)
- same series of test is executed first executed with I/O block size = 4KB (most common for SSD), then 16KB (InnoDB block size)
- the load is growing with 1, 4, 16, 64, 128, 256 concurrent IObench processes
-
for filesystem file acces options the following is tested:
- O_DIRECT (Direct) -- similar to InnoDB when files opened with O_DIRECT option
- fsync() -- similar to InnoDB default when fsync() is called after each write() on a given file descriptor
- both filesystems are mounted with the following options: noatime,nodiratime,nobarrier
Let's start with raw devices first.
RAW Device
By the very first view, I was pretty impressed by the Fusion-io card I've got in my hands: 0.1ms latency on an I/O operation is really good (other SSD drives that I have on the same server are showing 0.3 ms for ex.). However thing may be changes when the I/O load become more heavy..
Let's get a look on the Random-Read:
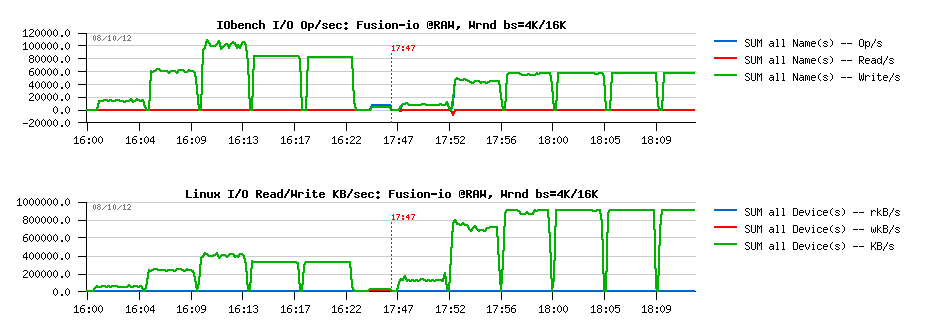
Random-Read, bs= 4K/16K :

Observations :
- left part of the graphs representing I/O levels with block size of 4K, and the right one - with 16K
- the first graph is representing I/O operations/sec seen by the application itself (IObench), while the second graph is representing the KBytes/sec traffic observed by OS on the storage device (currently Fusion-io card is used only)
- as you can see, with 4K block size we're out-passing 100K Reads/sec (and in peak even reaching 120K), and keeping 80K Reads/sec on a higher load (128, 256 parallel I/O requests)
- while with 16K the max I/O level is around of 35K Reads/sec, and it's kept less or more stable with a higher load too
- from the KB/s graph: seems with the 500MB/sec speed we're not far from the max I/O Random-Read level on this configuration..
Random-Write, bs= 4K/16K :
Observations :
- very similar to Random-Reads, but on 16K block size showing a twice better performance (60K Reads/s), while 100K is the peak on 4K
- and the max I/O Write KB/s level seems to be near 900MB/sec
- pretty impressive ;-)
Random-RW, bs= 4K/16K :

Observations :
- very interesting results: in this test case performance is constantly growing with a growing load!
- ~80K I/O Operations/sec (Random RW) for 4K block size, and 60K for 16K
- max I/O Level in throughput is near 1GB/sec..
Ok, so let's summarize now the max levels :
- Rrnd: 100K for 4K, 35K for 16K
- Wrnd: 100K for 4K, 60K for 16K
- RWrnd: 78K for 4K, 60K for 16K
So, what will change now once a filesystem level is added to the storage??..
EXT4
Random-Read, O_DIRECT, bs= 4K/16K :

Observations :
- while 30K Reads/sec are well present on 16K block size, we're yet very far from 100K max obtained with 4K on raw device..
- 500MB/s level is well reached on 16K, not on 4K..
- the FS block size is also 4K, and it's strange to see a regression from 100K to 70K Reads/sec on 4K block size..
While for Random-Read access it doesn't make sense to test "fsync() case" (the data will be fully or partially cached by the filesystem), but for Random-Write and Random-RW it'll be pretty important. So, that's why there are 4 cases represented on each graph containing Write test:
- O_DIRECT with 4K block size
- fsync() with 4K block size
- O_DIRECT with 16K block size
- fsync() with 16K block size
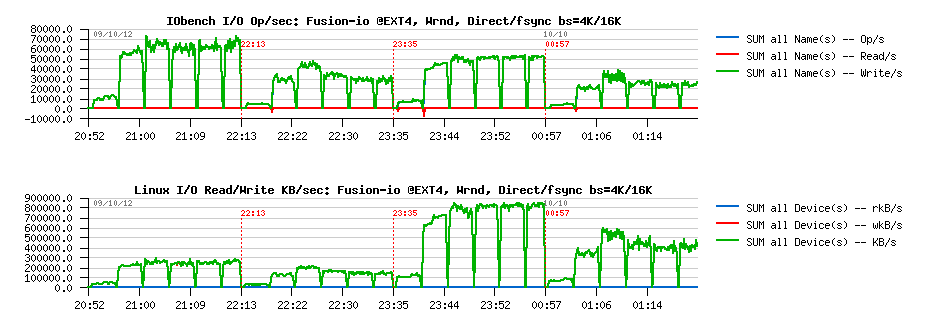
Random-Write, O_DIRECT/fsync bs= 4K/16K :

Observations :
- EXT4 performance here is very surprising..
- 15K Writes/s max on O_DIRECT with 4K, and 10K with 16K (instead of 100K / 60K observed on raw device)..
- fsync() test results are looking better, but still very poor comparing to the real storage capacity..
- in my previous tests I've observed the same tendency: O_DIRECT on EXT4 was slower than write()+fsync()
Looks like internal serialization is still taking place within EXT4. And the profiling output to compare why there is no performance increase on going from 4 I/O processes to 16 is giving the following:
EXT4, 4proc, 4KB, Wrnd: 12K-14K writes/sec :

             samples  pcnt function                                                            DSO
             _______ _____ ___________________________________________________________________ ______________

             1979.00 14.3% intel_idle                                                          [kernel]
             1530.00 11.1% __ticket_spin_lock                                                  [kernel]
             1024.00  7.4% ifio_8f406.db9914f4ba64991d41d2470250b4d3fb4c6.3.1.5.126            [iomemory_vsl]
              696.00  5.0% native_write_cr0                                                    [kernel]
              513.00  3.7% ifio_strerror                                                       [iomemory_vsl]
              482.00  3.5% native_write_msr_safe                                               [kernel]
              444.00  3.2% kfio_destroy_disk                                                   [iomemory_vsl]
...


             samples  pcnt function                                                            DSO
             _______ _____ ___________________________________________________________________ ______________

              844.00 12.2% intel_idle                                                          [kernel]
              677.00  9.8% ifio_8f406.db9914f4ba64991d41d2470250b4d3fb4c6.3.1.5.126            [iomemory_vsl]
              472.00  6.9% __ticket_spin_lock                                                  [kernel]
              264.00  3.8% ifio_strerror                                                       [iomemory_vsl]
              254.00  3.7% native_write_msr_safe                                               [kernel]
              250.00  3.6% kfio_destroy_disk                                                   [iomemory_vsl]


EXT4, 16proc, 4KB, Wrnd: 12K-14K writes/sec :

             samples  pcnt function                                                            DSO
             _______ _____ ___________________________________________________________________ ______________

             1600.00 16.1% intel_idle                                                          [kernel]
              820.00  8.3% ifio_8f406.db9914f4ba64991d41d2470250b4d3fb4c6.3.1.5.126            [iomemory_vsl]
              639.00  6.4% __ticket_spin_lock                                                  [kernel]
              543.00  5.5% native_write_cr0                                                    [kernel]
              358.00  3.6% kfio_destroy_disk                                                   [iomemory_vsl]
              351.00  3.5% ifio_strerror                                                       [iomemory_vsl]
              343.00  3.5% native_write_msr_safe                                               [kernel]
Looks like there is no difference between two cases, and EXT4 is just going on its own speed.
Random-RW, O_DIRECT/fsync, bs= 4K/16K :

Observations :
- same situation on RWrnd too..
- write()+fsync() performs better than O_DIRECT
- performance is far from "raw device" levels..
XFS
Random-Read O_DIRECT bs= 4K/16K :

Observations :
- Rrnd on XFS O_DIRECT is pretty not far from raw device performance
- on 16K block size there seems to be a random issue (performance did not increase on the beginning, then jumped to 30K Reads.sec -- as the grow up happen in the middle of a test case (64 processes), it makes me thing the issue is random..
However, the Wrnd results on XFS is a completely different story:
Random-Write O_DIRECT/fsync bs= 4K/16K :

Observations :
- well, as I've observed on my previous tests, O_DIRECT is faster on XFS vs write()+fsync()..
- however, the most strange is looking a jump on 4 concurrent I/O processes following by a full regression since the number of processes become 16..
- and then a complete performance regression.. (giving impression that no more than 4 concurrent writes are allowed on a single file.. - hard to believe, but there is for sure something is going odd ;-))
From the profiler output looking on the difference between 4 and 16 I/O processes we may see that XFS is hitting a huge lock contention where the code is spinning around the lock and the __ticket_spin_lock() function become the top hot on CPU time:
XFS, 4proc, 4KB, Wrnd: ~40K writes/sec :

             samples  pcnt function                                                            DSO
             _______ _____ ___________________________________________________________________ ______________

             3205.00 11.3% ifio_8f406.db9914f4ba64991d41d2470250b4d3fb4c6.3.1.5.126            [iomemory_vsl]
             2217.00  7.8% __ticket_spin_lock                                                  [kernel]
             2105.00  7.4% intel_idle                                                          [kernel]
             1288.00  4.6% kfio_destroy_disk                                                   [iomemory_vsl]
             1092.00  3.9% ifio_strerror                                                       [iomemory_vsl]
              857.00  3.0% ifio_03dd6.e91899f4801ca56ff1d79005957a9c0b93c.3.1.5.126            [iomemory_vsl]
              694.00  2.5% native_write_msr_safe                                               [kernel]
.....
             samples  pcnt function                                                            DSO
             _______ _____ ___________________________________________________________________ ______________

             5022.00 10.7% ifio_8f406.db9914f4ba64991d41d2470250b4d3fb4c6.3.1.5.126            [iomemory_vsl]
             4166.00  8.9% intel_idle                                                          [kernel]
             3298.00  7.0% __ticket_spin_lock                                                  [kernel]
             1938.00  4.1% kfio_destroy_disk                                                   [iomemory_vsl]
             1378.00  2.9% native_write_msr_safe                                               [kernel]
             1323.00  2.8% ifio_strerror                                                       [iomemory_vsl]
             1210.00  2.6% ifio_03dd6.e91899f4801ca56ff1d79005957a9c0b93c.3.1.5.126            [iomemory_vsl]


XFS, 16proc, 4KB, Wrnd: 12K writes/sec :

             samples  pcnt function                                                            DSO
             _______ _____ ___________________________________________________________________ ______________

            96576.00 56.8% __ticket_spin_lock                                                  [kernel]
            17935.00 10.5% intel_idle                                                          [kernel]
             6000.00  3.5% native_write_msr_safe                                               [kernel]
             5182.00  3.0% find_busiest_group                                                  [kernel]
             2325.00  1.4% native_write_cr0                                                    [kernel]
             2239.00  1.3% ifio_8f406.db9914f4ba64991d41d2470250b4d3fb4c6.3.1.5.126            [iomemory_vsl]
             2052.00  1.2% __schedule                                                          [kernel]
              972.00  0.6% cpumask_next_and                                                    [kernel]
              958.00  0.6% kfio_destroy_disk                                                   [iomemory_vsl]
              952.00  0.6% find_next_bit                                                       [kernel]
              898.00  0.5% load_balance                                                        [kernel]
              705.00  0.4% ifio_strerror                                                       [iomemory_vsl]
              679.00  0.4% ifio_03dd6.e91899f4801ca56ff1d79005957a9c0b93c.3.1.5.126            [iomemory_vsl]
              666.00  0.4% __ticket_spin_unlock                                                [kernel]
I did not find any info if there is any way to tune or to limit spin locks around XFS (while it can be on some kernel level as well, and not be related to XFS..)
And situations with RWrnd is not too much different:
Random-RW O_DIRECT/fsync bs= 4K/16K :

Observations :
- O_DIRECT is still better on XFS vs write()+sync()
- RWrnd performance is far from the storage capacities, and at least observed on a raw device
So, looking on all these EXT4 and XFS test results -- it's clear that if in MySQL/InnoDB you have OLTP RW workload which mostly hot on a one particular table (means a single data file if table has no partitions), then regardless all internal contentions you'll already need to resolve within MySQL/InnoDB code, there will be yet a huge limitation coming on the I/O level from the filesystem layer!..
Looks like having a hot access on a single data file should be avoid whenever possible ;-)
TEST with 8 data files
Let's see now if instead of one single 128GB data file, the load will be distributed between 8 files, 16GB in size each. Don't think any comments are needing for the following test results.
You'll see that:
- having 8 files brings FS performance very close the the RAW device level
- XFS is still performing better than EXT4
- having O_DIRECT gives a better results than write()+fsync()
EXT4
Random-Read O_DIRECT bs= 4K/16K :

Random-Write O_DIRECT/fsync bs= 4K/16K :
Random-RW O_DIRECT/fsync bs= 4K/16K :

XFS
Random-Read O_DIRECT bs= 4K/16K :

Random-Write O_DIRECT/fsync bs= 4K/16K :

Random-RW O_DIRECT/fsync bs= 4K/16K :

IMPACT of data file numbers
With 8 data files we're reaching very closely the RAW device performance on write I/O operations, and O_DIRECT option seems to be the must for both EXT4 and XFS filesystems. Let's see now if performance is already better with 2 or 4 data files.
EXT4 : Random-Write O_DIRECT bs=4K data files= 1/ 2/ 4

Observations :
- confirming once more a true serialization on a file access: each result is near twice as better as the previous one without any difference in results with a growing number of concurrent I/O processes..
- so, nothing surprising performance is yet better with 8 data files
EXT4 : Random-Write O_DIRECT bs=16K data files= 1/ 2/ 4

Observations :
- same tendency as with 4K block size
XFS : Random-Write O_DIRECT bs=4K data files= 1/ 2/ 4

Observations :
- only since 4 data files there is no more performance drop since 64 concurrent I/O processes..
- and having 4 files is still not enough to reach RAW performance of the same storage device here
- while it's way better than EXT4..
XFS : Random-Write O_DIRECT bs=16K data files= 1/ 2/ 4

Observations :
- for 16K block size having 4 data files becomes enough
- on 2 files there is a strange jump on 256 concurrent processes..
- but well, with 4 files it looks pretty similar to 8, and seems to be the minimal number of hot files to have to reach RAW performance..
- and near x1.5 times better performance than EXT4 too..
INSTEAD OF SUMMARY
Seems to reach the max I/O performance from your MySQL/InnoDB database on a flash storage you have to check for the following:
-
your data are placed on XFS filesystem (mounted with
"noatime,nodiratime,nobarrier" options) and your storage device is
managed by "noop" or "deadline" I/O scheduler (see previous tests for
details)
-
you're using O_DIRECT within your InnoDB config (don't know yet if
using 4K page size will really bring some improvement over 16K as
there will be x4 times more pages to manage within the same memory
space, which may require x4 times more lock events and other
overheads.. - while in term of Writes/sec potential performance the
difference is not so big! - from the presented test results in most
cases it's only 80K vs 60K writes/sec -- but of course a real result
from a real database workload will be better ;-))
- and, finally, be sure your write activity is not focused on a single data file! - they should at last be more or equal than 4 to be sure your performance is not lowered from the beginning by the filesystem layer!
To be continued...
Any comments are welcome!
Monday, 15 October, 2012
MySQL Performance: InnoDB Buffer Pool Instances in 5.6
NOTE: this article I've started to write yet before summer vacations,
but timing was against me, and I'm able to finish and publish it only
now. While my investigations are continuing, you'll find here the
explanations why Vadim observed unexpected
performance improvements when using a single InnoDB BP instance
rather 8, and some other
things as well..
The InnoDB Buffer Pool (BP) Instances feature was introduced since MySQL 5.5.4 and presented for the first time during MySQL UC2010. This solution was the key point on its time, as without BP instances no one from other newly added great features was able to show any positive impact on performance (as otherwise all the stuff was still remaining blocked on the BP mutex contention (you may find more details about here and here ))..
During MySQL UC2010 we presented the following graph representing TPS levels reached on db_STRESS workload:
Well, you may quickly remark that Adaptive Flushing in MySQL 5.5.4 was not yet really working ;-)
However, there are 4 tests on the graph executed sequentially, but each one with a different number of BP instances:
- #1 -- innodb_buffer_pool_instances=1
- #2 -- innodb_buffer_pool_instances=2
- #3 -- innodb_buffer_pool_instances=4
- #4 -- innodb_buffer_pool_instances=8
And as you can see the difference in TPS between the test #1 and #4 is not far from 50% ;-)
The improvement was huge, and since then within all my next benchmarks I've used 8 or 16 BP instances always "by default" without even looking on impact -- performance may be only better, no? ;-)
However, having several BP instances will not always guarantee that you'll avoid BP mutex contention.. - while the distribution of your data within InnoDB pages may be completely random, your workload activity may still hit manly only a subset of pages which is grouped (by no chance) within the same BP instance!.. And in this case for your workload it'll be likely you have only one instance within your Buffer Pool, which brings the fixed problem once again on the table.. (more details on how to discover if you're hitting this issue is here ).
But since MySQL 5.6 things become much more interesting!.. In MySQL 5.6 we have now not only BP instances (as in 5.5), but also improved page_hash locks which are reducing BP contentions even when some pages become more hot then others, and even if they belong to the same BP instance! And I was able to confirm it during many tests over a time, and on small servers there was even near no difference if you're using one or several BP instances..
So, nothing surprising here that for MySQL 5.6 we're willing to have the innodb_buffer_pool_instances=8 by default, right?.. ;-)
BUT!.. - for my huge surprise, MySQL QA Team reported a performance regression on their DBT2 tests once they are using innodb_buffer_pool_instances=8 instead of innodb_buffer_pool_instances=1.. - and the first thing coming in mind "it's impossible!".. - but by a long benchmarking experience I know that everything is possible ;-)) and the first step to do in such a situation is to be able to reproduce the same or similar issue on a different server (it'll avoid you to check in depth HW and OS setup/impact, etc. etc. - then very quickly you'll be able to focus only on what is really important)..
So far, I was "lucky" here! - as I was able to reproduce the same issue on my, similar to QA server, 12cores (Intel) box, and was facing to the following:
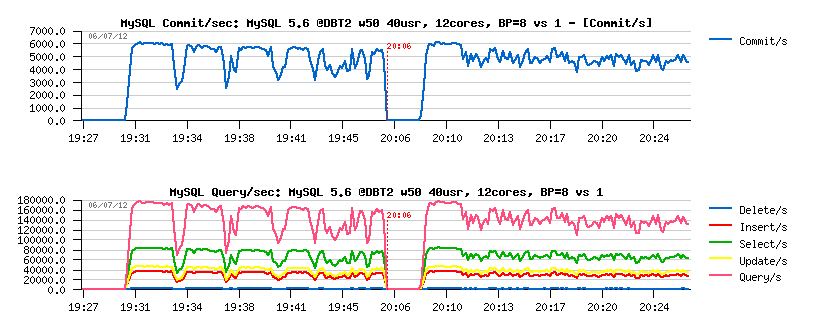
Comments :
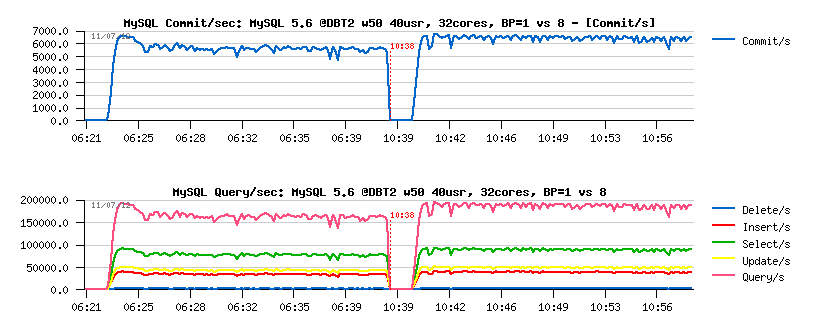
- on the left side there is the result with MySQL 5.6 configured with innodb_buffer_pool_instances=8, and on the right side with innodb_buffer_pool_instances=1
- the workload is DBT2, 50 warehouses, 40 concurrent users
- from the results you can see that in the first case the top level on performance is still higher, but periodic drops in activity making its overall performance lower comparing to the second case... - very comparable to the test results when Adaptive flushing is disabled vs enabled ;-)
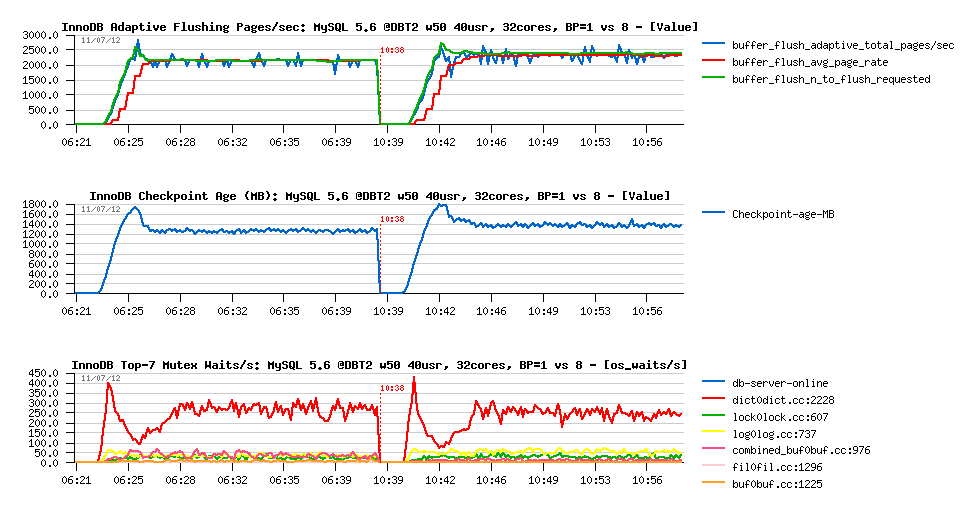
Well, Adaptive Flushing is enabled in both cases for sure, but let's get a look on the flushing activity and Checkpoint Age during this test:
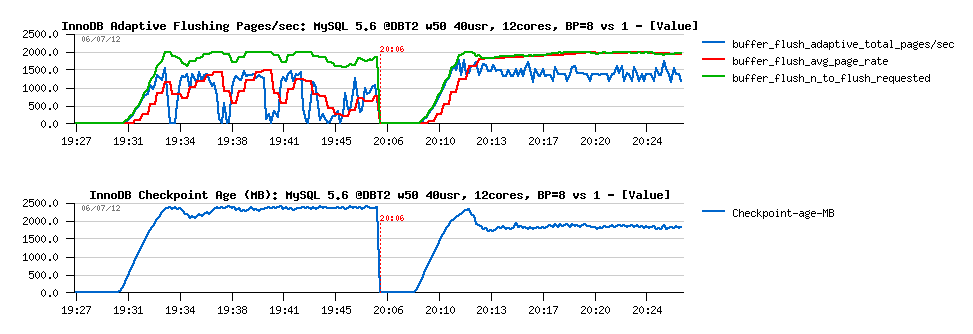
Observations :
- it's clear that the flushing in the first case is not really adaptive (and having drops), while in the second case it's pretty stable and working as expected!..
- then the level of Checkpoint Age is clearly indicating that in the first case we're hitting "sync flushing" most of the time..
- Why?.. - ok, my disks are not very fast on this server, but if the problem was on the storage, it should not be better with a single BP instance either..
- and again, even when we're hitting "sync flushing", since MySQL 5.6 there should be no more killing "furious flushing" as before, because as soon as we have some free space within REDO logs -- user threads will be able to continue to work, and no drops should be observed!..
So, what is wrong here?..
My initial feeling was that there are some differences in the way how flushing is operating when several BP instances are used comparing to a single BP instance.. This feeling finally was correct ;-)) but we spent hours and hours discussing with Inaam (who is our page flushing guru in InnoDB Team) and analyzing the flushing code to find how ever it's possible?.. The only "working" explanation we've found is the following:
- when "sync flushing" is happening, InnoDB will flush sequentially instance by instance dirty pages from the Buffer Pool
- what is new in MySQL 5.6 is that as soon as there will be little bit of free REDO space available, the user threads (sessions) will be able to continue their work!
- but the main difference between single BP instance and several ones is that as soon as sync flushing is started from a single instance - the most oldest pages will be flushed first and very quickly make some free room within REDO space
- while when several BP instance are used, the most oldest page may still remain within one of the BP instances until sync flushing did not finish to flush all previous instances (sequentially), and there will be the turn of the instance keeping the most oldest page!..
Usually to prove such a thing some code tracing should be involved.. But since MySQL 5.6 many things particular to InnoDB are already instrumented within InnoDB METRICS table -- one of these is "flush sync waits" telling if there were some waits on sync flushing by user threads.
Let's get a look on the following graph:
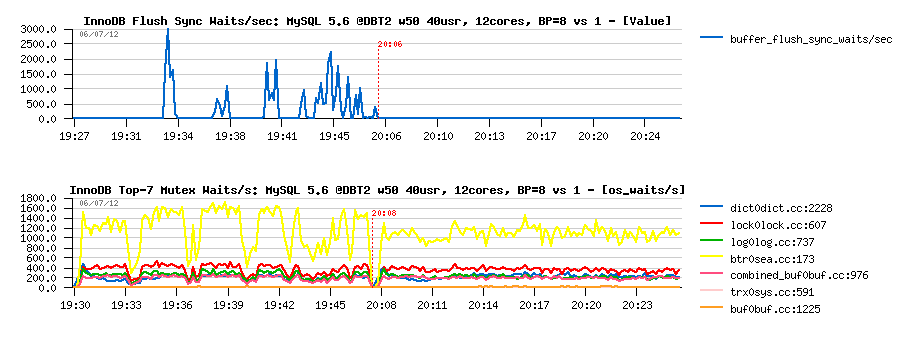
As you can see:
- there were up to 3000 waits/sec when several BP instances were used, and no waits for a single one!
- and note that InnoDB reporting the main waits on the btr_search_latch RW-lock, let's get a look on it later..
So far, at least we found the real explanation to the observed issue! :-)
But now, what about the fix?..
Several ways are possible:
- well, the most appropriate solution here will be to involve a parallel flushing from several BP instances on the same time (but it yet should be well designed as it will involve a per instance double write buffer as well, so it's the way how it should be fixed, but for sure cannot be just available for tomorrow ;-))
- having a faster storage should remove this issue too.. ;-)) but is there any other?..
- we may still try a bigger REDO log space expecting to reduce the page flushing frequency (as it looks like this workload activity may be a good candidate for it)..
The following graphs are representing 2 additional cases more: the same 2 tests executed now with 8GB REDO log space instead of 3GB:
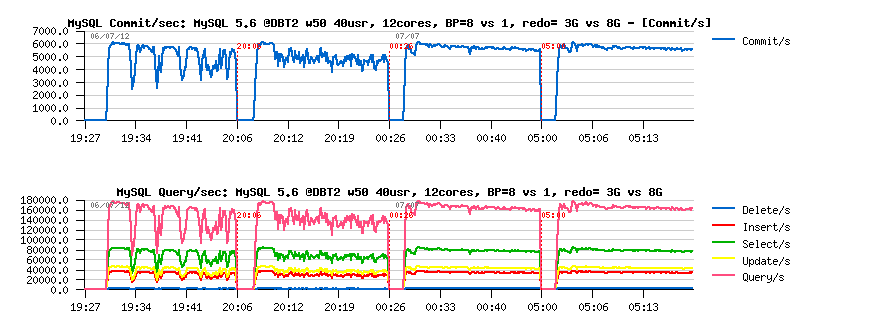
As you can see, there is no QPS drops anymore, regardless if we used 8 BP instances or a single one. Performance is also better, and the next graphs are explaining why:
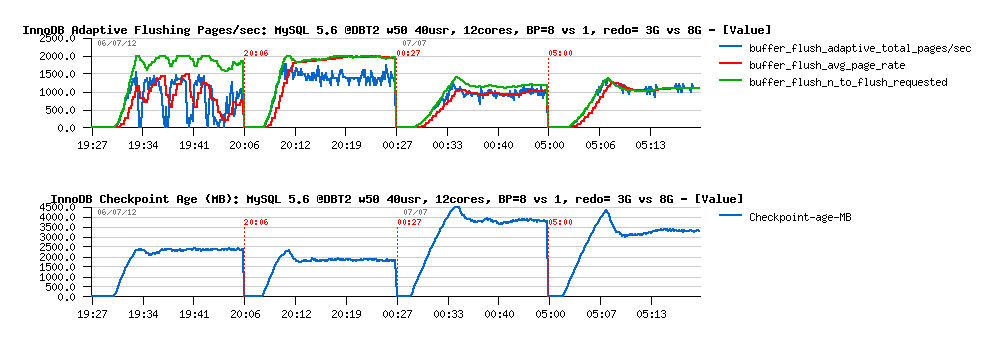
The bigger REDO log space giving a bigger marge for pages flushing:
- more bigger REDO - more longer the page flush can be delayed..
- if during this period the same page was modified more than once - we'll reduce the number of I/O writes (flushes)
- and as you can see, the flushing activity was reduced from 1500 to 1000 pages/sec, which made it matching the storage layer performance capacity limitations, so no QPS drops are present anymore
- as well REDO logs space usage is remaining under 4.5GB and also keeping a sufficient marge for potential spikes in workload activity
OK, looks better now :-)
However, it's still unclear if there is any benefit from using more than one InnoDB Buffer Pool instance in MySQL 5.6.. - seems to me like 12cores server is enough "optimal" (means: small) to observe any BP contentions.. What about 32cores host and with a more powerful storage?..
Same test with 3GB REDO on 32cores server, full SSD:
Observations :
- as you can see, there is no any QPS drops even with 3GB REDO log space
- performance with 8 BP instances is better than with a single instance
- as well and overall performance is better than on 12cores (6500 commit/sec vs 5500 commit/sec before)
And what about flushing?.. Let's see:
Observations :
- flushing is looking pretty stable! and seems like flushing of 2000 pages/sec is the rate required by this workload
- waits on the index lock are reported by InnoDB, however it's hard to understand if they are really important as they are not expressed with time waited, just waits/sec..
Once again, more info from PERFORMANCE SCHEMA:
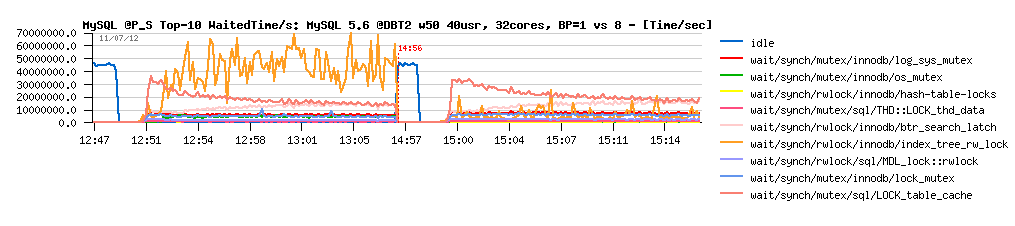
Observations :
- as you can see, to top wait time on the test case with a single BP instance is corresponding to the InnoDB index lock
- and having 8 BP instances is dramatically reduced this wait! - and this explains why performance with 8 BP instance was better..
- while the gain is pretty strange, because BP instances and index lock are completely independent things..
- but the fact is the fact :-) and probably once index lock contention will be fixed, things will become once more different again.. who knows :-)
And then summary vacations arrived...
After vacations I've tried to replay the tests and get a more in depth look to the problem:
- but I was unable anymore to reproduce the same thing ;-)
- seems like my servers also got a very positive rest during a summer time ;-))
- 12cores server with 3GB REDO space did not show any QPS drops anymore..
- Surprise... - storage started to work better than before...
- So, to reproduce the same issue there was an easy way -- simply set the "innodb_io_capacity_max" to 1000 (as at least flush of 1500 pages/sec is required, my MySQL server will be in trouble now to follow the REDO speed, and I'll hit the sync flushing for sure!)..
- Ok, done, and it worked exactly as I've expected ;-)
- Just that I did not expect that in both configurations (1 and 8 BP instances) there will be QPS drops...
- Why?...
- It's good to have vacations to get a more freshly view on the same problem ;-)
- if you'll look now on the very first graphs with Checkpoint Age (when the issue just started), you may see than in case with a single BP instance there was no sync flushing at all ;-) as the Checkpoint Age level is under Max Age limit...
- So, the explanation is still good for several BP instances, but not matching a single one..
- So, why we still have QPS drops during sync flushing even if a single BP instance is used?..
- I've supposed that it's because the flush batch is too long and all threads are waiting too long on it..
- So, I've tried then to reduce the amount of flushed pages within a single loop in batch.. - but it did not help either..
Until then, my only advice will be: don't hit sync flushing in InnoDB and avoid it as much as possible!! That's all.