« MySQL Performance: 5.6 Notes, part 2 - Under full dbSTRESS workload... | Main | MySQL Performance: 5.6 Notes, part 4 - Fixing Purge issue.. »
Monday, 11 April, 2011
MySQL Performance: 5.6 Notes, part 3 - More in depth..
This is the third part of the MySQL 5.6 Performance Notes started from here.
Now let's get more in depth and analyze performance results on more "focused" workload scenarios.. - for the moment MySQL/InnoDB is scaling up on 32 cores and most optimally working with up to 32 concurrent sessions where no any severe contention is not yet happening. So the 32 users workload on 32 cores will enter in the focus in the following part, but this time it's a full troubleshooting rather benchmarking.. ;-))
NOTE: there was a question what is the difference between "Read+UPDATE" vs "Read+Write" test? - "Read+Write" is doing 3 DML queries within a one operation (in reality there are 3 transactions within 1 Write) - DELETE, INSERT and UPDATE. While "Read+UPDATE" is executing only UPDATE query within Write operation, that's why to keep in mind this difference I'm calling it "Read+UPDATE".. - and one moment is very important within an UPDATE query used in this test: it's involving "in place" modification of data and without touching any index, so it fires at once any potential issues (if any) in purge, as there is only UNDO images to purge, and it "plays" with different InnoDB internal contentions as well ;-))
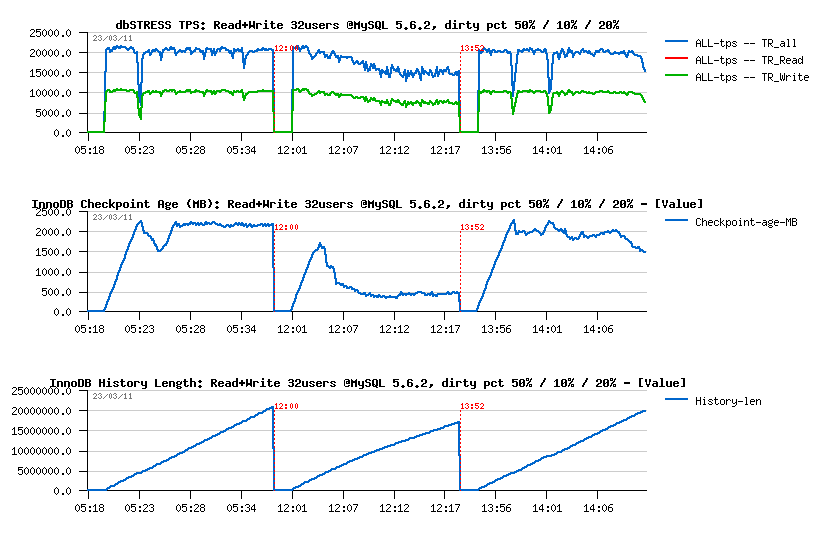
Analyzing Read+Write Workload @32users
Test scenario :
- Workloads: Read-Only (just warmup), Read+Update, Read+Write (Write = Delete + Insert + Update)
- Configurations: 32 cores
- Concurrent users: 32 (running 20min on each RW test, constant load)
- Think time: 0 sec
-
Points of interest :
- there is no yet any serious mutex contention on the 32 users workload, so the main interest here to verify that MySQL/InnoDB is running as expected:
- Checkpoint Age: should remain stable on such a stable workload
- TPS: should remain stable too, no "furious flushing"
- History Length: should remain low (or zero), and in any case should not grow!..
Read+Update Workload :
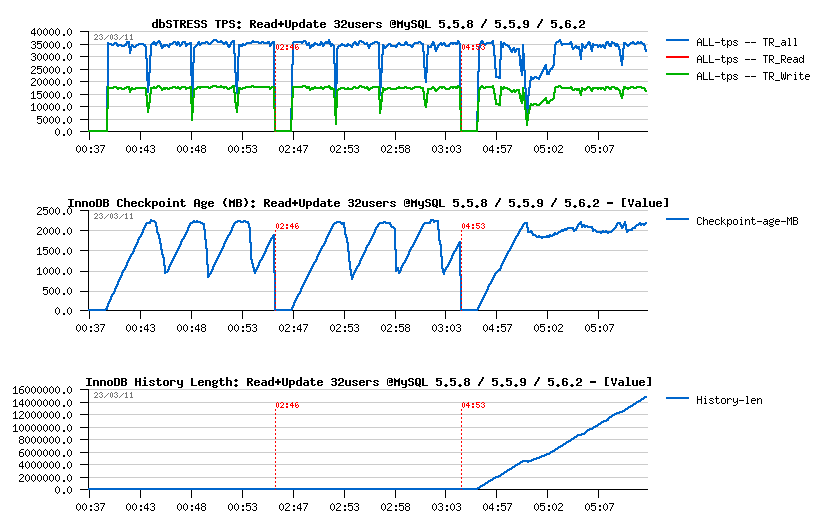 Observations
:
Observations
:
- MySQL 5.5 has constant periodic performance drops due a "furious flushing", while MySQL 5.6 has these drops only on the beginning (but much more severe, and this severity is amplified by the presence of contention on the "log_sys" mutex..) - once it's passed, performance on 5.6 is looking more stable..
- Only 5.6 have a History Length growing here.. - not good at all..
- TPS level looks the same on all engines, but results on 5.6 may be different due a lower purging..
- NOTE: using 2 or 4 purge threads in MySQL 5.6 did not change absolutely nothing..
Read+Write Workload :
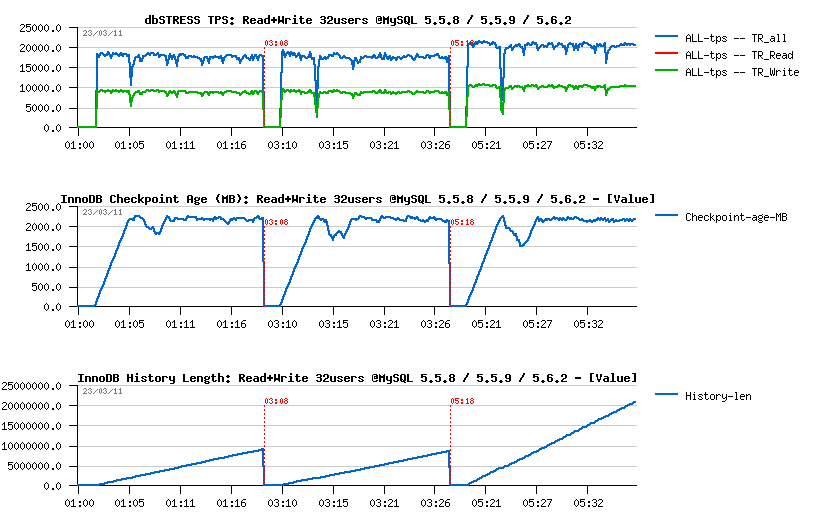 Observations
:
Observations
:
- both MySQL 5.5 and 5.6 having a performance drop on the beginning, this drop is less seen in 5.5.8 comparing to others..
- both 5.5 and 5.6 are having History Length growing, however i nMySQL 5.6 it's growing x2 times faster!! (not good for both)
- TPS level in 5.6 is higher comparing to others, but it's probably just due a lower purging..
- NOTE: using 2 or 4 purge threads in MySQL 5.6 did not change absolutely nothing..
- NOTE: so, after only 20min of activity we reaching a level of 20M(!) records in the History Length! - then, once the test is finished, it takes over 5min of constant aggressive background flushing before the History Length become zero and dirty pages too.. - and to be able to keep all these non-purged data the whole database size after all my tests was increased from 50GB to 72GB.. (near 50% bigger!)
Note about Adaptive Flushing in MySQL 5.5 - since 5.5.6 release the InnoDB adaptive flushing became more "relaxed" comparing to 5.5.4 version, and seems this behavior remain the same up to the MySQL 5.5.9 (and MySQL 5.6 need yet to be investigated).. The "relaxed" nature of the flushing in 5.5.6 I've reported before in my MySQL 5.5 Notes and the following graph explaining very well the issue:
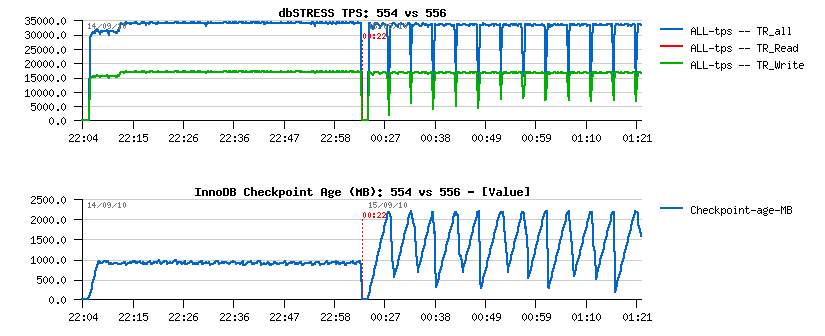
Personally, I'd prefer a more "aggressive" flushing rather "relaxed", but nobody is perfect ;-))
But well, since adaptive flushing is not flushing enough to avoid "furious flushing", we may still increase the flushing by lowering the percentage of dirty pages setting (and again, it'll be more optimal to simply increase the size of the redo log files, but this feature will be available only in the next 5.6 release..)
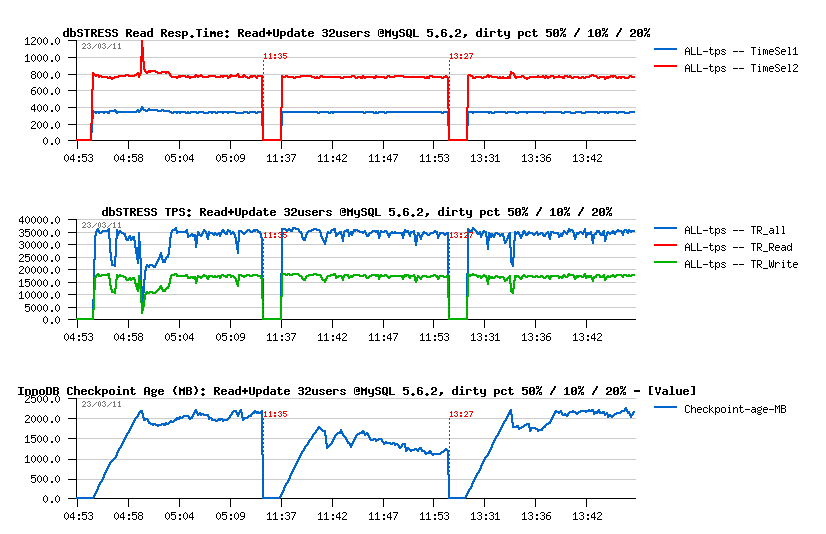
So, my current dirty pages percentage setting is 50%. What if I'll set it now to 10%? then 20%?..
Read+Update :
- 50% was not enough..
- 10% is probably too much..
- 20% is looking better ;-)
Read+Write :
- 50% was finally not so bad.. ;-))
- 10% - is really too much, even performance become worse..
- 20% - not better either..
- NOTE: History Length continues to grow within all tests, not good..
Well, seems like by lowering a dirty pages percentage we may bring more stability in workload, but of course it'll be better to have adaptive flushing working correctly to avoid such a tweaking :-)) Another possible solutions:
- reduce redo logs (it'll involve "furious flushing" more often, but it'll be shorter :-)) and of course performance will be worse (but stable :-)))
- increase redo log files way more (but it'll be possible only since next 5.6 version)..
- well, for the moment lowering dirty pages percentage is looking as more optimal..
Analyzing Purge Activity
Ok, so far and what about this growing History Length?.. - it's looking like we have an issue with a purge processing..
- Having purge thread enabled did not help..
- Having 2 purge threads did not help too..
- Having 4 purge threads did not help either..
So, there is a problem for sure.. And the only solution may help here is to use a "max purge lag" setting. But to make it working a little hacking is needed in the code - just to comment out the check for a presence of consistent read when the max purge lag condition is verified, otherwise it'll be never involved.. (BUG #60776 (http://bugs.mysql.com/bug.php?id=60776)). The idea of this feature is to delay DML statements for some milliseconds if the purging is not fast enough and cannot follow the workload activity (and bigger the lag is, a bigger delay will be used (calculated dynamically))..
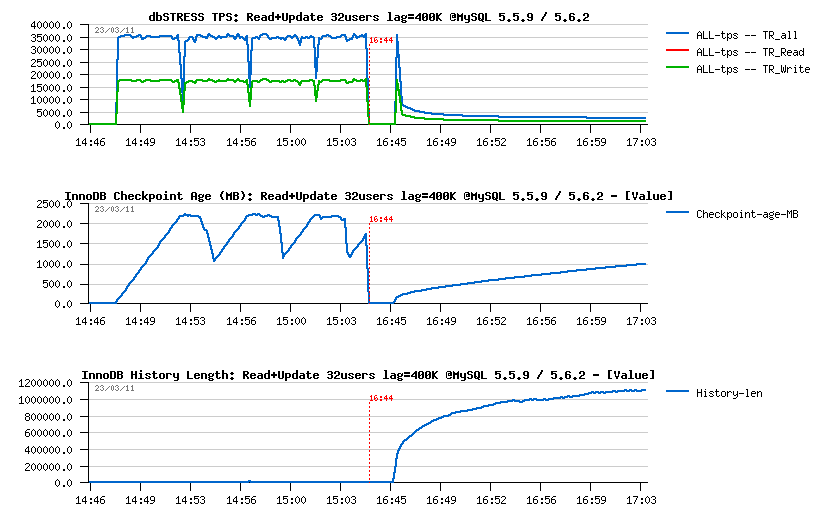
I've "fixed" both MySQL 5.5.9 and 5.6.2 versions, and let's see now what is the result (in all following test I've used innodb_max_purge_lag=400000 (400K is quite big enough "normally", at least it's what I've used before in the previous tests in the past)..
Read+Update :
- There was no purge lagging on MySQL 5.5.9 during this test before, so it did not change anything for 5.5.9
- However, there is a real problem with 5.6.2 - History Length still out-passing 400K, and performance is dramatically dropped..
- As purge lag is continuing to grow in 5.6.2, I may suppose there is a huge problem within a purge code...
Read+Write :
- For MySQL 5.5.9 the "fix" is working: History Length remains stable on 400K, however it's not free - performance was reduced from ~20.000 to ~15.000 TPS.. - it's a price for a "stable" and as expected processing, and that's why any performance result obtained with a constantly growing purge lag should be simply ignored as a result...
- For MySQL 5.6.2 things are much worse again.. - TPS is x20 times lower and purge lag still continue to grow..
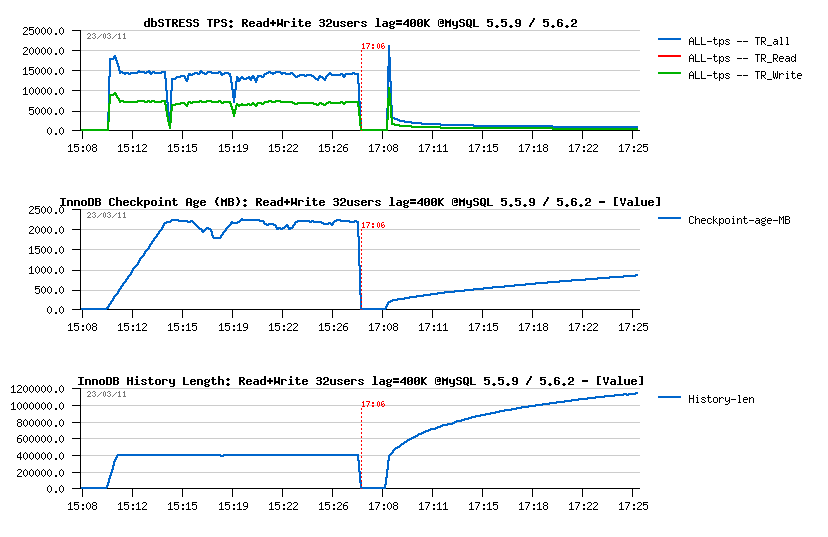
Seems more investigation is needed on the purge implementation within MySQL 5.6. There is a real problem here..
More in depth with Purge and Flushing issues
To get a more close look on the Purge and Flushing issues I'll change my test scenario to the following:
- Configurations: 32 cores
- Concurrent users: 1, 2, 4 .. 32
-
Workload:
- Read-Only (just warmup) but from 1 to 32 users, 4min each step
- Read+Update from 1 to 32 users, 4min each step, then keep 32 users running yet more for 20min
- Read+Write (Writes=Delete, Insert, Update) from 1 to 32 users, 4min each step, then keep 32 users running yet more for 60min
- Think time: 0 sec
-
Points of interest :
- I'm curious to see since which moment flushing and purge problems are appearing (and it'll be more a debugging here rather a testing, but there is no debugging possible without testing either ;-))
- All "key values" to monitor remaining the same (TPS, Checkpoint Age, History Length)
- Then I'll also add some additional stats coming from the newly available InnoDB METRICS table (since 5.6)
Also, in parallel, I've discovered that there may be some background effects due a data blocks moving when I'm testing 5.6 after 5.5 tests (as well it may be just a simple "feeling" without any objective reason :-)) - but anyway, all the following "debug" tests were executed on the freshly restored database from a zero state backup..
Let's get a look on the MSQL 5.5.9 performance first.
Read+Update Debug Workload @MySQL 5.5.9
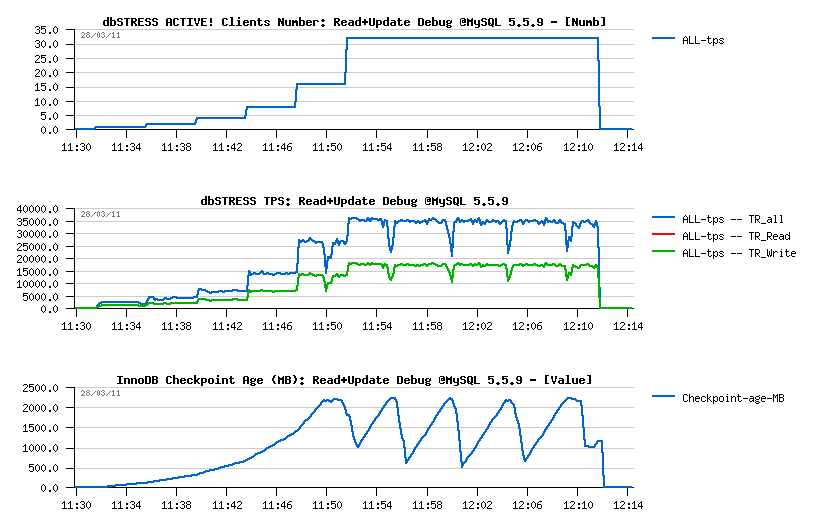
Observations :
- Number of concurrent users (Clients) is growing progressively from 1, 2, ... to 32, and TPS level continue to grow too..
- 35.000 TPS on 32 users as before I've observed last year on another server with 32 cores
- TPS drops are perfectly corresponding to the Checkpoint Age drops when we reaching a critical amount of REDO free space and the "furious" flushing is involved then.. - seems these drops are not having a bigger depth just because my storage is fast enough here..
- Adaptive FLushing is not looking here to be really adaptive.. - even on 16 users it already got its first performance drop.. - need a fix for sure!
Then, from the following graphs:
Observations :
- History Length remains very low and quite stable, so purge is working well..
-
Mutex waits:
- up to 32 concurrent users the main wait is on the "log_sys" mutex
- then since 32 users it's moving to the "btr_search_latch" mutex
- NOTE: once again "btr_search_latch" is present.. - while on this workload UPDATE is executed in place and not changing any indexed field.. - so the contention is coming mainly from the reads (as on the Read-Only workloads before), and once again all the data are already cached within a buffer pool, and there is no more page reads during this workload..
Except the adaptive flushing issue, Read+UPDATE workload still looks fine on MySQL 5.5.9.
Read+Write Debug Workload @MySQL 5.5.9
To make it shorter, I'm presenting 2 results on the same graph
- the first one is obtained with max purge lag configured to zero (default)
- the second one - with max purge lag = 400K (innodb_max_purge_lag=400000), NOTE: you'll need a fix applied from the (#BUG) to get purge lag DML delay working properly..
So far:
Observations :
- Adaptive flushing is still not optimal here, but the TPS drops shorter in depth..
- With a max purge lag=0 the max TPS level is higher, however it's not stable and continuing to decrease over a time from 18.000 to 16.000 TPS.. (interesting that on the "previous" server last year I've obtained 20.000 TPS on 32 users on the same workload)..
- Then having max purge lag=400K gives a lover performance - 14.000 TPS, but more stable result as there was no TPS degradation over a testing period (1 hour for 32 users)..
Then History Length graph is explaining all:
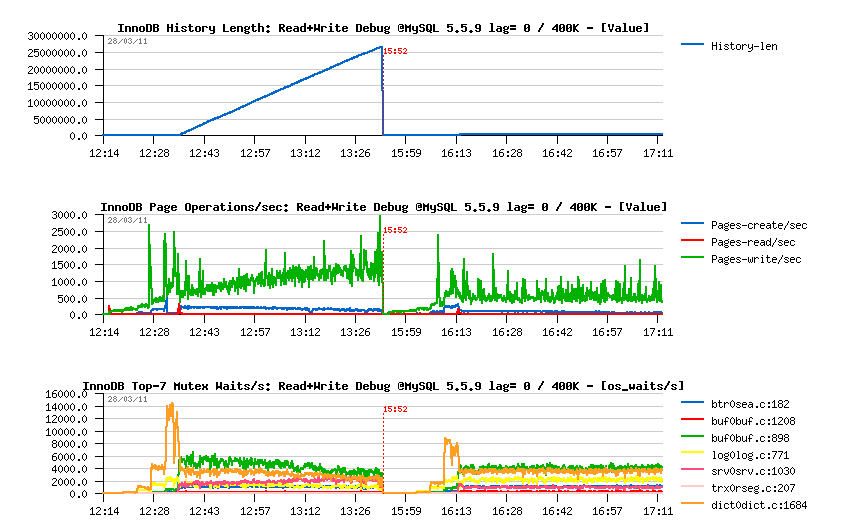
As you see:
- History Length remains stable on 400K during the second test, which is reducing overall work around pages operations..
- Page writes are lower and not growing in the second case too (so a flushing should be also more stable)..
- Interesting that the Mutex Waits pictures are also looking different: while contentions on buffer pool mutex and index mutex are presented in both cases, the second configuration is avoiding a growing contention on the kernel_mutex..
Well, globally using max purge lag=400K is quite benefit is you're not running for an "absolute max" possible performance, but seeking for a stable one like me ;-)) and after all comparing 16.000 TPS and 14.000 TPS it's just little bit more than 10% performance regression, however the gain in stability is simply huge! ;-))
And what about MySQL 5.6 now?..
Few comments first:
- I've increased the buffer pool size from 16G to 32G to avoid any LRU flushing issues during following tests (I'm not tracking it yet, so let's avoid to have more problems than expected ;-))
- New stats about Purge and Flushing activities were added from the InnoDB METRICS table newly integrated into MySQL 5.6
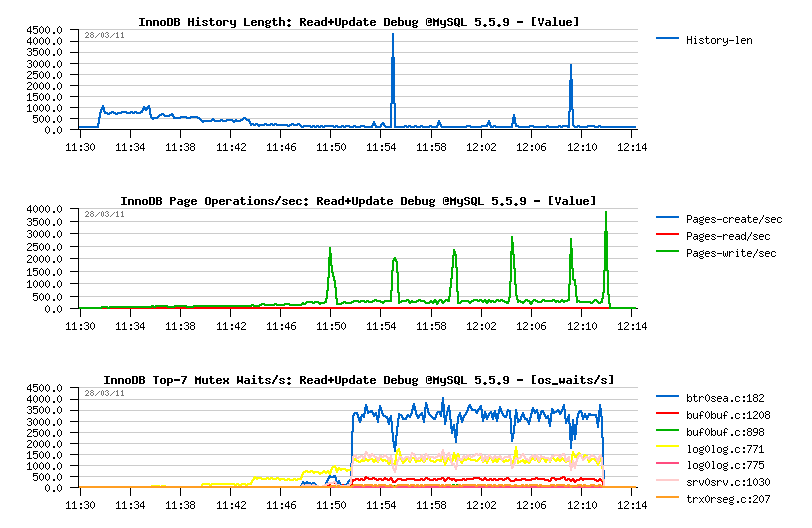
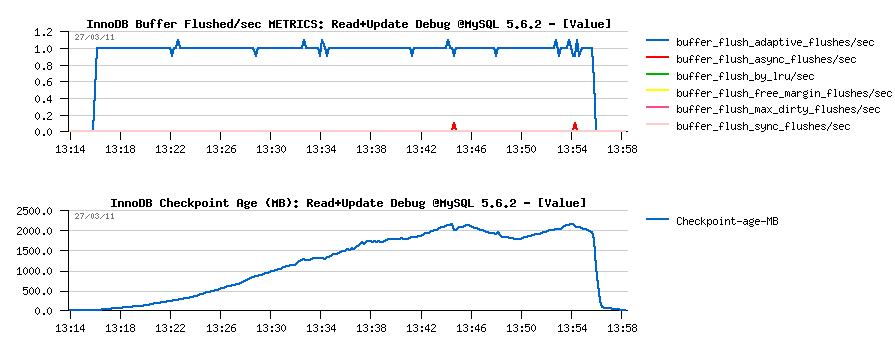
Read+UPDATE Debug Workload @MySQL 5.6.2
- First and very positive surprise - there is no any performance drops on MySQL 5.6.2 under this workload: (looks like using a freshly restored database for 5.6 makes a difference here)
-
And it seems because of the "stable" adaptive flushing - Second
Surprise! :-)
- Checkpoint Age remains low
- Only 2 "async" flushes over all period! (stats are coming from METRICS):
-
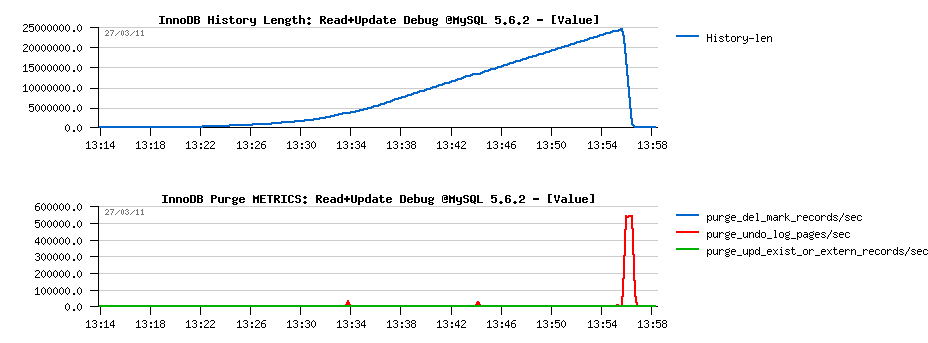
Then the Third, and very negative surprise - Purge is looking
like completely "absent"..
- History Length is constantly growing..
- Pages are manly purged at the end, once the workload is finished..
- It's clearly seen that purged "pages" as only undo log images (as there is no DELETE on this workload) - stats are obtained from the METRICS table:
-
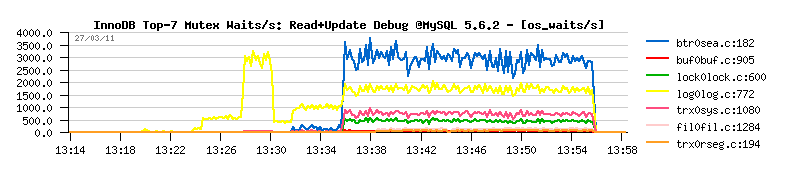
Then regarding Mutex Waits, it looks similar to 5.5.9, except:
- the "kernel_mutex" waits are no more present now..
- "log_sys" mutex is more seen now (normal)
- and interesting that "btr_search_latch" mutex contention is finally arriving here on the top position too..
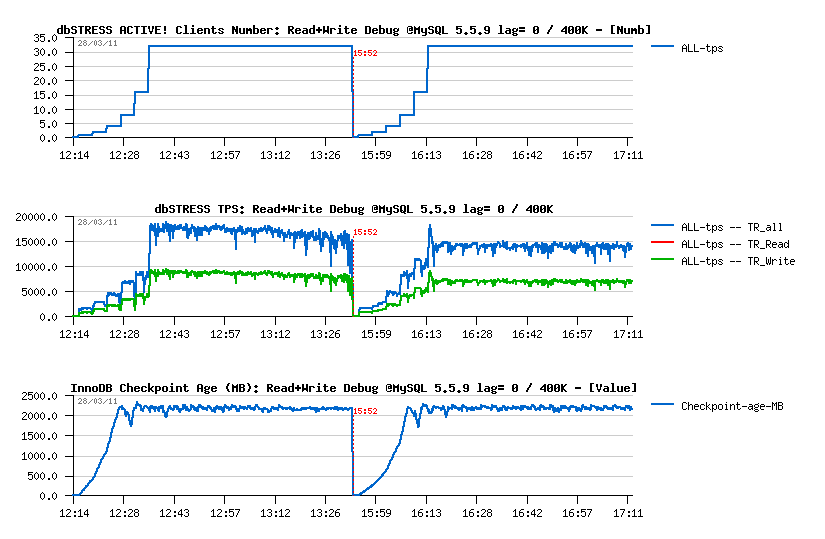
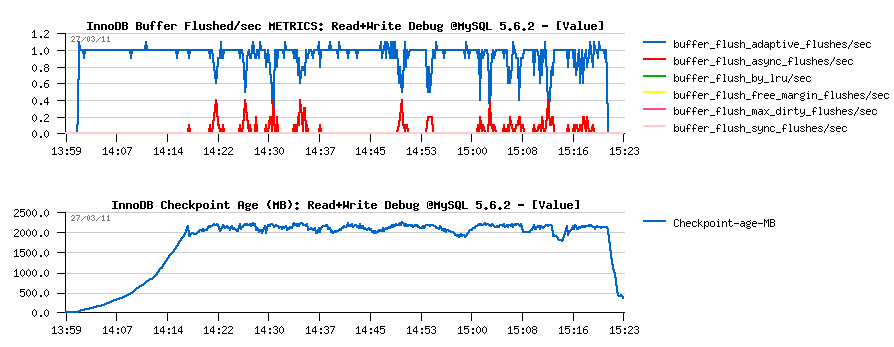
Read+Write Debug Workload @MySQL 5.6.2
-
Well, no surprise here about performance stability on this test:
- the only one thing is positive that TPS level looks higher than on 5.5.9, but it's very possible that it's just due a non purging..
- then TPS drops are well present..
- and TPS level is decreasing over a time:
-
Flushing issue is well explained by flush related stats reported by
METRICS:
- adaptive flushing is well active, but seems simply to not flush enough..
- "async" flushing is involved every time when the free REDO space reached a critical level..
- note that there were several "async" calls to reduce the Checkpoint Age..
- interesting that there was no one "sync" call over all the test duration..
- well, it's clear there is a room for improvement for the adaptive flushing:
-
Then once again, Purge is giving an impression to be "absent":
- History Length is still growing over a test
- Purge activity is "waking up" at the end (what is interesting that "del mark" records are reported now by METRICS as there are DELETE statements within this workload):
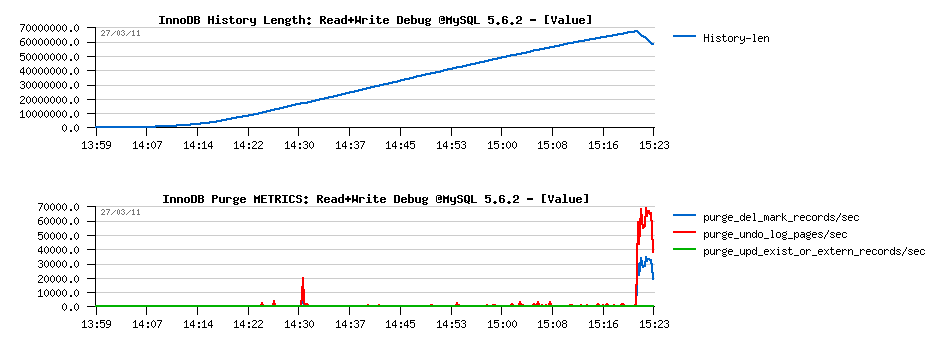
-
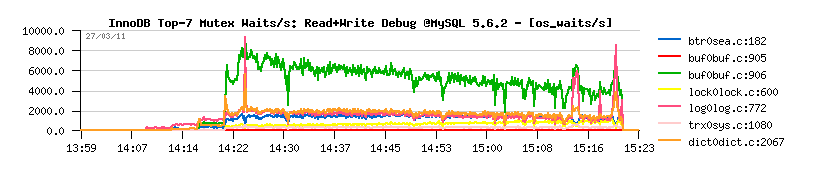
Curiously on the Mutex Waits:
- the top wait is a buffer pool "block mutex"
- and "trx_sys" mutex contention is not yet involved:
So far, if with Adaptive Flushing it's clear that in some cases it's simply not flushing enough and it should be just improved... - then regarding Purge there is something really going wrong and I have to get a look on it more closely.. It gives an "impression" to be "absent", but what kind of Purge activity we have on a single session?.. - still "absent"?.. on 2 sessions?.. 4?..
Let's get a look ;-)
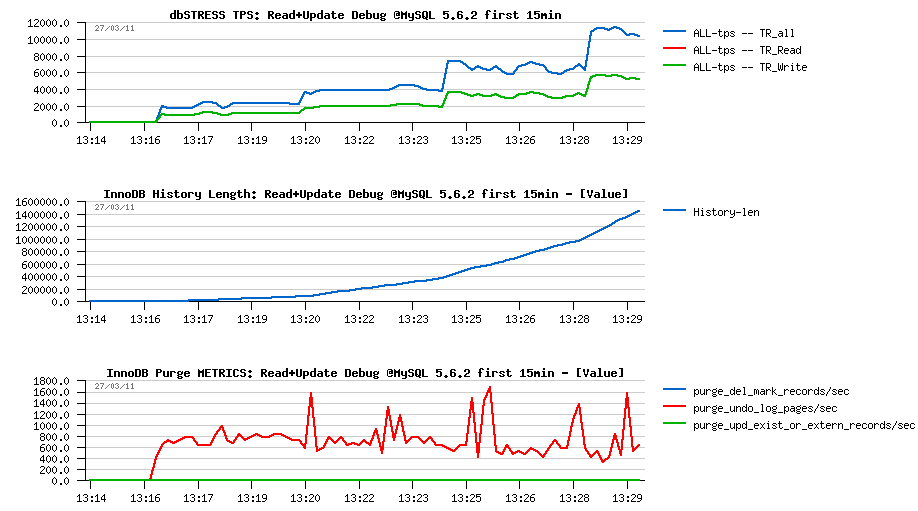
ANALYZE: First 15min of the Read+UPDATE Debug Workload @MySQL 5.6.2
-
Following are the graphs corresponding to the first 15min of
the Read+Update workload:
- As you see, History Length is growing from the beginning, even with a one single session!
- Purge activity is not absent - there is some amount of pages/sec purged for sure according the METRICS stats
- However, the amount of purged pages/sec remaining the same even on 1, 2, 4 or 8 concurrent sessions!..
- There is a problem on "Purge related" code for sure..
Don't think that this problem is related to dbSTRESS workload as on this test there are a simple series of SELECTs and UPDATEs, nothing special.. Will be interesting to see if the picture is the same on "sysbench" too..
Few comments about InnoDB METRICS table
The feature is really great as it's very easy to configure and request. I've finally enabled all counters as I did not observe any performance impact during my tests.
So added to my my.conf:
# Monitoring via METRICS table since MySQL 5.6
innodb_monitor_enable = '%'
Then to see a flushing activity for ex.:
mysql> select name, count from information_schema.INNODB_METRICS where name like '%flush%';
+-------------------------------------+-------------+
| name                                | count       |
+-------------------------------------+-------------+
| buffer_pool_pages_in_flush          |     -755812 |
| buffer_flush_adaptive_flushes       |        2144 |
| buffer_flush_adaptive_pages         |         564 |
| buffer_flush_async_flushes          |          15 |
| buffer_flush_async_pages            |        4140 |
| buffer_flush_sync_flushes           |           0 |
| buffer_flush_sync_pages             |           0 |
| buffer_flush_max_dirty_flushes      |           0 |
| buffer_flush_max_dirty_pages        |           0 |
| buffer_flush_free_margin_flushes    |           0 |
| buffer_flush_free_margin_pages      |           0 |
| buffer_flush_io_capacity_pct        |          14 |
| buffer_flush_batch_scanned          |     6990396 |
| buffer_flush_batch_num_scan         |       38816 |
| buffer_flush_batch_scanned_per_call |           0 |
| buffer_flush_batch_total_pages      |      755812 |
| buffer_flush_batches                |       38816 |
| buffer_flush_batch_pages            |          35 |
| buffer_flush_by_lru                 |           0 |
| buffer_flush_by_list                |      755812 |
| log_lsn_last_flush                  | 61648172324 |
| innodb_log_flush_usec               |    22705288 |
+-------------------------------------+-------------+
22 rows in set (0.00 sec)
Note: there is a negative value in "buffer_pool_pages_in_flush", should be a bug?
Few suggestions anyway:
- in many cases it makes sense to know not only the "current" / "last" counter value, but also a "total" (ex. flushed pages: it's fine to have the latest value, but without a "total" it's hard to follow the flushing activity as we're not always flushing the same amount of pages per flush call, etc.)..
- in some cases it makes sense also to present not only a number of times when the action was involved, but also a number of involved calls (for ex. we may call a flush more often than it's really involved (just because there is a batch in progress), but it'll be a direct sign that we're not flushing according to demand, etc. - same with purging, and probably others)..
- purge counter is missing (already reported to Jimmy)
Probably more to come, as for the moment I've mainly tracked Purge and Adaptive Flushing :-))
To be continued in the part 4...
blog comments powered by DisqusNote: if you don't see any "comment" dialog above, try to access this page with another web browser, or google for known issues on your browser and DISQUS..