« MySQL Performance: 5.6 Notes, part 5 - Fixing Adaptive Flushing.. | Main | dim_STAT: Experimental Core Upgrade v9-dev1 »
Friday, 29 April, 2011
MySQL Performance: 5.6.2 and Performance Schema
Last year I've published a post about Performance
Schema overhead which involved many (and sometimes very hot :-))
e-mail discussions and finally resulted in a massive code improvements
in MySQL Performance Schema (P_S) released by Marc
Alff.
Don't know if I was right, but in my mind the logic of
P_S "usability" should be matching following statements:
- There is no tracing or monitoring possible with a zero overhead, period.
- The overhead may be only lighter or heavier, depending on amount and kind of information we expecting to retrieve..
- Then, as such overhead is inevitable, a user should have some ways to minimize it whenever possible
- The most lightweight self-monitoring solution is probably to use event counters
- In many cases the cost of a simple incremental operation of a counter will be lower than condition check (IF operation), so the most light counters may remain active all the time incrementing their values on every corresponding event..
- Then measuring a time spent between or within various event will for sure bring additional cost..
- Then obtaining more detailed information may bring more overhead..
- So far - as soon as the overhead is predictable, a user may enable/disable any kind of tracing dynamically (on-demand), while a basic monitoring (with counters) should remain very lightweight - this will give you a possibility to keep a basic accounting always active even in production systems, and according reported information dynamically activate more detailed data collection when required..
Initial P_S implementation was already ready for any kind of dynamic activation of various event monitoring, but the overhead of even minimal data was really huge and it was hard to say if we observing the events because they are really present within MySQL activity or these events came due P_S overhead..
Improved Performance Schema
Mark made an enormous work to redesign P_S code (it should be probably not far from completely rewriting it again?) and made P_S overhead "managable" by user:
- there is no overhead if P_S is OFF
- there is near no overhead if P_S is ON but all CONSUMERS are disabled
- very low overhead when only global counters are enabled
- still low overhead when only global counters + timed are enabled
- then more overhead is coming since other instrumentations are also enabled..
Such an approach matched all my expectations and I was more than happy to replay the same workload tests with a new "prototype" code. The most important overhead is coming due mutex instrumentation - as mutex contention within MySQL and InnoDB is already very hot, adding few instructions more around mutexes is only increasing contentions, but, from the other hand, only self-instrumentation may bring you all needed information to understand your mutex contention on any HW/SW platform.. Other events instrumentation is having much less overhead, so it was logical for me to split events into 2 groups: "mutexes" and "not mutexes" :-)
The following results I've obtained on the "prototype" P_S overhead:
| Workload \ Case# | #1 | #2 | #3 | #4 | #5 | #6 | #7 |
| Read-Only | 2-3% | 3-4% | <5% | 5% | 7% | 5.5% | 7.5% |
| Read+Write | 2-3% | 3-4% | 4% | 5% | 7% | 10% | 19% |
where:
- case #1: P_S=ON, but all CONSUMERS=OFF (P_S infrastructure overhead)
- case #2: P_S=ON, Global instrumentation=ON, "non-mutex" INSTRUMENTS=ON & TIMED=OFF (only counters)
- case #3: P_S=ON, Global instrumentation=ON, "non-mutex" INSTRUMENTS=ON & TIMED=ON (counters & time)
- case #4: P_S=ON, Global instrumentation=ON, "mutex" INSTRUMENTS=ON + TIMED=OFF
- case #5: P_S=ON, Global instrumentation=ON, "mutex" INSTRUMENTS=ON + TIMED=ON
- case #6: P_S=ON, Global instrumentation=ON, "all" INSTRUMENTS=ON + TIMED=OFF
- case #7: P_S=ON, Global instrumentation=ON, "all" INSTRUMENTS=ON + TIMED=ON
all results were observed on 32 cores server running MySQL 5.5 under 32 non-stop concurrent sessions @dbSTRESS scenario - focusing on such a peak performance we observing probably the worst possible case of the possible P_S overhead..
What was very positive:
- you may run any server with P_S enabled by default with less than 3% overhead
- and if you don't need to monitor mutexes & rw-locks, you may monitor any other global instrumentation events (counters + times) with less than 5% overhead!
- then you may still go more in depth in your observations still keeping P_S overhead less than 5-10%
- and what was important: overhead was proportional !! - there was no one mutex contention for ex. reported by InnoDB jumped way higher than others (like it was in the initial code) - so it was finally possible to believe P_S observations!! :-)) (as contention did not become hotter due P_S itself)..
These results I've obtained last summer, but the code was not yet public and it was too late to get it included within MySQL 5.5 as it was prepared for GA.. So my results waited for the next official release :-))
The "improved" P_S code was shipped with MySQL 5.6.2 now, and I was ready to replay my tests again and expected to see even better results! :-)) (well, the time was against me as there were many performance issues on 5.6.2 itself, and P_S testing should yet wait and I've started my tests only after Collaborate & UC events..)
Improved Performance Schema within MySQL 5.6.2
Well, from the very first test I've got a feeling there is a bug somewhere.. - and here is why: it's absolutely abnormal to observe a 10% performance drop while P_S is enabled but all CONSUMERS are set to OFF! - there is simply no reason to have such an overhead.. - there is a problem here for sure!..
Then of course, having such a "starting" overhead the things may be only worse once you enable any other event monitoring..
Here are results I've obtained on using only Global instrumentation, but following the same test cases as before, except that I'm also presenting the "case #0" - means the performance results with P_S=OFF.
So, you'll see graphs corresponding with a series of tests for each workload:
- Read-Only (only SELECTs)
- Read+Update (only SELECTs & UPDATEs)
- Read+Write (SELECTs, DELETEs, INSERTs, UPDATEs)
There are 8 cases on each graph (the first one with P_S=OFF, then case #1, #2 .. #7 as described before)
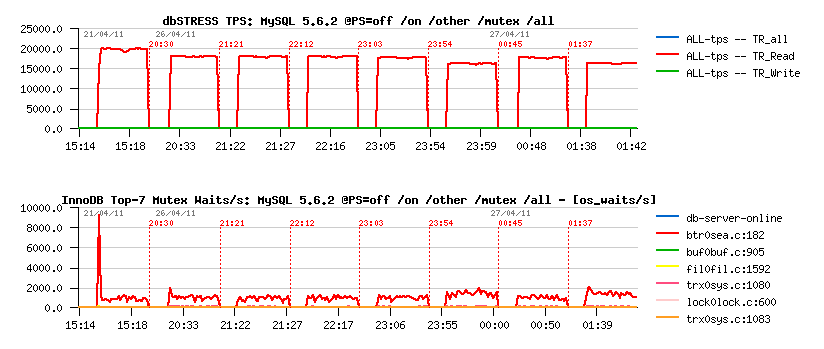
The first graph is representing TPS level, and the second one "mutex waits" reported by InnoDB (via show mutex status)
Only General Instrumentation
Read-Only:
Read+Update:

Read+Write:

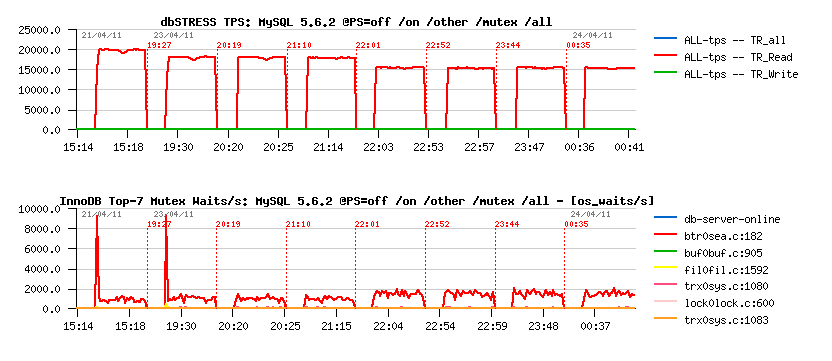
Including Thread Instrumentation
Read-Only:
Read+Update:

Read+Write:

SUMMARY
Read-Only Workload:
- 10% performance degradation just by enabling Performance Schema (even with all CONSUMERS=OFF)
- few more % if mutex counters are monitored
- 20% if mutex counters and times are monitored
- if thread instrumentation is enabled, even enabling mutex counters monitoring gives 25% performance degradation..
- looks like the contention is increasing on "btr_search_latch" (and it's the main wait event reported by P_S)
Read+Update:
- 11% performance degradation just due P_S=ON (while all CONSUMERS=OFF)
- same degradation with non-mutex monitoring
- 14% if mutex counters are monitored..
- 20% if mutex times are monitored..
- 25% if thread instrumentation is enabled..
- same "btr_search_latch" mutex contention seems to be increased (and also reported by P_S as the main wait event)
Read+Write:
- Read+Write workload looks like the most confusing here.. - seems the "index mutex" contention is amplified a lot once P_S is used
- I've got even a case when 50% performance regression was observed by a simple P_S=ON and all CONSUMERS=OFF, but it was only once, and as "index mutex" contention may vary depending on pages/data distribution, I've replayed same tests many times over many days to get a repeatable cases..
- so, 10% performance degradation just due P_S=ON (while all CONSUMERS=OFF)
- 50% performance degradation if any instrumentation is enabled - and this one is really bad.. - and another bad thing is that "index mutex" seems to be completely missed within P_S wait events!! - get a look on the following outputs:
After 15min of Read+Write activity:
- Global instrumentation enabled only & only counters:
mysql> select EVENT_NAME, COUNT_STAR, SUM_TIMER_WAIT
    from events_waits_summary_global_by_event_name  where COUNT_STAR > 0 order by 2 desc limit 9;
+-----------------------------------------------+------------+----------------+
| EVENT_NAME                                    | COUNT_STAR | SUM_TIMER_WAIT |
+-----------------------------------------------+------------+----------------+
| wait/synch/rwlock/innodb/btr_search_latch     |  194213885 |              0 |
| wait/synch/mutex/sql/THD::LOCK_thd_data       |  130483762 |              0 |
| wait/synch/rwlock/sql/MDL_lock::rwlock        |  117961162 |              0 |
| wait/synch/mutex/innodb/log_sys_mutex         |   99512532 |              0 |
| wait/synch/rwlock/innodb/trx_sys_lock         |   99232511 |              0 |
| wait/synch/mutex/innodb/lock_mutex            |   90526333 |              0 |
| wait/synch/mutex/innodb/trx_mutex             |   85860887 |              0 |
| wait/synch/mutex/innodb/os_mutex              |   75809522 |              0 |
| wait/synch/mutex/innodb/log_flush_order_mutex |   70425453 |              0 |
+-----------------------------------------------+------------+----------------+
- Now the same but also with TIMED=ON:
mysql> select EVENT_NAME, COUNT_STAR, SUM_TIMER_WAIT
    from events_waits_summary_global_by_event_name  where COUNT_STAR > 0 order by 3 desc limit 9;
+-------------------------------------------+------------+------------------+
| EVENT_NAME                                | COUNT_STAR | SUM_TIMER_WAIT   |
+-------------------------------------------+------------+------------------+
| wait/synch/rwlock/innodb/btr_search_latch |  181682131 | 1643655865693815 |
| wait/synch/mutex/innodb/log_sys_mutex     |   98647709 | 1575232422898909 |
| wait/synch/mutex/innodb/lock_mutex        |   90097450 |  511454993752395 |
| wait/io/file/innodb/innodb_log_file       |   16497696 |  338811884697501 |
| wait/synch/rwlock/innodb/trx_sys_lock     |   98949223 |  199377660204555 |
| wait/synch/mutex/sql/MDL_map::mutex       |   36595181 |   89693003023907 |
| wait/synch/rwlock/sql/MDL_lock::rwlock    |  117280165 |   74224835060149 |
| wait/synch/mutex/sql/LOCK_open            |   66895239 |   68799893812315 |
| wait/synch/mutex/innodb/os_mutex          |   75309279 |   59309074401932 |
+-------------------------------------------+------------+------------------+
As you can see, "index mutex" is not present here within top 9 wait
events even in counters (while InnoDB is reporting it to be the mutex
with the higher waits).. - that's why I think this mutex is simply
missed within P_S accounting (should be easy to fix I think). In
parallel, it's interesting to remark that time spent on waits on
"log_sys_mutex" is similar to time of "btr_search_latch" !! - while
there is 2 times more waits on the "btr_search_latch".. - it's a clear
advantage of P_S potential to report true contentions over a whole MySQL
code, but before it'll become "usable" the overhead should be fixed
first..
So far:
-
there is no any reason to have %10 performance degradation just by
enabling Performance Schema while all CONSUMERS are disabled - should
be fixed, 10% is too much, 2% will be acceptable (and it was already
so in "prototype")..
-
there should be no mutexes (from MySQL or InnoDB) missed within
Performance Schema instrumentation, otherwise we're not observing a
whole picture of wait events and may get a wrong conclusion ("index
mutex" is one of examples)..
- also, I don't think having all instrumentations enabled "by default" is a good idea!! - I think by default only global instrumentation + counters should be enabled and nothing else! - it'll avoid unexpected surprises from users who just started MySQL with P_S=on without looking too much into details about and just was told that P_S is cool :-) (same like InnoDB is a default engine now instead of MyISAM)..
Then, I'm very sorry to be not as fast on writing as I'd prefer, if I've published this article sooner it'd probably reduce work for Vadim to measure Performance Schema overhead and save some money for a "Well Know Social Network" :-)) - but it was so hard for me to believe there is a problem again within P_S code that I firstly suspected my own workloads rather P_S itself.. - and only once I was sure about repeatable results I was ready to publish them (but again, I'm not writing fast enough :-))..
Well, as I've already saw Performance Schema working really well, I think it's now only a question of time to get it fixed.. ;-))
blog comments powered by DisqusNote: if you don't see any "comment" dialog above, try to access this page with another web browser, or google for known issues on your browser and DISQUS..